Supplementary material

Results using the 8.58.58.5Å heavy atom criterion

In this work we have used the Cβ𝛽\beta criterion, that a pair of amino acids are in contact in a crystal structure if their Cβ𝛽\beta atoms (Cα𝛼\alpha in case of Glycines) are not more than 8absent8\leq 8Å apart. This kind of contact evaluation criterion has been used for some time in the biannual Critical Assessment of protein Structure Prediction (CASP) competition, and is considered standard in the field of protein structure prediction [5, 6]. In the context of DCA it was used, with a threshold of 888Å, in [3] and [8].

No fixed criterion of this kind will be perfect. The threshold to use depends on the desired trade-off between false negatives and false positives, and that depends on the intended application. For a reasonable threshold, such as around 888Å, there will be some pairs of amino acids which satisfy the Cβ𝛽\beta criterion, but nevertheless probably do not make any contact, at least in one given crystal structure, and there will be some pairs of amino acids which do not satisfy the Cβ𝛽\beta criterion, but where the side chains in fact do make contact. In both cases the residue types will matter, an aspect which is not taken into account by the Cβ𝛽\beta criterion.

Several earlier publications on DCA have, following [7], used an alternative criterion which we call the heavy atom criterion, where a a pair of amino acids are taken to be in contact if the distance between the two closest heavy (i.e. non-hydrogen) atoms of the two amino acids in question is less than some threshold around 888Å. To faciliate comparision we show in this supplementary material results using the heavy atom criterion with a threshold of 8.58.58.5Å, as used by one of us in [1].

Figures and tables in this supplementary material are numbered identically as in the main paper, and are based on the same data, the only difference being that we use throughout the 8.58.58.5Å heavy atom criterion. It is evident that the 888Å Cβ𝛽\beta criterion is more stringent than the 8.58.58.5Å (or 888Å) heavy atom criterion. A main difference will therefore be that nominal PPVs will be higher using the heavy atom criterion, other differences will be pointed out in figure captions. We note that a heavy atom criterion with substantially smaller thresholds have also been proposed in the literature, such as 666Å in [3], 555Å in [4] and 4.54.54.5Å in a paper from before the DCA era [2]. We do not here make any comparisons to the heavy atom criterion with these choices of thresholds. References cited in this supplementary material are listed in a separate bibliography.

Refer to caption
Refer to caption
Figure 1: Examples of qualitative contact prediction improvement. Left panel: contact prediction maps built by plmDCA and gplmCDA using protein sequences homologous to 1JFU as explained in Methods. plmDCA here predicts a number of strong couplings at both the N-terminus and the C-terminus which arise from the high sequence variability at both ends of proteins homologous to 1JFU, and the many gaps in the multiple sequence alignments at these positions. In gplmDCA these gaps lead to adjustment of gap parameters and not to contact predictions. Right panel: analogous results using protein sequences homologous to 1ATZ where gplmDCA removes strong spurious couplings at the C-terminus. Remarks pertaining to the 8.5Å8.5Å8.5\hbox{\AA{}} heavy atom criterion: The PPVs are substantially higher, in the range 0.890.950.890.950.89-0.95, and the relative improvement is less pronounced than using the Cβ𝛽\beta criterion.
Refer to caption
Refer to caption
Figure 2: Absolute PPV, average over all proteins in the main test data set. The curves show for PSICOV, plmDCA and gplmDCA the average of the number of correct predictions in the n𝑛n highest scoring pairs divided by n𝑛n; Left panel: PPV for absolute contact index. The horizontal axis shows n𝑛n. According to the 8.5Å8.5Å8.5\hbox{\AA{}} heavy atom criterion plmDCA performs on par with gplmDCA at n𝑛n greater than about 100100100. Right panel: PPV for relative contact index (fraction of protein length). The horizontal axis shows (n/N)100𝑛𝑁100(n/N)\cdot 100. Remarks pertaining to the 8.5Å8.5Å8.5\hbox{\AA{}} heavy atom criterion: Left panel: plmDCA performs on par with gplmDCA at values of n𝑛n greater than about 100100100. Right panel: in difference to the data shown in right panel of Figure 2 in main paper, plmDCA here performs on par with gplmDCA over the full range of n𝑛n.
Refer to caption
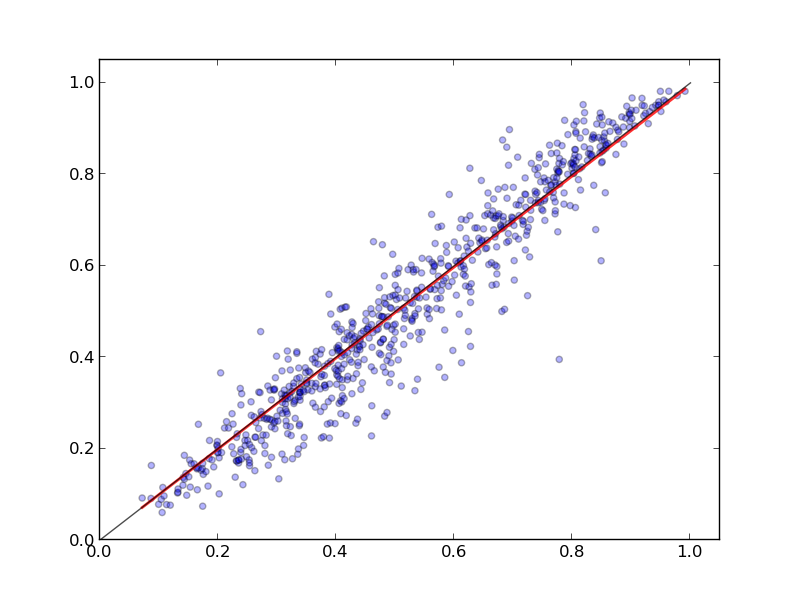
Figure 3: Contact prediction accuracy (mean absolute PPV) for proteins in the main test set by plmDCA (abscissa) and gplmDCA (ordinate). Data points can be fitted by a straight line with slope 0.996±0.004plus-or-minus0.9960.0040.996\pm 0.004 (R2=0.986superscript𝑅20.986R^{2}=0.986). Remarks pertaining to the 8.5Å8.5Å8.5\hbox{\AA{}} heavy atom criterion: By the 8.5 Å heavy atom criterion there is no difference between plmDCA and gplmDCA.
Cutoff Proteins Better Better or equal
0.80 108 89 (0.82) 102 (0.94)
0.70 196 145 (0.74) 168 (0.86)
0.60 289 197 (0.68) 231 (0.80)
0.50 378 238 (0.63) 274 (0.72)
0.40 497 294 (0.59) 337 (0.68)
0.30 623 326 (0.52) 380 (0.61)
0.20 724 354 (0.49) 411 (0.57)
0.15 770 363 (0.47) 420 (0.55)
0.10 791 366 (0.46) 424 (0.54)
0.05 801 369 (0.46) 427 (0.53)
ALL 801 369 (0.46) 427 (0.53)
Table 1: Numbers and fraction of proteins where gplmDCA performs better than plmDCA. In each row all proteins in the data set are included for which the PPV from both plmDCA and gplmDCA is larger than the cutoff value given in the first column. The full data set (last row) consists of 801 proteins for 369 (46%) of which gplmDCA performs better than plmDCA. In the most stringent selection (first row) there are 108 proteins where both plmDCA and gplmDCA have a PPV at least 0.8. In this set gplmDCA performs better on 89 (82%) of the instances.
Refer to caption
Refer to caption
Refer to caption
Refer to caption
Figure 4: Contact prediction accuracy for proteins in the test set by gplmDCA and plmDCA vs number of sequences in the alignment, when considering top 10%, 25% (top row), 50% and 100% (bottom row) contacts, 100% being the same number of contacts as the number of amino acids in the protein. The advantage of gplmDCA is particularly interesting in ranges highlighted by vertical dotted lines. For the top 10% and top 25% (top row) these ranges are approximately 350-3000 and 500-7000 sequences (279 and 359 out of 801 proteins), while for the top 50% and top 100% (bottom row) they correspondingly in the ranges of 1000-7000 sequences (291 proteins) and 2000 sequences in the alignment and upwards (454 out of 801 proteins). PSICOV outperforms both plmDCA and gplmDCA when there are less than about 100 sequences in the alignment. The peak around 500-sequence point is due to concentration of β𝛽\beta-sheet rich proteins (mostly hydrolases), that seem to be particularly amiable to contact prediction.

Remarks pertaining to the 8.5Å8.5Å8.5\hbox{\AA{}} heavy atom criterion: Compared to Figure 4 in the main paper gplmDCA here shows an advantage in more limited ranges.

Refer to caption
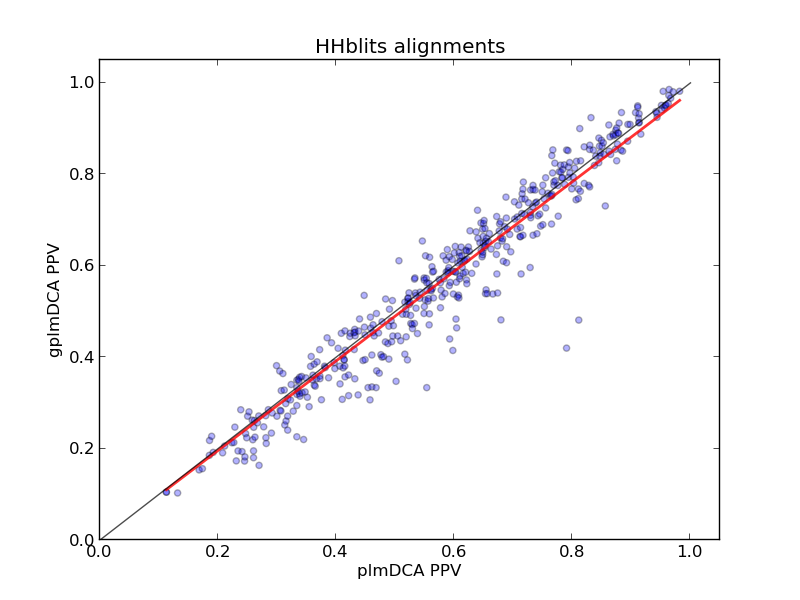
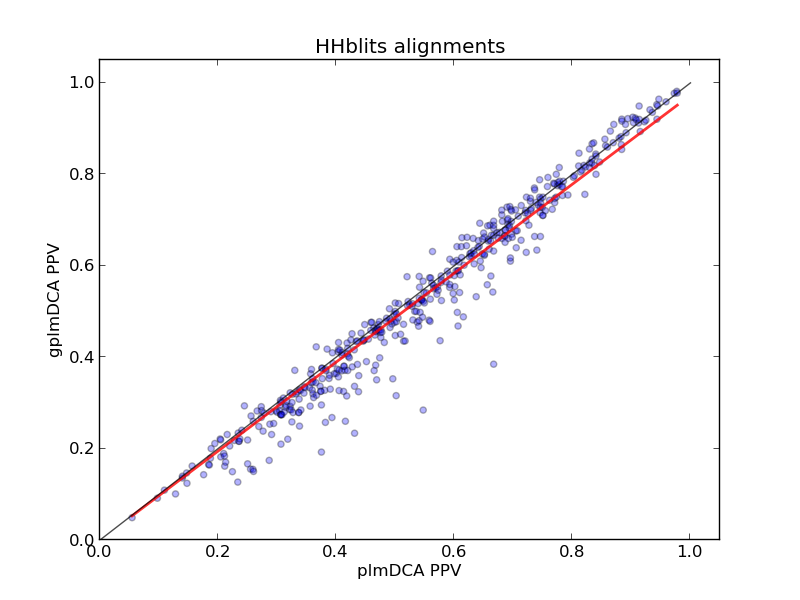
Figure 5: Prediction by absolute PPV and 8.5Å8.5italic-Å8.5\AA{} heavy atom criterion for gplmDCA and plmDCA run on Pfam and HHblits alignments in the reduced test data set. The reduced test data set comprises the proteins in the main test data set where a comparison can be made to Pfam alignments, as described in Methods. Remarks pertaining to the 8.5Å8.5Å8.5\hbox{\AA{}} heavy atom criterion: As in the data shown in Figure 5 in the main paper, contact prediction is more effective using HHblits alignments. In contrast to Figure 5 in the main paper, gplmDCA here does not show an advantage over plmDCA.
Refer to caption
Refer to caption
Refer to caption
Refer to caption
Figure 6: Scatter plots of prediction by absolute PPV and 8.58.58.5Å heavy atom criterion for individual proteins in the reduced test data set. Top row shows, analogously to Figure 3 (for the main data set), gplmDCA vs plmDCA for Pfam alignments (left panel) and for HHblits alignments (right panel). Bottom row shows prediction for HHblits alignments vs Pfam alignments using plmDCA (left panel) and gplmDCA (right panel). Remarks pertaining to the 8.5Å8.5Å8.5\hbox{\AA{}} heavy atom criterion: As in Figure 3 there is here no advantage of gplmDCA over plmDCA.

References

  • [1] Magnus Ekeberg, Cecilia Lövkvist, Yueheng Lan, Martin Weigt, and Erik Aurell. Improved contact prediction in proteins: Using pseudolikelihoods to infer potts models. Physical Review E, 87(1):012707, 2013.
  • [2] P Fariselli and R Casadio. A neural network based predictor of residue contacts in proteins. Protein Eng., 12(1):15–21, 1999.
  • [3] David T. Jones, Daniel W. A. Buchan, Domenico Cozzetto, and Massimiliano Pontil. PSICOV: precise structural contact prediction using sparse inverse covariance estimation on large multiple sequence alignments. Bioinformatics, 28:184, 2012.
  • [4] Debora S. Marks, Lucy J. Colwell, Robert Sheridan, Thomas A. Hopf, Andrea Pagnani, Riccardo Zecchina, and Chris Sander. Protein 3D structure computed from evolutionary sequence variation. PLoS ONE, 6(12):e28766, December 2011.
  • [5] Bohdan Monastyrskyy, Daniel D’Andrea, Krzysztof Fidelis, Anna Tramontano, and Andriy Kryshtafovych. Evaluation of residue–residue contact prediction in CASP10. Proteins: Structure, Function, and Bioinformatics, 82:138–153, 2014.
  • [6] Bohdan Monastyrskyy, Krzysztof Fidelis, Anna Tramontano, and Andriy Kryshtafovych. Evaluation of residue–residue contact prediction in CASP9. Proteins: Structure, Function, and Bioinformatics, 79:119–125, 2011.
  • [7] Faruck Morcos, Andrea Pagnani, Bryan Lunt, Arianna Bertolino, Debora S. Marks, Chris Sander, Riccardo Zecchina, José N. Onuchic, Terence Hwa, and Martin Weigt. Direct-coupling analysis of residue coevolution captures native contacts across many protein families. Proceedings of the National Academy of Sciences, 108(49):E1293–E1301, 2011.
  • [8] M. J. Skwark, A. Abdel-Rehim, and A. Elofsson. PconsC: combination of direct information methods and alignments improves contact prediction. Bioinformatics, 29(14):1815–1816, Jul 2013.