Chandra X-ray spectroscopy of a clear dip in GX 13+1
Abstract
Context. The source GX 13+1 is a persistent, bright Galactic X-ray binary hosting an accreting neutron star. It shows highly ionized absorption features, with a blueshift of 400 km s-1 and an outflow-mass rate similar to the accretion rate. Many other X-ray sources exhibit warm absorption features, and they all show periodic dipping behavior at the same time. Recently, a dipping periodicity has also been determined for GX 13+1 using long-term X-ray folded light-curves, leading to a clear identification of one of such periodic dips in an archival observation.
Aims. We give the first spectral characterization of the periodic dip of GX 13+1 found in this archival Chandra observation performed in 2010.
Methods. We used Chandra/HETGS data (1.0–10 keV band) and contemporaneous RXTE/PCA data (3.5–25 keV) to analyze the broad-band X-ray spectrum. We adopted different spectral models to describe the continuum emission and used the XSTAR-derived warm absorber component to constrain the highly ionized absorption features.
Results. The 1.0–25 keV continuum emission is consistent with a model of soft accretion-disk emission and an optically thick, harder Comptonized component. The dip event, lasting 450 s, is spectrally resolved with an increase in the column density of the neutral absorber, while we do not find significant variations in the column density and ionization parameter of the warm absorber with respect to the out-of-dip spectrum.
Conclusions. We argue that the very low dipping duty-cycle with respect to other sources of the same class can be ascribed to its long orbital period and the mostly neutral bulge, that is relatively small compared with the dimensions of the outer disk radius.
Key Words.:
line: identification – line: formation – stars: individual (GX 13+1) — X-rays: binaries — X-rays: general1 Introduction
Low-mass X-ray binary (LMXB) dipping sources are characterized by periodic (or quasi-periodic) dips in their light-curves that are evidence for a fixed structure in the reference frame of the binary system. These dips may also be related to super-orbital periodicities, which are more difficult to constrain when their appearance is transient (Grisé et al., 2013). To date, 13 LMXBs hosting a neutron star (NS) and 6 LMXBs hosting a black hole have shown clear dips in their light curves. In Table 1, we show an updated list of these sources with some basic data and references to the literature.
| NEUTRON STAR LMXBs | |||||
|---|---|---|---|---|---|
| Source | P | M2 | D | Ref. (dips) | Ref. (WA) |
| hr | M | kpc | |||
| EXO 0748-676 | 3.82 | 0.1? | 7.11.2 | 1a | 1b |
| 4U 1254-690 | 3.88 | 0.4? | 10? | 2a | 2b |
| GX 13+1 | 588 | 1.1 | 71 | 3a | 3b |
| 4U 1323-62 | 2.94 | 0.3? | 10? | 4a | 4b |
| X1624-490 | 20.9 | 2.3? | 15? | 5a | 5b |
| X1658-298 | 7.12 | 0.8? | 15? | 6a | 6b |
| XTE J1710-281 | 3.28 | 0.4? | 16? | 7 | |
| AX J1745.6–2901 | 8.35 | 0.9? | 10? | 8 | |
| 1A 1744-361 | 0.87? | 0.1? | 9? | 9a | 9b |
| XB 1746-371 | 5.73 | 0.6? | 9? | 10a | 10b |
| GRS J1747-312 | 12.4 | 4.53.5 | 6.80.5 | 11 | |
| XB 1916-053 | 0.83 | 0.1? | 9? | 12a | 12b |
| Cir X-1 | 400.32 | 10? | 6? | 13a | 13b |
| BLACK-HOLE LMXBs | |||||
| GRO J1655-40a𝑎aa𝑎aM = 7.00.2 | 62.92 | 2.340.12 | 3.20.2 | 14a | 14b |
| H 1743-322 | 10? | 8.5? | 15a | 15b | |
| GRS 1915+105b𝑏bb𝑏bM = 12.92.4 | 739.2 | 0.80.5 | 9.40.2 | 16a | 16b |
| 4U 1630-47 | 10? | 17a | |||
| MAXI J1659-152 | 2.414 | 0.200.05 | 8.63.7 | 18a | |
| MAXI J1305-704 | 9.74 | 1? | 6? | 19 | |
(1a) Parmar et al. (1986); (1b) van Peet et al. (2009); (2a) Smale et al. (2002); (2b) Díaz Trigo et al. (2009); (3a) Iaria et al. (2014); (3b) Díaz Trigo et al. (2012); (4a) Parmar et al. (1989); (4b) Boirin et al. (2005); (5a) Smale et al. (2001); (5b) Iaria et al. (2007); (6a) Oosterbroek et al. (2001); (6b) Sidoli et al. (2001); (7) Younes et al. (2009); (8) Hyodo et al. (2009); (9a) Bhattacharyya et al. (2006); (9b) Gavriil et al. (2012); (10a) Bałucińska-Church et al. (2004); (10b) Díaz Trigo et al. (2006); (11) in’t Zand et al. (2003); (12a) White & Holt (1982); (12b) Boirin et al. (2004); (13a) Shirey et al. (1999); (13b) D’Aí et al. (2007); (14a) Kuulkers et al. (1998); (14b) Ueda et al. (1998); (15a) Homan et al. (2005); (15b) Miller et al. (2006); (16a) Naik et al. (2001); (16b) Lee et al. (2002); (17) Kuulkers et al. (1998); (18)Kuulkers et al. (2013); (19)Shidatsu et al. (2013).
Two main physical models are widely discussed in the literature to explain the occurrence of dips: White & Holt (1982) proposed a variable, azimuthal-dependent height of the accretion disk’s outer rim and a large system-inclination angle. According to the orbital phase, our line-of-sight partially or totally intercepts the rim that causes local absorption of X-rays produced in the innermost parts of the system. The rim geometry was empirically adjusted by matching synthesized geometries and the regular patterns observed in the light curves (both at X-rays and in the optical-UV, e.g. for 4U 1822-371, Mason, 1986). Some dippers also show periods without dips, which points to a strong variability of the occulting regions (Smale & Wachter, 1999). Alternatively, another explanation was proposed by Frank et al. (1987): if matter from the companion star is able to skim across the thickness of the outer accretion disk, part of the incoming stream may impact the disk at a much closer radius (Lubow, 1989); when part of this stream collides with the disk, it is quickly dynamically and thermally virialized; but a fraction of it (which is a tunable parameter of the model) receives energy from the impact shock and splits into a two-zone medium, forming blobs of cold, condensed gas, surrounded by a lower density hotter plasma at large scale-heights above the disk (Krolik et al., 1981). This scenario is able to partially account for many empirical facts such as the dip’s periodic occurrence, the dependence on orbital phase, and the duration and time scales of the single dips. Both scenarios involve the common ingredient of a high inclination angle. For low-mass companion stars with short orbital periods ( 1 day), the inferred inclination angle, , is constrained between 65∘ and 85∘, while for higher inclinations eclipses are also expected. In these eclipsing binaries, direct emission from the NS is blocked by the disk thickness and only scattered emission from an accretion-disk corona (ADC) may be observed (Iaria et al., 2013).
Together with these physical scenarios, many studies have been focused on deriving geometrical and physical constraints by spectrally resolving the dip events. Spectra from dipping sources have been fitted using a two-component spectral decomposition consisting of a thermal black-body emission from the surface of the NS and a Comptonized emission (usually fitted with a cut-off power-law). Seed photons of the Comptonized spectrum come from the accretion disk and the Comptonization is thought to occur at large disk radii in an extended corona, whose radius is 109 cm. Using the ingress and egress times of the deep dips (where emission is totally blocked at the dip bottom), it has been shown that the corona emission is gradually covered (progressive covering approach) and therefore extended, with a disk-like geometry, while the black-body emission is point-like and attributed to the NS emission (Church & Bałucińska-Church, 2004). The main assumption in deriving the estimates for the ADC radius is that the dip is caused by the bulge located at the outer accretion disk (as described by the geometry envisaged by White & Holt, 1982), whose main effect is a progressive photoelectric absorption of the primary incident source flux.
Detection in the past decade of resonant absorption features of highly ionized elements in the X-ray spectrum (see Table 1) has provided new clues for separating the spectral formation. Local absorption features often appear to be blue-shifted, which points to a disk-wind or generally out-flowing, photoionized plasma. The ionization state of the optically thick absorbing plasma is variable and the time scales can be as short as a few ks (Ueda et al., 2004), with a wind velocity of thousands of km/s. In all cases, the most clearly resolved lines are from H-like and He-like transitions of iron, which implies that the ionization parameter, , of the warm absorber is 100 (Kallman et al., 2004). Boirin et al. (2005) first advanced the hypothesis that during dipping there might be a tight relation between cold and warm absorption because the overall X-ray variability during dipping would be driven by fast changes in the column density and ionization state of the warm absorbing medium along our line of sight. In this scenario, there is no more need for a partial covering of an extended continuum corona because the soft excess observed during dipping is naturally accounted for by a combination of strong increase in the column density of the warm medium and a decrease of its ionization parameter. Outside dips, a warm absorber has been always observed, which implies that the medium has a cylindrical distribution and is not confined to the locus of the bulge. In light of these findings, the continuum decomposition has also been questioned, because an extended corona was felt to be less necessary (Díaz Trigo et al., 2012).
The source GX13+1
The source GX 13+1 is a persistent X-ray binary system belonging to the so-called class of GX bright bulge sources, with an estimated distance of 7 1 kpc. The compact object is an accreting NS that has sporadically shown type-I X-ray bursts (Matsuba et al., 1995), orbiting an evolved mass-donor giant star of spectral class KIII V (Bandyopadhyay et al., 1999). The system has peculiar characteristics, being in between the classification of low-mass and high-mass systems; this is also testified by the long orbital period of 24 days (Corbet et al., 2010; Iaria et al., 2014), which makes it the LMXB with the second-longest orbital period after GRS 1915+105 (30.8 d period; it has a black hole as accreting compact object).
The 3–20 keV Rossi-XTE (RXTE) spectrum of GX 13+1 has been investigated by Homan et al. (2004), in connection with its radio emission. The spectrum was deconvolved according to the Eastern interpretation, that is the sum of a softer multicolored accretion-disk emission and a thermal Comptonized, harder optically thick emission in the boundary layer. The low-resolution RXTE/PCA spectrum also needed some local features (broad iron Gaussian line and a 9 keV absorption edge) to obtain a satisfactory fit. More recently, emission of higher than 20 keV has been observed with INTEGRAL/ISGRI data (Paizis et al., 2006), and was subsequently analyzed according to a thermal plus bulk Comptonization model (Mainardi et al., 2010).
Using narrower bands such as the 1–10 keV CCD typical range, the general continuum adopted was found to be well approximated with the sum of soft disk emission and black-body harder emission (Ueda et al., 2001; Sidoli et al., 2002; Ueda et al., 2004; Díaz Trigo et al., 2012). The black-body emission approximates an optically thick Comptonized emission, which we deduce from the difficulty in constraining both the optical depth and the electron temperature with a limited energy range and the high optical depths characteristics of the very soft spectra of bright accreting NS LMXBs. Analysis of K- edge depths has also shown that in the direction of the source the ISM composition (or absorbing, circumbinary cold matter) is significantly overabundant in elements heavier than oxygen (Ueda et al., 2005, e.g. silicon and sulphur), with X-ray fine-structure absorption features (XAFS) around the Si and S K- edges.
High-resolution spectroscopy with the Chandra HETGS revealed a radiatively/thermally driven disk wind with an outflow velocity of 400 km s-1 and multiple absorption features from highly ionized elements (Ueda et al., 2004). The wind probably carries a significant fraction of the total mass-accretion rate, up to 1018 g s-1. Observations with XMM-Newton also revealed a broad (equivalent width 100 eV) iron emission line, whose origin is associated to a disk-reflection component, and the broad width is ascribed to Compton broadening in the warm corona. A global spectral account of the total variability has also been proposed, where the main drivers for the spectral variability are neutral cold absorption and variability associated with a reflection component (Díaz Trigo et al., 2012).
Periodic dipping in the LMXB GX 13+1 was suspected for a long time, on the basis of an energy-dependent modulation observed in long-term light curves (Corbet et al., 2010; Díaz Trigo et al., 2012). Iaria et al. (2014) systematically searched in archived X-ray observations for clear signatures of periodic dips. Applying timing techniques to long-term folded X-ray light curves provided a successful method that led to a refined orbital-period estimate (24.5274(2) d) and to the first ephemeris for the dip passage times. The only periodic dip that could be assigned on the basis of this ephemeris for a pointed X-ray observation was in an archival Chandra observation performed in 2010. This corroborates that inclination is a key factor to spot warm absorbing winds in LMXBs and that they are optically thick to radiation only close to the plane of the accretion disk. This relation has recently also been pointed out by Ponti et al. (2012) for Galactic LXMBs hosting black-holes. We present in this article the results of the spectroscopic analysis of the dip event, showing that the main driver of the dipping in this source is an increase in cold photoelectric absorption.
2 Observation and data reduction
We used CIAO 4.5 for the Chandra data extraction and analysis, CALDB 4.4.7 for the calibration data files, the software package HeaSOFT version 6.13 for the RXTE/PCA data extraction, reduction, and scientific analysis, the Interactive Spectral Interpretation System (ISIS) 1.6.2 (Houck, 2002) for the spectral fitting, and Xspec v.12.8.1 for spectral models. Observation times are given in Coordinated Universal Time (UTC).
2.1 Chandra observation
The source GX 13+1 was observed multiple times with the Chandra observatory from 2004 to 2012. For the present work we used the observation with sequence number 11814 from the Chandra archive. The observation started at 2010-08-01 00:32:37 UTC and lasted 28.12 ks. At the same time the Rossi-XTE satellite observed the source, which provided overlapping, although not complete, monitoring.
The observation performed in (faint) timed exposure mode used the High Transmission Grating Spectrometer (HETGS) to diffract the spectrum, and a (350 rows) subarray of the ACIS-S detector to mitigate the effects of photon pile-up, with a CCD frame time of 1.24104 s.
The brightness of the source ( 6 10-9 erg cm-2 s-1) prevented studying the zeroth-order events since these are strongly affected by pile-up. The location of the center of the zeroth-order image was therefore determined using the tg_findzo script222http://space.mit.edu/cxc/analysis/findzo/, as recommended by the Chandra team in case of zeroth-order pile-up. We derived a source position at R.A. = 18h 14m 31s.08, Dec (J2000) = -17 09 26.1 (J2000, 0.6 uncertainty), compatible with the coordinates reported in Iaria et al. (2014). Data were extracted from regions around the medium- and high-energy grating arms (MEG and HEG) with the tg_create_mask tool, manually setting the zeroth-order position as derived by the tg_findzo script and choosing a width for HEG and MEG arms of 25 sky pixels. We extracted only first-order positive (HEG+1, MEG+1) and negative (HEG-1, MEG-1) spectra, as they provide the best signal-to-noise ratio and higher orders are mostly affected by pile-up. We used standard CIAO tools to derive all the other related spectral products.
Spectra were finally re-binned to have at least 25 counts per energy channel to allow the use of statistics. We used the HEG spectra in the 1.0–10.0 keV range and the MEG spectra in the 1.0–5.0 keV range; both spectra are background-dominated below 1 keV.
2.2 RXTE observation
For RXTE/PCA spectra we used source and background spectra, matrices and ancillary responses generated according to standard pipelines and selection criteria333http://heasarc.nasa.gov/docs/xte/recipes/pca_spectra.html#analysis. We used only events from PCU2 data, as this PCU more completely and uniformly overlapped with the Chandra observation, and limited our spectral analysis to the top-layer events as these provide the best signal-to-noise spectra in the 3.5–25.0 keV energy range, where the response matrix is best calibrated; a systematic error of 1% was added in quadrature to the statistical error. For light curves and hardness ratios we exploited the broader range 2.0–30.0 keV. The details of the observations used for the analysis are summarized in Table 2.
| ObsId | TSTART | Exposure | Rate |
|---|---|---|---|
| UTC | s | cts s-1 | |
| 95338-01-01-04 | 2010-08-01 01:25:34 | 752 | 715.61.0 |
| 95338-01-01-03 | 03:00:46 | 1104 | 737.50.8 |
| 95338-01-01-02 | 04:35:26 | 1328 | 780.20.8 |
| 95338-01-01-01 | 06:09:34 | 2000 | 630.00.6 |
| 95338-01-01-05 | 07:43:42 | 3152 | 594.40.4 |
3 Light curves and time-selected spectral analysis
In Fig. 1 we show the Chandra light curve in the 1.0–10.0 keV range, extracted from the ACIS-S HEG first-order diffraction arm and the hardness ratio defined from the (4.0–10.0 keV)/(1.0–4.0 keV) count ratio. The dip is clearly chromatic, the hardening is smooth, and the center of the dip falls at 2010-08-01 05:23:22.848 UTC; the dip, which is neatly resolved, is quite symmetrical with ingress and egress times that are nearly coincidental, although the smooth ingress/egress times and the correlated variation of the persistent emission does not allow us to strictly define its temporal duration. Fitting the dip shape with a Gaussian in a local (750 s wide) neighborhood of the dip center, we derived a full width at half maximum of 450 s. Before and after the dip, the spectrum shows an overall smooth and moderate softening. In the pre-dip part of the observation, the average count rate and hardness ratio are 24.40.1 cts s-1 and 0.7980.003, in the post-dip part these are 20.20.1 cts s-1 and 0.7730.003.

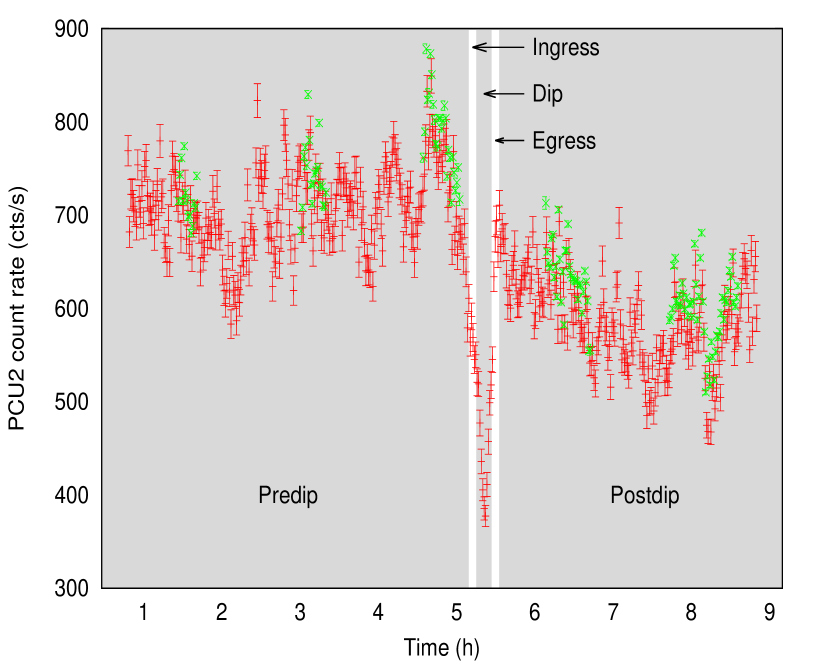
In Fig. 2, we show the PCU2 count rates in the selected energy band 2–6 and 6–10 keV and the hardness ratio. While there is modest variability in the first three pointings, a significant increase in the hardness is evident in the last two. But the dip event, observed in the continuous Chandra pointing, was unfortunately missed by .

On the basis of these hardness ratios, keeping the number of spectra reasonably within the need to have sufficient statistics to constrain the main spectral parameters, we created the good-time intervals (Table 4) and then extracted the corresponding energy spectra. RXTE/PCA observations were summed with the mathpha tool, after we verified their spectral consistency.
In Fig. 3 we show the PCU2 pointed observations overimposed to the Chandra light curve (the HEG rate is multiplied by a factor of 24 to visually match the PCU2 data), and the time selections through alternating white and gray overlays. Two main longer intervals identify the pre-dip and post-dip spectra; one interval is centred around the dip bottom and two shorter intervals trace the ingress and egress passages (we did not use a specific cut on the count rate to define these intervals) for a total of five time-selected spectra.
.
| Spectrum | HEG rate | RXTE datasets | |
|---|---|---|---|
| s | cts s-1 | ||
| Pre-dip | 995–16734 | 24.430.04 | 04/03/02 |
| Ingress | 16734–17084 | 19.40.6 | NONE |
| Dip | 17084–17784 | 15.20.3 | NONE |
| Egress | 17784–18134 | 22.00.6 | NONE |
| Post-dip | 18134–30065 | 20.300.05 | 01/05 |
Spectral analysis
3.1 Pile-up treatment
Because of the intense source flux the Chandra grating spectra are moderately affected by pile-up. To assess its impact, we used in the spectral fits the convolution component simple_gpile2 developed by Hanke et al. (2009) from the original code in Nowak et al. (2008). The main effect of pile-up for first-order spectra is to reduce the effective count rate in each detector pixel. The simple_gpile2 uses the free fitting parameter , which corrects the detector count rate according to the equation
| (1) |
where is the observed detector count rate, is the count rate computed according to the total source fluxes (summed over all orders), and is expressed in units of s Å/cts. The parameter is free to vary for each HEG/MEG dataset, with an expected value that is the function of the time frame and detector wavelength accuracy, as expressed by the simple relation where corresponds to 5.5 mÅ for the HEG grating arm, and 11 mÅ for the MEG arm, and = 1.24 s for this observation. The factor 3 takes into account that the detection cell is constituted by a three-pixel array.
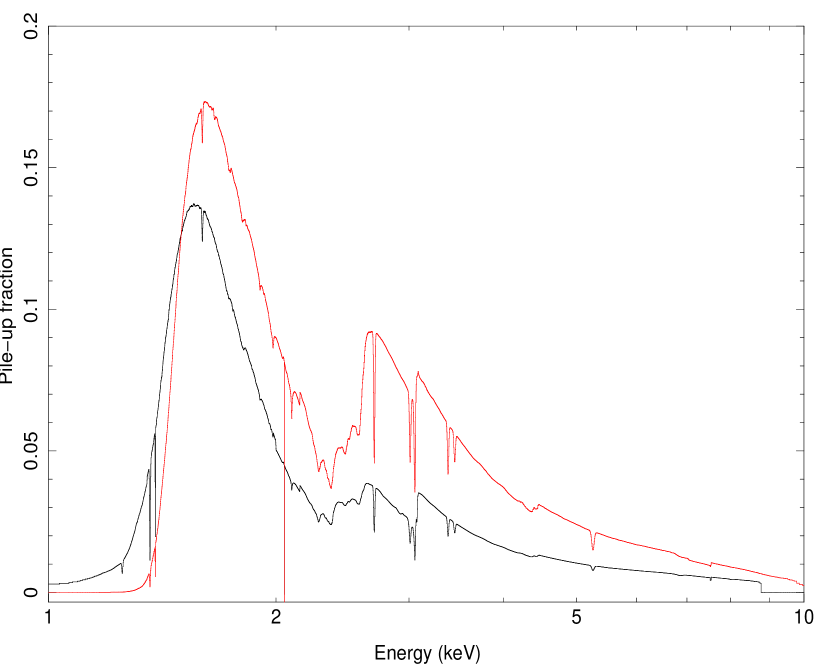
In Fig.4, we show the pile-up fraction as a function of energy according to the best-fitting model discussed in Section 3.2. We found that the parameters did not strongly depend on the continuum choice and showed little variation for the time-selected spectra. The pile-up fraction, as expected, reached higher values for the MEG spectra (peak values 15% between 1.54 keV and 1.74 keV) than for the HEG spectra (peak values 10% between 1.4 keV and 1.8 keV). The pile-up fraction is negligible in the K iron range.
Absorption line detections in the non-dip data
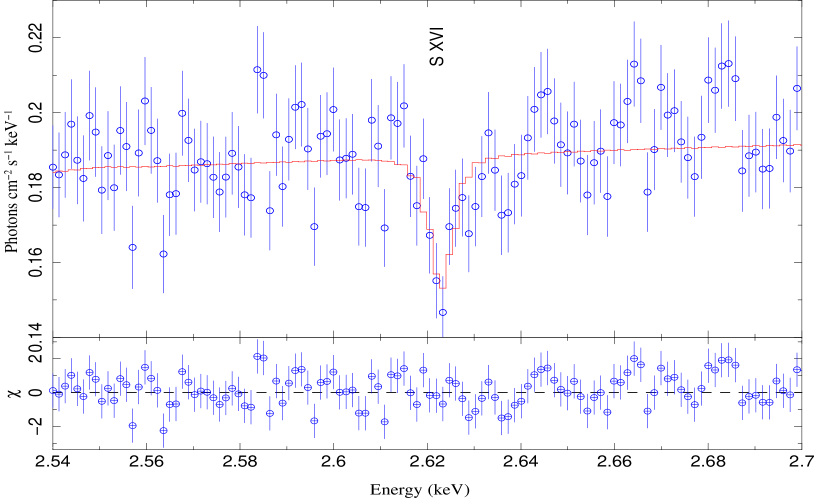
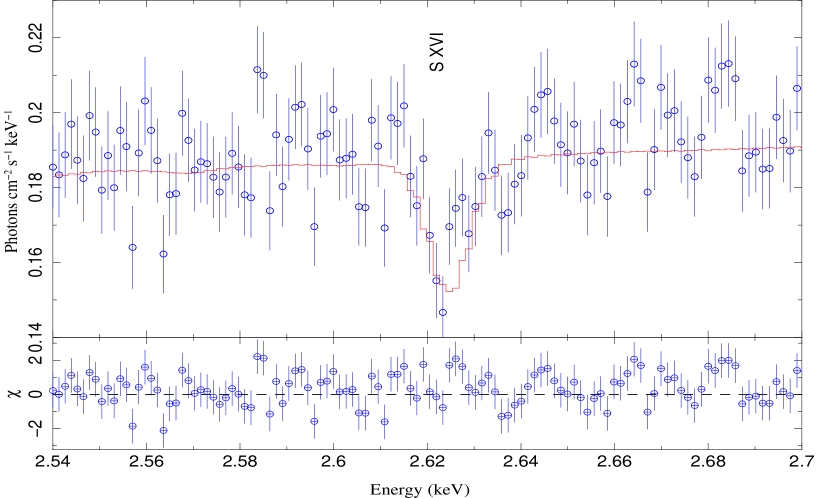
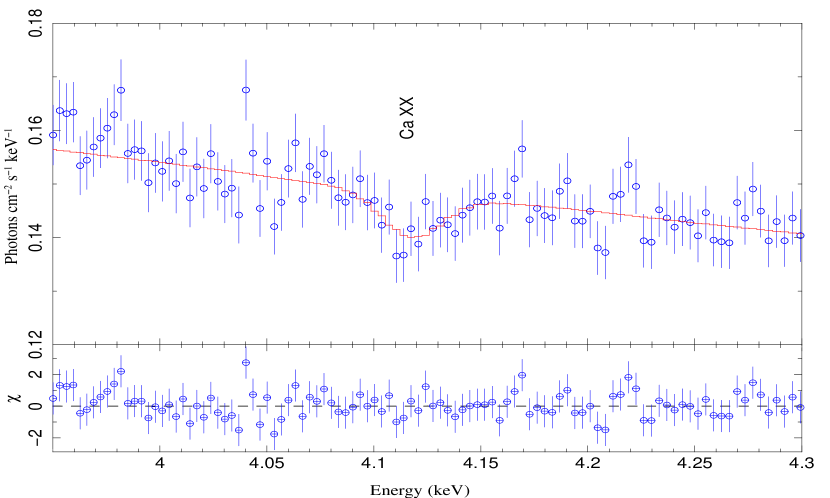
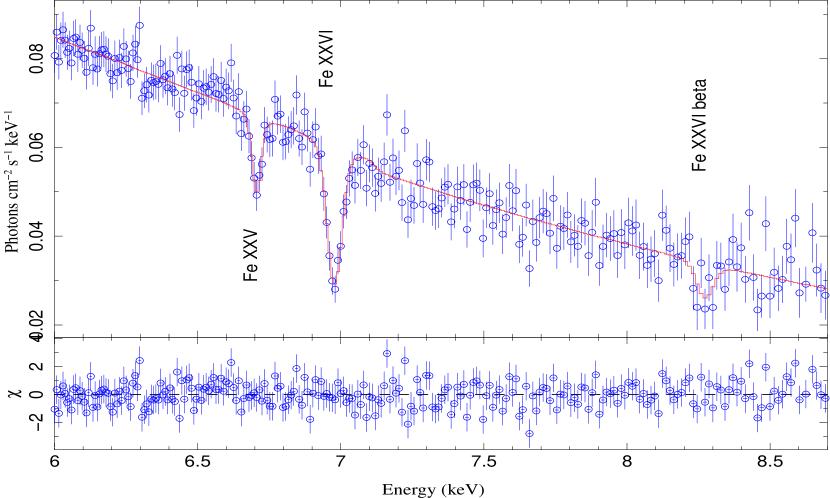
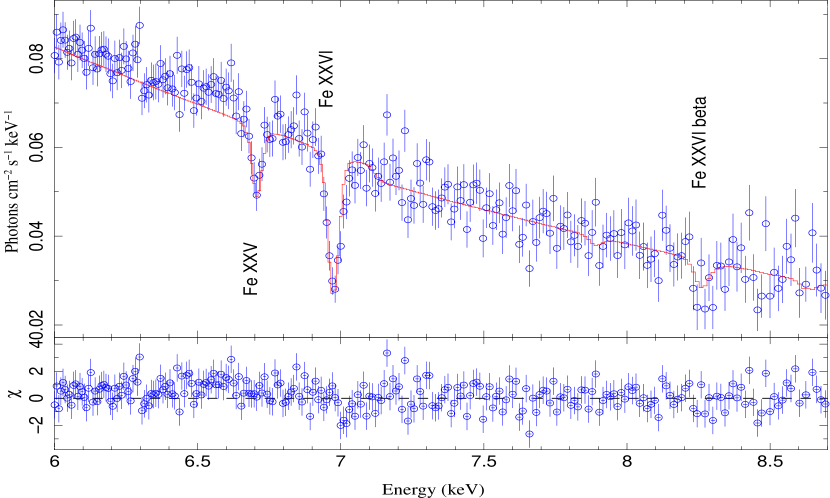
The X-ray spectrum is rich in local absorption features, similarly to the Chandra observation analyzed in Ueda et al. (2004). In this section, we focus on the detection and identification of these local features, while the details on the continuum model are addressed in the next section. To increase the signal-to-noise ratio and assess the detection level of these features we considered the time-averaged spectrum, filtering out only the interval with the dip. We considered HEG1 and MEG1 data as independent datasets, adopting a continuum model consisting of soft disk emission and thermal Comptonized component (the choice of the exact continuum has marginal influence on the parameter values) and locally searched for narrow absorption features around the expected values for the resonant transitions H-like and He-like of the most abundant elements, fitting the line profiles with Gaussians. In Table 5 we report the detected lines (normalization values not compatible with 0 at 2.7 ) associated to the element transitions, the measured shift with respect to the laboratory rest-frame and the widths. Two lines close to the Si K edge are possibly not related to the warm medium but to X-ray absorption fine structures (XAFS) close to the Si-edge structure (Ueda et al., 2005). Best-fitting values for the pile-up correction factors applied for each grating arm are reported in Table 5.
| Ion | Transitiona𝑎aa𝑎aRest-frame energies from Verner et al. (1996). | Elab | Eobs | Shift | Width | Fluxb𝑏bb𝑏bTotal area of the Gaussian (absolute value), in units of photons/cm-2/s. | EQWc𝑐cc𝑐cLine equivalent width. |
|---|---|---|---|---|---|---|---|
| eV | eV | km/s | eV | (10-4) | eV | ||
| Mg xii | 1472.3 | 1474.0 | 350 | 1.51.5 | 6.53 | 0.80.3 | |
| Al xiii | 1728.6 | 1727.22.6 | -240450 | 1.6 | 52.5 | 0.60.3 | |
| Mg xii | 1744.7 | 1745.41.2 | 140200 | 1.0 | 6.02.0 | 0.90.3 | |
| XAFS | 1847.70.7 | 2.20.8 | 11.62.4 | 2.00.4 | |||
| XAFS | 1863.71.0 | 2.41.4 | 92 | 1.80.3 | |||
| Si xiv | 2005.5 | 2007.40.4 | 28060 | 2.60.6 | 14.4 | 2.70.5 | |
| S xvi | 2621.7 | 2623.4 | 200 | 0+4 | 6.01.4 | 1.20.4 | |
| Ca xx | 4105.0 | 41188 | 950600 | 1310 | 6.02.5 | 2.41.1 | |
| Fe xxv | 6700.4 | 67065 | 250220 | 88 | 9.62 | 123 | |
| Fe xxvi | 6966.2 | 69783 | 500130 | 20.45 | 25.23 | 365 | |
| Fe xxvi | 8250.2 | 827320 | 840730 | 2525 | 105 | 2212 |
Inspecting the results from Gaussian fitting of the absorption lines, we noted that the lines are mostly produced by resonant transitions of H-like ions with a common blue-shift (weighted average 490 km s-1). Under the assumption that all these features could then be described by only one photoionized medium, we adopted a tabular spectral model derived from the XSTAR code, warmabs666http://heasarc.gsfc.nasa.gov/xstar/docs/html/node99.html to self-consistently fit all these features. We set as free fitting parameters the log of the ionization factor , the relative hydrogen column density (in units of log(N)), the blue-shift of all the lines (using the red-shift parameters and allowing for negative values) and the turbulent broadening (in km s-1). We adopted as electron density a value of 1012 cm-3, although we note that this choice has only a marginal impact on the best-fitting values of all the other parameters. We used the default value of the table model for the irradiating flux, a power-law with spectral index 2. This is a good approximation of the 1–10 keV spectrum of the source, since fitting with a simple absorbed power-law would result in a photon-index of 2.07. The best-fitting values for the warmabs component and the continuum model adopted are discussed and reported in the following section (last column of Table 6), while the best-fitting values of the pile-up parameters for the different grating arms are reported in Table 5.
| Gaussian Fit | Warmabs Fit | |
|---|---|---|
| Grating arm | (10-2 s Å/cts) | |
| HEG+1 | 2.70.3 | 3.00.3 |
| HEG-1 | 2.90.3 | 3.10.3 |
| MEG+1 | 3.20.3 | 3.40.3 |
| MEG-1 | 3.20.3 | 3.40.3 |
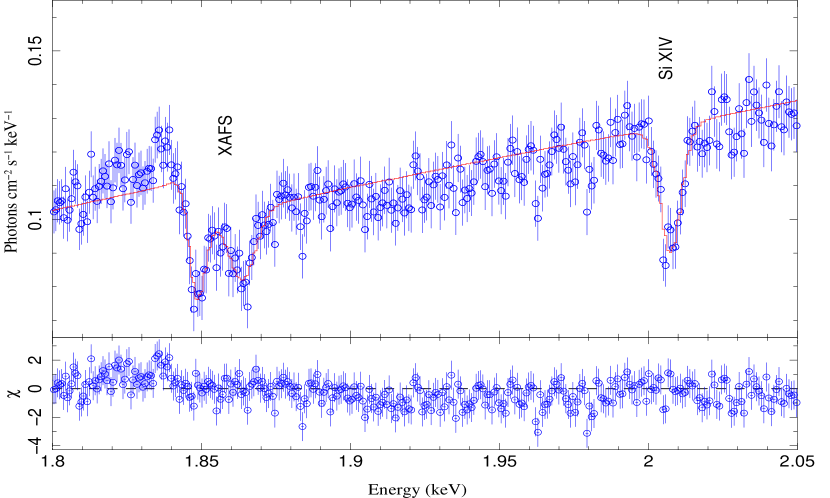
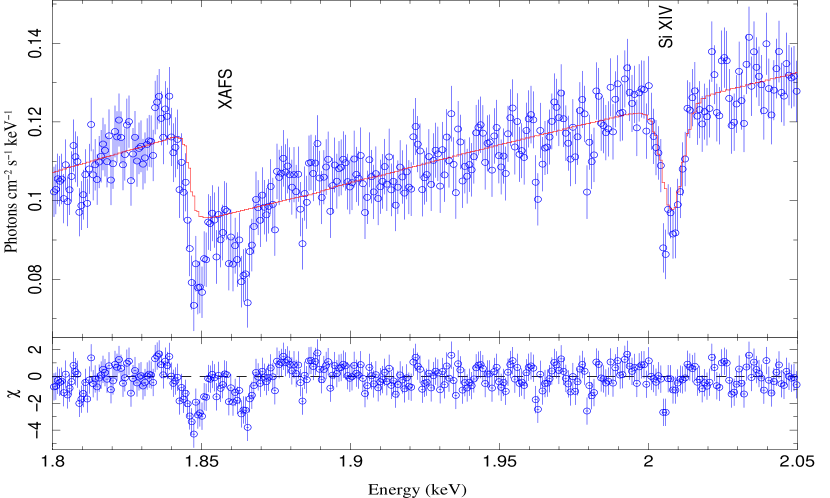
In Fig. 5, we compare model and residuals for the two approaches (local Gaussians and warmabs model) for the most interesting energy ranges. The strongest detected features are satisfactorily fitted with the warmabs component, with the exception of the local features around the K Si-edge (see upper right panel of Fig.5). For the ionization parameter derived from the best-fitting model, the possible contribution of the Ly transition of He-like Si at 1.865 keV is negligible, and therefore we conclude that the most likely origin of these features is the presence of XAFS. The overall reduced () of the model adopting local Gaussians is 1.074 (7793 degrees of freedom, [d.o.f.]), while the model with the warmabs gave 1.102 (7818 d.o.f.). Adding two Gaussians with energies and widths corresponding to the XAFS values of Table 5 gave a satisfactory account of the residuals and a of 1.080, for 7812 d.o.f. Although the statistical difference in the two fits is significant, the matching between the position, widths, and broadening of the highly ionized absorption lines in the two approaches is remarkable, and we conclude that the key physical characteristics of the absorption features are satisfactorily accounted for by a uniformly photoionized wind.
 |
 |
 |
 |
 |
 |
 |
 |
3.2 Broad-band continuum model
To fit the broad-band continuum, we modeled the interstellar absorption with the tbvarabs spectral component, with the abundance table of Asplund et al. (2009) and the cross section of Verner et al. (1996). We forced the Mg, S and Fe abundance to assume the same value as that of the Si abundance and left this parameter free to vary with respect to all the other elements (which effectively implies a different abundance ratio of the high-Z elements with respect to the low-Z ones), according to the possible overabundance in heavy-Z metals reported in the study of Ueda et al. (2005). In addition to the resonant absorption lines, the warm absorber is also responsible for the continuum optically thin Compton scattering. To account for this effect, we multiplied the model by an optically thin Compton scattering component (cabs in Xspec), tying the cabs electron density to 1.3 times the value of the warmbs column density, because we assumed a metallicity (=0.3) for the warm absorbing medium. We used a multiplication constant between the and RXTE/PCA models to take into account possible calibration differences in the observed flux.
To determine the continuum emission we used the /HEG and RXTE/PCA spectra; we tried two different spectral broad-band models, but we limited our comparison to the pre-dip spectrum. The first model follows the so-called extended coronal model, which has been extensively adopted for dipping sources and more recently also for bright Z-sources (Bałucińska-Church et al., 2011; Church et al., 2012). This model777constant*simple_gpile2*tbvarabs*cabs*warmabs*(cutoffpl+blackbody+gaussian) in Xspec language is composed of a cut-off power-law to take into account emission from the harder coronal environment, a thermal black-body component to take into account direct emission from the NS, and a broad iron emission line, with an upper limit to the width at 0.5 keV, to prevent unphysical continuum distortions, and a line energy constrained to take values between 6.4 keV and 7 keV.
This model gave a rather flat value for the photon-index of the cut-off power-law, however, with a best-fitting value of 1.10.3 and a cut-off energy of 4.40.4 keV, while the radius from the thermal black-body component is 4 km, and might be compatible with a narrow equatorial strip of the NS surface at a temperature of 1.000.05 keV. The reduced for this fit was 1.06 (2416 d.o.f) and no other significant residual pattern was evident. If the index of the power-law is associated to a Comptonized spectrum, the low index value becomes difficult to interpret, because the cut-off energy is 4.4 keV. For a spectral index 0, there is no physical solution that can be converted in terms of physical parameters (Pozdnyakov et al., 1983).
We then adopted a model according to the so-called Eastern decomposition, composed of a multitemperature accretion-disk model with a zero-torque boundary condition (ezdiskbb in Xspec, Zimmerman et al., 2005, where we assumed a distance of 7 kpc, a color-effective temperature ratio of 1.7 and an inclination angle of 65 deg to calculate the disk inner radius) to model the softer energies and a Comptonization model to fit the high-energy band (comptt in Xspec, Titarchuk, 1994). In the Comptonization component we assume spherical geometry. The spectral parameters that determine the shape of the Comptonized spectrum are the soft seed-photon temperature (), the temperature of the electron cloud (), and the optical depth (). For this model 888constant*simple_gpile2*tbvarabs*cabs*warmabs*(ezdiskbb+comptt+gaussian) in Xspec, we found a strong correlation between the disk temperature, and the soft seed-photon temperature. This is expected since for X-ray sources at high inclination angle the observed disk emission, which scales as the cosine of the angle, becomes weaker with respect to the more isotropic boundary layer emission.
However, for similar accretion rates, in low-inclination and less absorbed LMXB, where disk emission is clearly separated, the two temperatures are usually found to have very similar values, with the disk temperature typically 20%-30% lower than kTs (Di Salvo et al., 2002), because the Comptonization is thought to act mainly on the hotter photons produced at the surface of the NS. Because of the overlapping range of values for the two parameters, we decided to force them to assume the same value to make the fit more stable. For this model we derived an inner radius for the accretion disk compatible with a truncation radius at the boundary layer ( 15 km), which for high-accretion rates can extend to a distance similar to the radius of the NS (D’Aì et al., 2010). The highest disk temperature (set equal to the photon-seed temperature) value is 1 keV, while the high optical depth ( 8.5) and low electron temperature ( 3 keV) are consistent with the general softness of the spectrum. A moderately broad iron line in emission is required. The line equivalent width is 50 eV, significantly lower than the values reported in XMM-Newton observations (Díaz Trigo et al., 2012). We note, however, that the line detection is mostly driven by residuals of the RXTE/PCA, while using /HEG data alone the detection would be less constraining. We show the broad-band /PCA unfolded spectra together with the contributions from the additive components and residuals in Fig. 6.
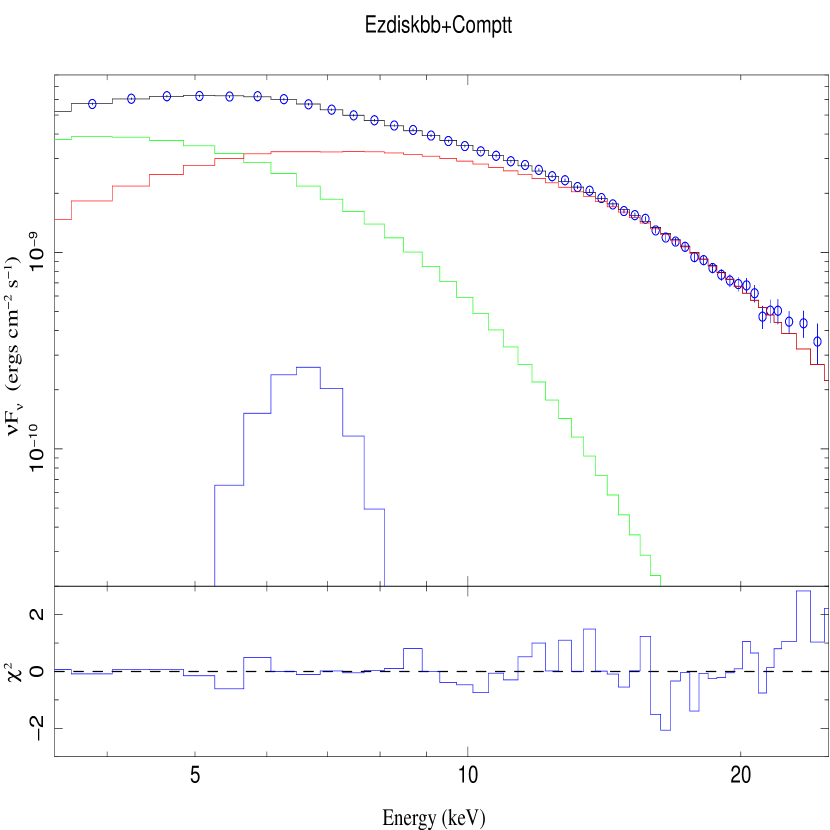
Because the best-fitting parameters of the model and the general spectral decomposition agree with the results of other LMXBs that accrete at similar rates, we hold this continuum model to be adequately solid and adopted it for the other time-selected intervals and to obtain the best-fitting averaged continuum emission of the whole out-of-dip observation. In Table 6, we report the best-fitting values and associated errors for the two time-selected pre-dip and post-dip spectra and for the average observation. The most significant changes from pre-dip to post-dip parameters are on the fluxes of the two components (a change of 20%, while the statistical error on a single measure is 3%), and a change in the optical depth of the Comptonized component, while the other spectral parameters are found consistent within the statistical uncertainties. The average out-of-dip observation presents a higher value for the N parameter than that of the RXTE+HEG fit, but the error on the parameter is underestimated because we kept the Mg/Si/S/Fe abundance frozen to the reference value of 1.3, as the two parameters were found to be strongly correlated.
| PCA+HEG | (HEG+MEG) | ||
| Parameters | Pre-dip | Post-dip | Average out-of-dip |
| N (1022 cm-2) | 3.70.2 | 3.80.2 | 4.100.06 |
| Mg/SI/S/Fe abundance | 1.30.2 | 1.40.3 | 1.3††footnotemark: † |
| Disk kT (keV) /Comptt kTs (keV) | 0.970.02 | 0.980.04 | 1.040.05 |
| Disk inner radiusa𝑎aa𝑎aAssuming a distance of 7 kpc, a hardening factor of 1.7, and an inclination angle of 65°. (km) | 15.22.7 | 193 | 18.82.8 |
| Disk fluxb𝑏bb𝑏bUnabsorbed extrapolated flux in the 0.1–100 keV energy range. (10-9 erg cm-2 s-1) | 2.8 | 4.0 | 5.5 |
| Comptt kTe (keV) | 3.070.09 | 3.100.07 | 3.60.4 |
| Comptt | 8.50.3 | 9.60.3 | 8.5††footnotemark: † |
| Comptt fluxb𝑏bb𝑏bUnabsorbed extrapolated flux in the 0.1–100 keV energy range. (10-9 erg cm-2 s-1) | 13.4 | 9.2 | 10.5 |
| Ebroad (keV) | 6.60.1 | 6.5 | 6.4+0.15 |
| Width (keV) | 0.20.15 | 0.5-0.2 | 0.5-0.1 |
| EQW (eV) | 50 | 9050 | 4520 |
| CABSd𝑑dd𝑑dfootnotemark: (1022 cm-2) | 475 | 368 | 363 |
| Warmabs N (1022 cm-2) | 364 | 286 | 282 |
| Warmabs log() | 3.600.1 | 3.660.10 | 3.650.05 |
| Warmabs broadening (km s-1) | 38080 | 450 | 450 |
| Warmabs blueshift (km s-1) | 42090 | 500130 | 42060 |
| Constant (PCA/HEG) | 1.080.01 | 1.080.01 | |
| (d.o.f.) | 1.06 (2416) | 1.08 (1998) | 1.08 (7812) |
$${\dagger}$$$${\dagger}$$footnotetext: Frozen parameter $c$$c$footnotetext: This parameter is tied to be 1.3 the warmabs N component.
Spectral changes during dipping
To study the spectral changes during the dip, we used only Chandra HEG and MEG data, as there was no strictly contemporaneous RXTE observation of source during the dip. Because of the short duration of the dip and the low effective area of the /HETGS, no clear absorption feature was detected, so that to better constrain spectral variations we coarsely re-binned each grating arm data up to 100 counts per channel. We assumed that during the dip the continuum spectral shape is consistent with the out-of-dip average spectrum, because the dip falls approximately at the center of the observation. We therefore kept all the spectral parameters frozen to the best-fitting average values of the spectrum analyzed in Sect. Absorption line detections in the non-dip data with the warmabs component (i.e. average column of Table 6).
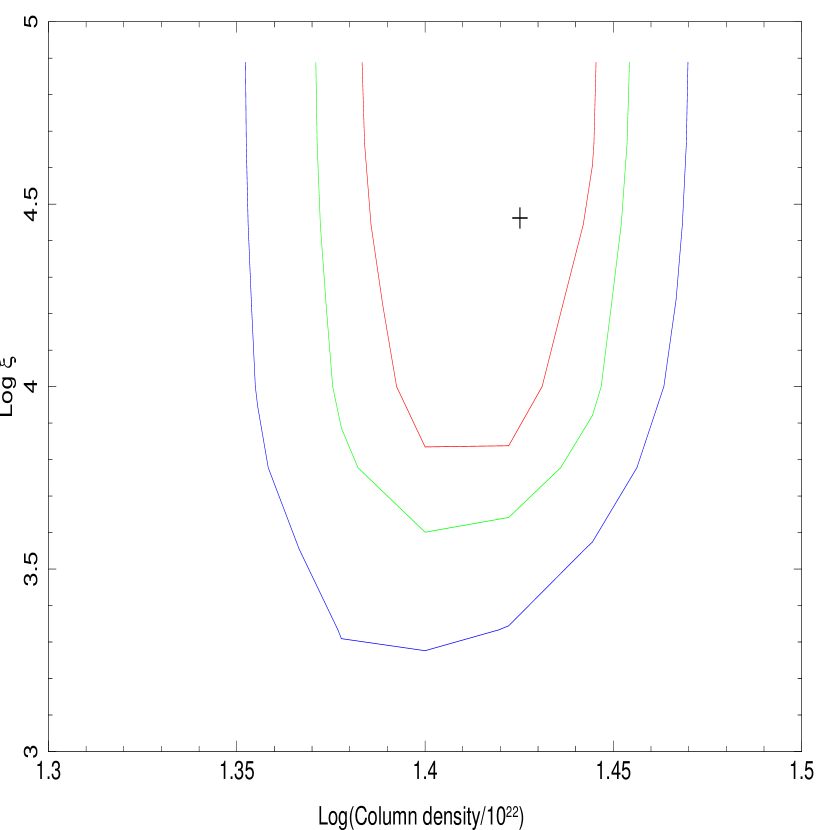
We first tried to model the time-selected dip spectra allowing only for a variation of the neutral absorption column, keeping the parameters of the warmabs component frozen to the average values. A multiplicative constant before the model was used to evaluate possible flux variations between this time-selected spectrum and the averaged one. The residual pattern can be satisfactorily flattened, and we noted no other significant residual. Intrinsic flux variations with respect to the averaged spectrum are only of a few percent, as the multiplicative constant is very close to unity in all examined spectra (see Table 7). We also tested the possible presence of a neutral partial covering effect. The covering fraction was always compatible with total coverage, and only lower limits could be assessed, without significant improvements in the of the fits. The ingress and egress spectra also show that the variation on the cold column density is possibly smooth, with values slightly higher than the corresponding values reported in Table 6 for the pre-dip and post-dip persistent spectra. This is consistent with the hypothesis that the smooth dip profile is caused at first by an increase and then a decrease of this parameter alone. In a second round of fits, we tested whether the spectral change is compatible with a variation of the column density and the ionization state of the warmabs component alone (keeping the neutral N fixed to the average value). If the multiplicative constant is kept fixed to unity, no acceptable fit is obtained ( 2), whereas when we allowed a variable constant, we noted a statistically acceptable fit ( 1.08) for the dip spectrum with a strong decrease in both the column densities (NH,wa 8 1022 cm-2) and in the ionization state (log() -0.3), in contrast with a general increase in warm column densities during dips in all other dipping sources (Díaz Trigo et al., 2006). However, the model constant correspondingly decreases by 20% in correlation with the decrease of the cabs value, which is tied to the warmabs column density, so that we conclude that this fit artificially reproduces the former model, without being physically consistent. Finally, we evaluated whether a change in the ionization parameter and in the absorption column of the warm absorber could be assessed at the same time, but we found marginal or no fit improvements compared with the best-fitting model shown in Table 7. For the dip spectrum, we found that the column density of the warm absorber is the same as in the averaged spectrum, while for the ionization parameter we found a lower limit compatible with the out-of-dip value (log() = 3.6), as shown by the contour plots of the two warmabs components in the right panel of Fig. 7. Similar results were also obtained for the ingress and egress spectra.
| Parameter (units) | Ingress | Dip | Egress |
|---|---|---|---|
| (1022 cm-2) | 5.8 | 8.620.16 | 4.720.10 |
| 0.990.2 | 0.990.02 | 1.040.03 | |
| (d.o.f.) | 1.06 (123) | 1.02 (178) | 1.12 (142) |
In summary, our results indicate that the main driver of the dip event is a rise in the column density of a neutral (or very mildly ionized) component, without requiring any change of the warmabs properties with respect to the out-of-dip interval. Keeping the neutral column density fixed at the out-of-dip averaged value, no physical or statistically acceptable solution is found in terms of variation of the warm absorber properties.
 |
 |
4 Discussion
4.1 Continuum formation and warm absorption
We investigated the 1.0–25.0 keV spectrum of GX 13+1 by exploiting the high-resolution Chandra/HETGS spectrum, which has allowed tight control of the physical characteristics of the warm absorber, and RXTE/PCA spectrum, that has allowed to constrain the broad-band continuum. Comparing different spectral models, we found that the parameters of the warm absorber, as expected, are not strongly influenced by the choice of the underlying continuum. The continuum spectrum is extremely soft, closely resembling typical Z-sources spectra. The most physically plausible model is consistent with a hot accretion disk, whose apparent inner radius is compatible with the extension of the boundary layer for such high accretion rates (Popham & Sunyaev, 2001), and an optically thick thermal Comptonization component. The total luminosity of the source is close to 50% of the Eddington limit for a canonical 1.4 M⊙ NS, and it is similar to past observations, pointing to a certain long-term accretion stability. The short-term smooth spectral variability that we observed in the 30 ks Chandra observation mostly reflects a change in the flux of the components, while the general spectral shape remains unvaried.
Moreover, energetically the overall emission is probably strongly dominated by coronal power, and it is unclear how the accretion power can be efficiently transferred at very large radii, while the possible power extractable from the accretion disk may be only a small fraction of the energy carried by the disk (see discussion in Uzdensky, 2013).
The continuum is absorbed by a warm optically thick plasma. Its characteristics are similar to what was shown in past Chandra observations, and we found no strong variability in the present observation, because the best-fitting parameters between the pre-dip and post-dip spectra are all consistent within the associated uncertainties. Inspecting the landscape of the absorption features more closely, we found no evidence of the H-like transition of Mn, Cr, and Ar reported in Ueda et al. (2004), but we significantly detected the Ly transition of Al xiii and Ly transitions from Mg xii and Fe xxvi, together with two absorption lines close to the Si K- edge related to interstellar absorption (Ueda et al., 2005).
The self-consistent model warmabs yielded a satisfactory representation of all the local features. The average escape velocity of the photoionized medium is 42060 km s-1; a similar value was found in the observation of Ueda et al. (2004), while the lines appear broadened by the same order. This is expected if the wind is thermally driven and pushed by pressure gradients. In this case, the thermal motion of the ions would be similar to the sound speed , that would be similar to the escape velocity. Roughly speaking, the radius at which the wind is launched should be larger than the radius for which the escape velocity is the value we measured, so that Rwind 21011 cm. A similar value is obtained by a first-order calculation, taking the ionization parameter derived by the fit ( 4000), a density of 1012 cm-3, and observed luminosity (Lx 1038 erg s-1 for a distance of 7 kpc), holding a distance 1.4 1011 cm.
4.2 Nature of the dip in the light curve
A comprehensive study on the dipping activity of the source during a time span of more than 14 years was presented in Iaria et al. (2014), where evidence was given for a long-term modulation of dip passages at an inferred period of 24.5274(2) d. The phase of the dip corresponds to the zero-phase of the periodic modulation, and therefore this is the first spectroscopic study of the periodic dip in GX 13+1.
The lack of past dip evidence in GX 13+1 may be attributed to the very long orbital period of the source, which exceeds the rest of the dipping class by almost two orders of magnitude, and the possible low duty-cycle of the dips. In most dipping sources the dip duty-cycle may be as large as half of the entire orbital cycle (as in XB 1323-619 Bałucińska-Church et al., 1999), while, for longer-period dippers (Porb 1 day) the duty cycle drops to a few percentage as in the case of GRO J1655-40, and 4U 1639-47, or Cir X-1, which implyies that structure that causes the dip does not simply scale with the system dimensions. If the structure is identified with a bulge, formed at the impact point between the accretion stream and the outer disk radius, then its physical dimensions are probably determined by local conditions. In this case, the duty cycle would inversely scale with the accretion-disk radius.
Indeed, searching all the RXTE PCA pointed observations, (Iaria et al., 2014) found no clear dip episode, the dip spotted in the Chandra observation has a duration (FWHM) of only 450 s, with very regular and smooth ingress and egress times. At the dip bottom the observed 1–10 keV flux is 2/3 of the pre-dip flux, and the covering fraction is compatible with being total. No substructures are present within the dip, which points to a homogeneous absorber.
If we consider the orbital period of GX 13+1 ( 24.5 d) and the possible mass range for the companion star (between 1 and 5 M☉), we can estimate the Roche lobe radius of the primary according to the Eggleton formula (Eggleton, 1983):
| (2) |
where is the mass ratio, is orbital semi-major axis, and the mass of the NS is assumed to be 1.4 Msun. We obtained Roche-lobe radii in the (1.2–3.3)1012 cm range. If the truncation radius () for the accretion disk is taken to be 80% of the Roche-lobe radius, we estimate = (0.96–2.64)1012 cm. From the same calculations, we derived that the angle subtended by the companion star’s radius is 20°, assuming it completely fills its Roche lobe. Because eclipses are absent, the inclination angle of the system must be 70°.
If matter causing the dip is assumed for simplicity to have a spherical shape of diameter and fixed in position, we can estimate its diameter from the duration of the dip (we conservatively assumed as dip duration the entire dip episode, shoulders and deep dip, of 1400 s) and the orbital period
| (3) |
which gives = (6.3–17.4) 108 cm.
If the accretion disk height-to-radius ratio were close to 0.1, as in the standard -disk case, we immediately note that the disk height is about three orders of magnitude greater than the blob radius (as calculated from a variety of different possible prescriptions), and this low ratio makes it unlikely that the blob is associated to a thickening of the disk or some unstable local structure because in this case we would expect strong variability and multiple dip substructures which are not observed. Alternatively, we might assume that only a tiny fraction of the top of the bulge causes the shallow dip, and thus the peculiarity of this source might be that it is an almost limiting case among the high-inclination systems, which is also supported by the general low upper value on the inclination from the eclipse absence.
We have shown that during the dip the observed hardening is mostly due to a rising of a neutral or very mildly ionized absorption column. A change of only the warm absorber characteristics, with an increase in the column density and a decrease of the ionization state, does not lead to acceptable fit results. If we consider that the column density due to the ISM, as derived from the out-of-dip spectrum, is 4.21022 cm-2, at the dip bottom we find an intervening local column density of 4.51022 atoms cm-2. If the occulting region is placed at the minimum outer disk radius (1012 cm) and the density is on the order of 3.7 1013 cm-3, calculated using the blob diameter, we derive a maximum ionization parameter = 3. Thus we conclude that the general picture of an occulting, almost neutral blob, set at a distance equal to the outer disk radius is self-consistent with a plasma in a low ionization state.
GX 13+1 in context
The nature of the dipping phenomenon is still not firmly established, neither is the physical connection with the geometry of the system. GX 13+1 is the most luminous accreting dipping system, and its broad-band spectrum closely resembles the typical softness of the so-called Z-sources and bright atoll group (D’Aì et al., 2009; Di Salvo et al., 2009), with a hot ( 1 keV) disk spectrum and an optically thick Comptonized component with a low ( 3 keV) electron temperature.
In addition to the high luminosity, GX 13+1 also has the longest orbital period and hence the largest outer-disk radius. We have shown that if the dipping is caused by a stable structure at the disk’s outer rim, even this intense flux is not able to strongly ionize it. X 1624-490 is the second dipping source for brightness and longest orbital period ( 0.25 LEdd, Porb 21 hr), which also shows a contribution from neutral absorption during dipping (Díaz Trigo et al., 2006). In this source an equal and large (a factor of 6) increase both in the column density of the ionized and neutral matter has been observed. The short duration of the dip and the small effective area compared with does not allow us to constrain the variability of the warm absorber properties well, which seems to be modest compared with the significant change of the column density of the cold absorber, however. For GX 13+1 the ubiquitous presence of the warm absorber and the possible formation region at a distance of 1011 cm suggest that cold absorption (possibly located at a distance 1012 cm) and warm absorption (disk-wind) are not physically connected. New observations with higher statistics will eventually provide more constraints on this matter.
5 Conclusions
We have reported the first spectroscopic time-resolved investigation of the periodic dip of GX 13+1. The broad-band spectrum derived by a combined fit of Chandra/HEG and RXTE/PCA allowed us to consistently determine the continuum and discrete emission features of the source. Chandra data confirm an out-flowing optically thick warm absorber. Because of the short duration of the dip, we were unable to firmly constrain possible changes in the properties of the absorbing wind. The observed spectral hardening during the dip is mostly due to an increase in the column density of a neutral absorber, while the warm-absorber component is not modified with respect to the out-of-dip spectrum. Simple estimates on the dimensions of the structure that cause the dip indicate a very small occulting region when compared with the expected scale-heights at the outer radius, while simple geometric considerations on the system point to a possible inclination of 70°.
Acknowledgements.
The authors thank the anonymous referee for the helpful comments and suggestions. A. D. thanks M. Hanke for useful discussions about the model and the use of ISIS.Authors acknowledge support from INAF/PRIN 2012-06.
A. D. , T. D. , R. I. N. R. acknowledge support from Fondo Finalizzato alla Ricerca 2012/13 from the University of Palermo. A. R. gratefully acknowledges the Sardinia Regional Government for the financial support (P. O. R. Sardegna F.S.E. Operational Programme of the Autonomous Region of Sardinia, European Social Fund 2007-2013 - Axis IV Human Resources, Objective l.3, Line of Activity l.3.1). Work in Cagliari was partially funded by the Regione Autonoma della Sardegna through POR-FSE Sardegna 2007-2013, L.R. 7/2007, Progetti di ricerca di base e orientata, Project N CRP-60529.
This research has made use of a collection of ISIS scripts provided by the Dr. Karl Remeis observatory, Bamberg, Germany at http://www.sternwarte.uni-erlangen.de/isis/.
References
- Asplund et al. (2009) Asplund, M., Grevesse, N., Sauval, A. J., & Scott, P. 2009, ARA&A, 47, 481
- Bałucińska-Church et al. (1999) Bałucińska-Church, M., Church, M. J., Oosterbroek, T., et al. 1999, A&A, 349, 495
- Bałucińska-Church et al. (2004) Bałucińska-Church, M., Church, M. J., & Smale, A. P. 2004, MNRAS, 347, 334
- Bałucińska-Church et al. (2011) Bałucińska-Church, M., Schulz, N. S., Wilms, J., et al. 2011, A&A, 530, A102
- Bandyopadhyay et al. (1999) Bandyopadhyay, R. M., Shahbaz, T., Charles, P. A., & Naylor, T. 1999, MNRAS, 306, 417
- Bhattacharyya et al. (2006) Bhattacharyya, S., Strohmayer, T. E., Markwardt, C. B., & Swank, J. H. 2006, ApJ, 639, L31
- Boirin et al. (2005) Boirin, L., Méndez, M., Díaz Trigo, M., Parmar, A. N., & Kaastra, J. S. 2005, A&A, 436, 195
- Boirin et al. (2004) Boirin, L., Parmar, A. N., Barret, D., Paltani, S., & Grindlay, J. E. 2004, A&A, 418, 1061
- Church & Bałucińska-Church (2004) Church, M. J. & Bałucińska-Church, M. 2004, MNRAS, 348, 955
- Church et al. (2012) Church, M. J., Gibiec, A., Bałucińska-Church, M., & Jackson, N. K. 2012, A&A, 546, A35
- Corbet et al. (2010) Corbet, R. H. D., Pearlman, A. B., Buxton, M., & Levine, A. M. 2010, ApJ, 719, 979
- D’Aì et al. (2010) D’Aì, A., di Salvo, T., Ballantyne, D., et al. 2010, A&A, 516, A36
- D’Aí et al. (2007) D’Aí, A., Iaria, R., Di Salvo, T., Lavagetto, G., & Robba, N. R. 2007, ApJ, 671, 2006
- D’Aì et al. (2009) D’Aì, A., Iaria, R., Di Salvo, T., Matt, G., & Robba, N. R. 2009, ApJ, 693, L1
- Di Salvo et al. (2009) Di Salvo, T., D’Aí, A., Iaria, R., et al. 2009, MNRAS, 398, 2022
- Di Salvo et al. (2002) Di Salvo, T., Farinelli, R., Burderi, L., et al. 2002, A&A, 386, 535
- Díaz Trigo et al. (2006) Díaz Trigo, M., Parmar, A. N., Boirin, L., Méndez, M., & Kaastra, J. S. 2006, A&A, 445, 179
- Díaz Trigo et al. (2009) Díaz Trigo, M., Parmar, A. N., Boirin, L., et al. 2009, A&A, 493, 145
- Díaz Trigo et al. (2012) Díaz Trigo, M., Sidoli, L., Boirin, L., & Parmar, A. N. 2012, A&A, 543, A50
- Eggleton (1983) Eggleton, P. P. 1983, ApJ, 268, 368
- Frank et al. (1987) Frank, J., King, A. R., & Lasota, J.-P. 1987, A&A, 178, 137
- Gavriil et al. (2012) Gavriil, F. P., Strohmayer, T. E., & Bhattacharyya, S. 2012, ApJ, 753, 2
- Grisé et al. (2013) Grisé, F., Kaaret, P., Corbel, S., Cseh, D., & Feng, H. 2013, MNRAS, 433, 1023
- Hanke et al. (2009) Hanke, M., Wilms, J., Nowak, M. A., et al. 2009, ApJ, 690, 330
- Homan et al. (2005) Homan, J., Miller, J. M., Wijnands, R., et al. 2005, ApJ, 623, 383
- Homan et al. (2004) Homan, J., Wijnands, R., Rupen, M. P., et al. 2004, A&A, 418, 255
- Houck (2002) Houck, J. C. 2002, in High Resolution X-ray Spectroscopy with XMM-Newton and Chandra, ed. G. Branduardi-Raymont
- Hyodo et al. (2009) Hyodo, Y., Ueda, Y., Yuasa, T., et al. 2009, PASJ, 61, 99
- Iaria et al. (2014) Iaria, R., Di Salvo, T., Burderi, L., et al. 2014, A&A, 561, A99
- Iaria et al. (2013) Iaria, R., Di Salvo, T., D’Aì, A., et al. 2013, A&A, 549, A33
- Iaria et al. (2007) Iaria, R., Lavagetto, G., D’Aí, A., di Salvo, T., & Robba, N. R. 2007, A&A, 463, 289
- in’t Zand et al. (2003) in’t Zand, J. J. M., Hulleman, F., Markwardt, C. B., et al. 2003, A&A, 406, 233
- Kallman et al. (2004) Kallman, T. R., Palmeri, P., Bautista, M. A., Mendoza, C., & Krolik, J. H. 2004, ApJS, 155, 675
- Krolik et al. (1981) Krolik, J. H., McKee, C. F., & Tarter, C. B. 1981, ApJ, 249, 422
- Kuulkers et al. (2013) Kuulkers, E., Kouveliotou, C., Belloni, T., et al. 2013, A&A, 552, A32
- Kuulkers et al. (1998) Kuulkers, E., Wijnands, R., Belloni, T., et al. 1998, ApJ, 494, 753
- Lee et al. (2002) Lee, J. C., Reynolds, C. S., Remillard, R., et al. 2002, ApJ, 567, 1102
- Lubow (1989) Lubow, S. H. 1989, ApJ, 340, 1064
- Mainardi et al. (2010) Mainardi, L. I., Paizis, A., Farinelli, R., et al. 2010, A&A, 512, A57
- Mason (1986) Mason, K. O. 1986, in Lecture Notes in Physics, Berlin Springer Verlag, Vol. 266, The Physics of Accretion onto Compact Objects, ed. K. O. Mason, M. G. Watson, & N. E. White, 29
- Matsuba et al. (1995) Matsuba, E., Dotani, T., Mitsuda, K., et al. 1995, PASJ, 47, 575
- Miller et al. (2006) Miller, J. M., Raymond, J., Homan, J., et al. 2006, ApJ, 646, 394
- Naik et al. (2001) Naik, S., Agrawal, P. C., Rao, A. R., et al. 2001, ApJ, 546, 1075
- Nowak et al. (2008) Nowak, M. A., Juett, A., Homan, J., et al. 2008, ApJ, 689, 1199
- Oosterbroek et al. (2001) Oosterbroek, T., Parmar, A. N., Sidoli, L., in’t Zand, J. J. M., & Heise, J. 2001, A&A, 376, 532
- Paizis et al. (2006) Paizis, A., Farinelli, R., Titarchuk, L., et al. 2006, A&A, 459, 187
- Parmar et al. (1989) Parmar, A. N., Gottwald, M., van der Klis, M., & van Paradijs, J. 1989, ApJ, 338, 1024
- Parmar et al. (1986) Parmar, A. N., White, N. E., Giommi, P., & Gottwald, M. 1986, ApJ, 308, 199
- Ponti et al. (2012) Ponti, G., Fender, R. P., Begelman, M. C., et al. 2012, MNRAS, 422, L11
- Popham & Sunyaev (2001) Popham, R. & Sunyaev, R. 2001, ApJ, 547, 355
- Pozdnyakov et al. (1983) Pozdnyakov, L. A., Sobol, I. M., & Syunyaev, R. A. 1983, Astrophysics and Space Physics Reviews, 2, 189
- Shidatsu et al. (2013) Shidatsu, M., Ueda, Y., Nakahira, S., et al. 2013, ArXiv e-prints
- Shirey et al. (1999) Shirey, R. E., Levine, A. M., & Bradt, H. V. 1999, ApJ, 524, 1048
- Sidoli et al. (2001) Sidoli, L., Oosterbroek, T., Parmar, A. N., Lumb, D., & Erd, C. 2001, A&A, 379, 540
- Sidoli et al. (2002) Sidoli, L., Parmar, A. N., Oosterbroek, T., & Lumb, D. 2002, A&A, 385, 940
- Smale et al. (2001) Smale, A. P., Church, M. J., & Bałucińska-Church, M. 2001, ApJ, 550, 962
- Smale et al. (2002) Smale, A. P., Church, M. J., & Bałucińska-Church, M. 2002, ApJ, 581, 1286
- Smale & Wachter (1999) Smale, A. P. & Wachter, S. 1999, ApJ, 527, 341
- Titarchuk (1994) Titarchuk, L. 1994, ApJ, 434, 570
- Ueda et al. (2001) Ueda, Y., Asai, K., Yamaoka, K., Dotani, T., & Inoue, H. 2001, ApJ, 556, L87
- Ueda et al. (1998) Ueda, Y., Inoue, H., Tanaka, Y., et al. 1998, ApJ, 492, 782
- Ueda et al. (2005) Ueda, Y., Mitsuda, K., Murakami, H., & Matsushita, K. 2005, ApJ, 620, 274
- Ueda et al. (2004) Ueda, Y., Murakami, H., Yamaoka, K., Dotani, T., & Ebisawa, K. 2004, ApJ, 609, 325
- Uzdensky (2013) Uzdensky, D. A. 2013, ApJ, 775, 103
- van Peet et al. (2009) van Peet, J. C. A., Costantini, E., Méndez, M., Paerels, F. B. S., & Cottam, J. 2009, A&A, 497, 805
- Verner et al. (1996) Verner, D. A., Ferland, G. J., Korista, K. T., & Yakovlev, D. G. 1996, ApJ, 465, 487
- White & Holt (1982) White, N. E. & Holt, S. S. 1982, ApJ, 257, 318
- Younes et al. (2009) Younes, G., Boirin, L., & Sabra, B. 2009, A&A, 502, 905
- Zimmerman et al. (2005) Zimmerman, E. R., Narayan, R., McClintock, J. E., & Miller, J. M. 2005, ApJ, 618, 832