Permanent Address: ]Department of Physics, 37th and O Streets NW, Georgetown University, Washington DC 20057, USA
Fast cholesterol flip-flop and lack of swelling in skin lipid multilayers
Abstract
Atomistic simulations were performed on hydrated model lipid multilayers that are representative of the lipid matrix in the outer skin (stratum corneum). We find that cholesterol transfers easily between adjacent leaflets belonging to the same bilayer via fast orientational diffusion (tumbling) in the inter-leaflet disordered region, while at the same time there is a large free energy cost against swelling. This fast flip-flop may play an important role in accommodating the variety of curvatures that would be required in the three dimensional arrangement of the lipid multilayers in skin, and for enabling mechanical or hydration induced strains without large curvature elastic costs.
pacs:
87.16.D-, 87.16.dj, 87.10.Tf, 87.14.CcIntroduction: The outer layer of skin Freinkel and Woodley (2001), called the stratum corneum (SC), comprises non-viable corneocyte cells within a matrix of lipid multilayers, and is the main barrier against water loss and uptake of foreign pathogens and chemicals Elias (2005). In a simplified brick and mortar picture Michaels et al. (1975) the corneocytes are the ‘bricks’ and the lipid multilayers constitute the ‘mortar’. Possibly because of the extensive work on phospholipid biomembranes, SC lipid multilayers have often been considered to behave similarly to phospholipids, with highly hydrophilic head groups that lead to a bulk-like water layer between adjacent bilayers Åberg et al. (2008); *moghimi.jpharm.96; *sparr.col.00. However, direct experimental support for hydrated multilayers has been scant Bouwstra et al. (1991); *mak.pharmres.91; *kiselev.EBJ.05.
To explain in vivo and in vitro structural data, a number of detailed scenarios have been proposed in which the lipids in multilayers are in crystalline or gel states, with negligible diffusion Swartzendruber et al. (1989); Forslind (1994); Bouwstra et al. (1998); McIntosh (2003); Hill and Wertz (2003); Schr oter et al. (2009); Iwai et al. (2012). Yet, SC lipid multilayers in vivo necessarily undergo large deformation during hydration/dehydration and mechanical deformation. For example, the corneocyte volume (diameter m and thickness nm) can change under hydration by up to a factor of three Bouwstra et al. (2003); Richter et al. (2001). Moreover, the concomitant changes in local curvature of an adjacent gel-like lipid multilayer would require large elastic (or plastic) stresses.
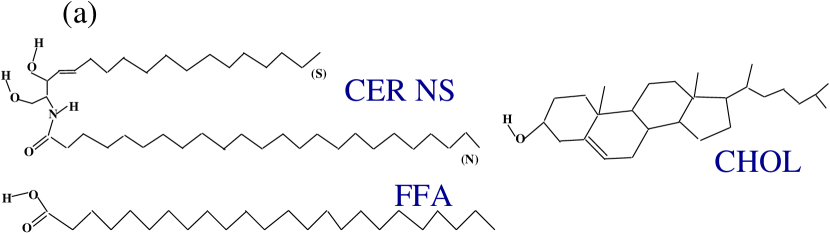
Fully hydrated bilayers have frequently been simulated to understand the lipid arrangements within and permeation through SC bilayers Höltje et al. (2001); Pandit and Scott (2006); Notman et al. (2007); Das et al. (2009, 2010), and multilayer stability has been simulated under limited hydration Das et al. (2013); Engelbrecht et al. (2011). An important result is that the different tail lengths intrinsic to SC lipids (Fig. 1a) lead to a unique sandwich structure with a disordered liquid-like region between leaflet tails (Fig. 1b) Das et al. (2009, 2010, 2013).
Here we consider two bilayers in excess water but without interbilayer water, comprising the ceramide N-lignoceroyl-D-erythro-sphingosine (CER NS 24:0), lignoceric acid (a common free fatty acid, FFA 24:0), and cholesterol (CHOL) (Fig. 1a). We calculate the free-energy of swelling and find a large (/water molecule) barrier for initial water ingress, suggesting that the analysis of SC lipid matrix function should invoke the properties of dehydrated SC lipid multilayers. From long () molecular dynamics simulations, we find that strong hydrogen bonds between the head-groups of apposing leaflets (from adjacent bilayers) force these two leaflets to move together as an inverse bilayer, with the hydrophobic tails in the disordered regions sliding against each other. CHOL in these disordered interleaflet regions is in dynamic equilibrium with CHOL in the ordered (gel) part of the leaflets, which facilitates transfer of CHOL between leaflets that is orders of magnitude faster than in fluid phospholipid bilayers. This fast flip-flop can reduce the curvature elastic cost in bending of the lipid multilayers by redistributing CHOL asymmetrically between the two leaflets, thus enhancing the pliability and energy absorbing effects of the SC and hence skin.
Simulations: We use the ‘Berger’ force field Ryckaert and Bellemans (1975); Jorgensen and Tirado-Rives (1988); Chiu et al. (1995); Berger et al. (1997) to describe the lipid interactions and the SPC model Berendsen et al. (1981) for the water molecules. The topology and the partial charges used for the lipid molecules have been reported elsewhere Sup ; Das et al. (2009). Molecular dynamics simulations at constant temperature (340 K) and pressure (1 atm) were carried out with GROMACS molecular dynamics software Berendsen et al. (1995); *gromacs05 using Nosé-Hoover thermostats separately coupled to the lipids and the water molecules, and with a Parrinello-Rahman barostat. Standard periodic boundary conditions were applied in all three directions. Bond lengths were constrained with the LINCS algorithm for the lipid molecules and the SETTLE algorithm for the water molecules. Long-range electrostatics contributions were calculated with Particle Mesh Ewald summation (PME) and a cut-off of 1.2 nm was used for both the Lennard-Jones and the short-range electrostatics interactions. The timestep was 2 fs.
As the starting configuration we use an equilibrated hydrated bilayer from an earlier study Das et al. (2009). The water molecules were removed and the lipid bilayer was repeated once along the bilayer-normal (z-direction) and was then rehydrated with 5250 water molecules. The double bilayer contained 112 CER, 112 CHOL and 64 FFA molecules. After density equilibration, the configuration was evolved for a further . Configurations were stored at intervals.
From the final configuration of this multilayer system, we randomly select one test water molecule and pull it through the lipid multilayer at a speed of along the z-direction. Configurations were stored every . These saved configurations were then evolved with the test molecule constrained to have the same -separation from the lipid center of mass, for longer than the relevant force-autocorrelation times (). The average force on the constrained water molecule can then be used to calculate the excess chemical potential Marrink and Berendsen (1994). The whole procedure was repeated for six different water molecules to calculate statistical errors.
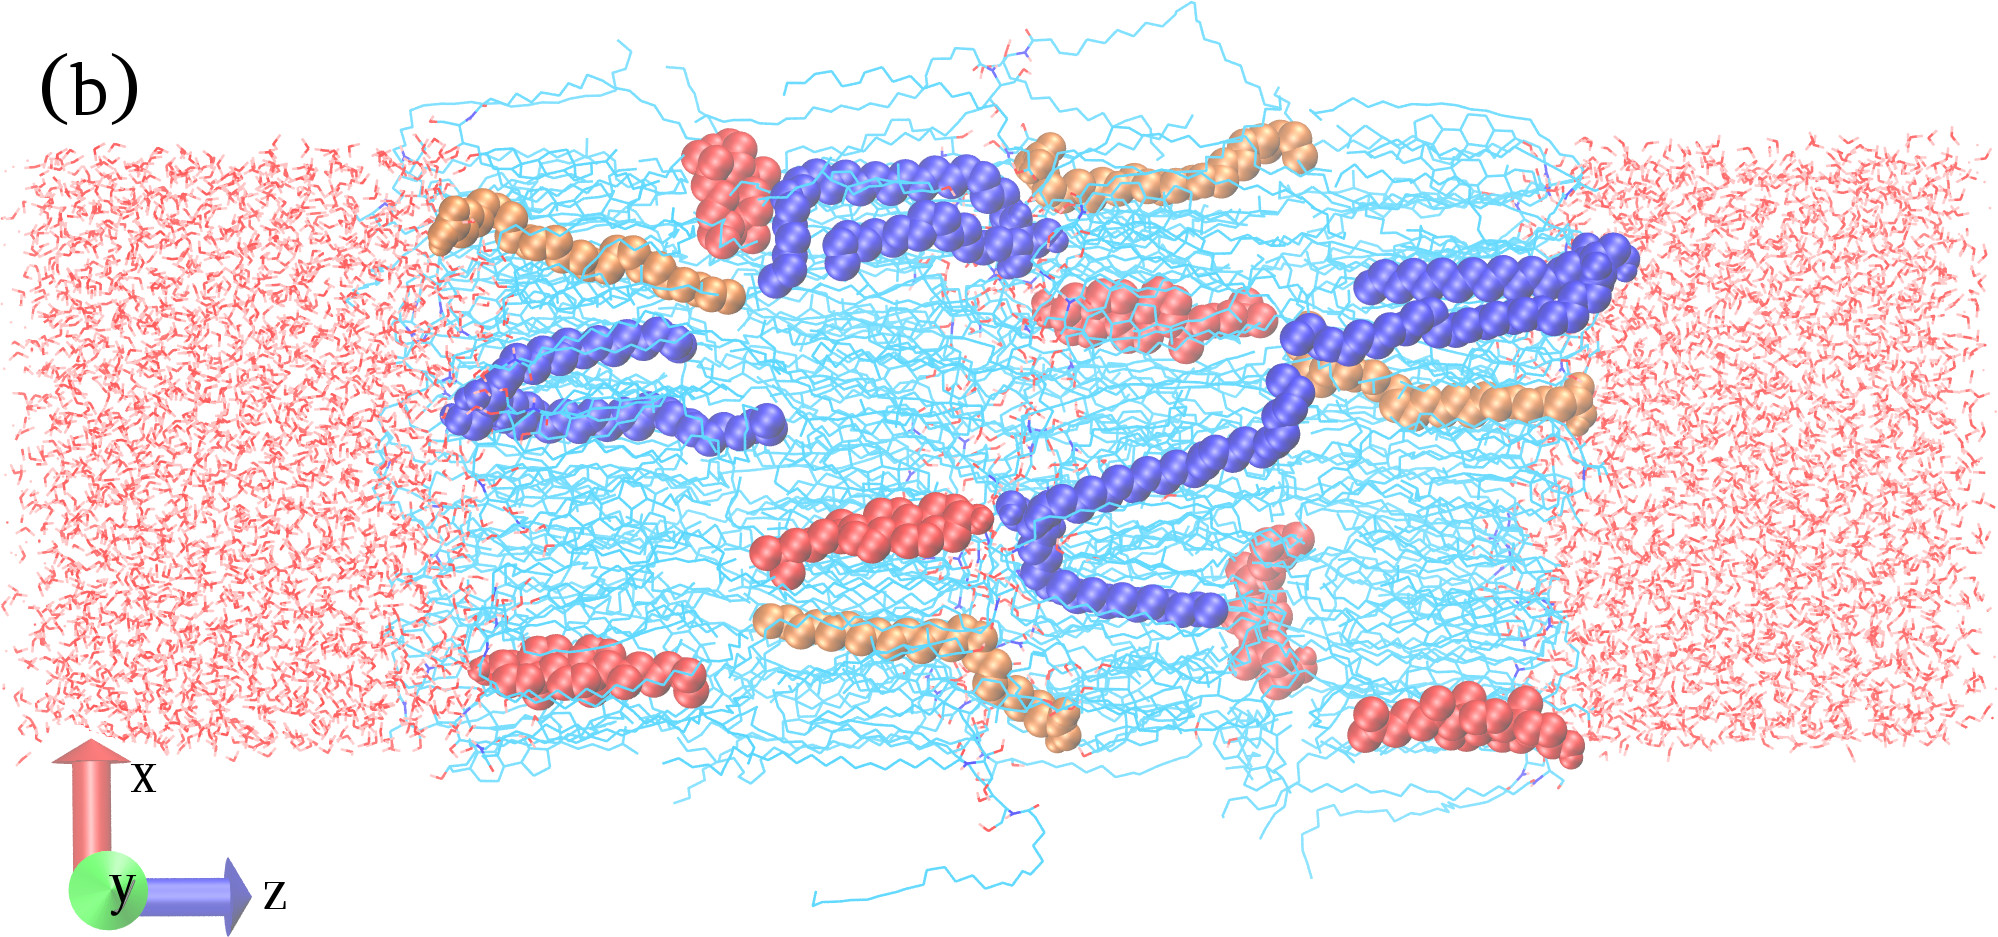
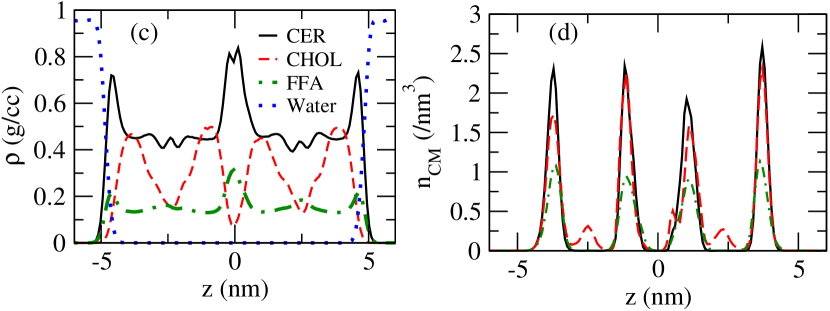
Lipid structure and dynamics: Fig. 1b shows a typical simulation snapshot with a few highlighted lipid molecules. CER and FFA show high nematic order close to the head groups and a disordered environment in the tail-tail interface of each bilayer (Fig S3, Supplementary Information Sup ). Some of the CHOL occupy this liquid-like tail-tail interface region. The head-head contact region () shows large mass densities from the CER and FFA (Fig. 1c), signaling better alignment of the lipids when a leaflets is in contact with one from an adjacent bilayer () as opposed to when they are in contact with water (). Fig. 1d shows that the CER and FFA centers of mass are sharply localized at the centers of the leaflets, while the CHOL center of mass has a subpopulation ( or molecules) in the tail-tail interface.
| lipid | inter HB | intra HB | H2O HB | total | |
|---|---|---|---|---|---|
| outer | CER | – | 0.94 | 2.02 | 2.96 |
| leaflet | CHOL | – | 0.26 | 0.58 | 0.84 |
| FFA | – | 0.36 | 1.30 | 1.66 | |
| inner | CER | 0.70 | 1.27 | – | 1.97 |
| leaflet | CHOL | 0.29 | 0.36 | – | 0.65 |
| FFA | 0.70 | 0.72 | – | 1.42 |
There are a large number of both intra-leaflet and inter-leaflet (and thus inter-bilayer) hydrogen bonds (Table 1). There are more total hydrogen bonds per lipid on the outer leaflets, presumably because of the greater flexibility afforded by the solvent degrees of freedom. While the outer-leaflet lipids hydrogen bond with water, the corresponding inner-leaflet lipids can replace some of these solvent hydrogen bonds by inter-leaflet hydrogen bonds, which effectively glue the inner leaflets together and make the dynamics of a double bilayer very different from a single hydrated bilayer.
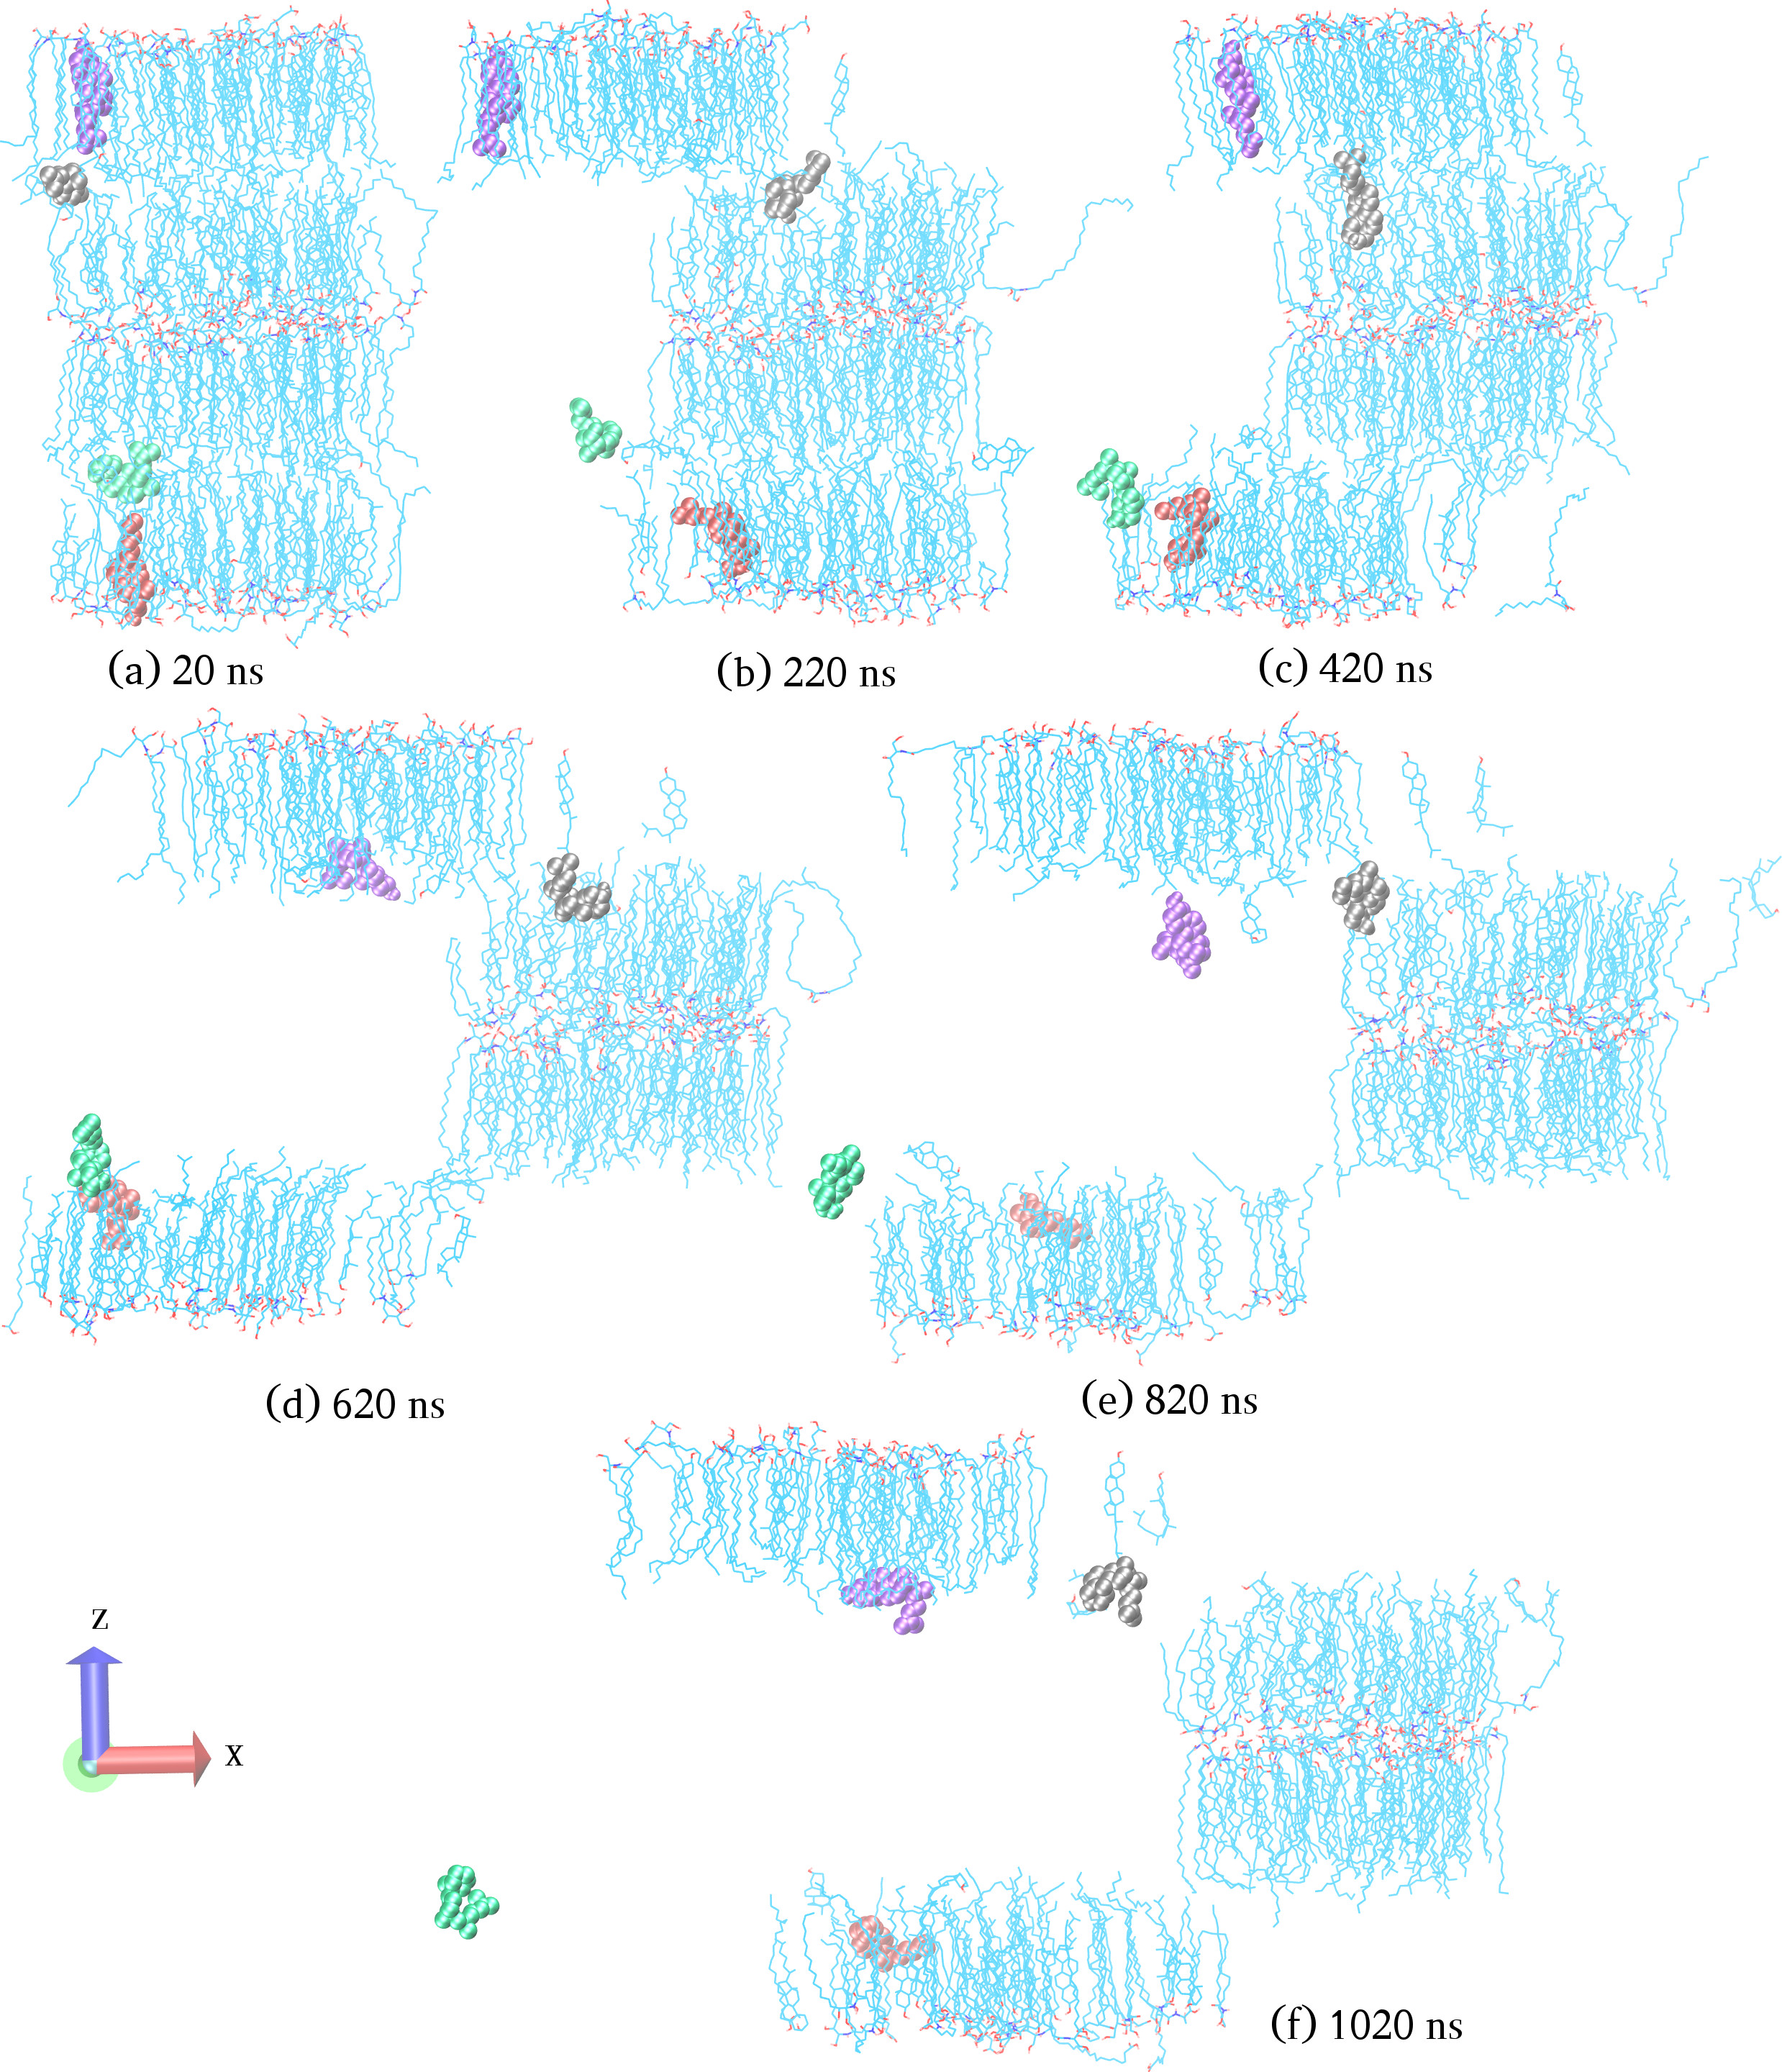
Fig. 2 shows snapshots during the trajectory. The two inner leaflets diffuse together coherently in the center of mass frame of the lipids. Thus, a stack of SC lipid multilayers behaves like a collection of ‘inverse bilayers’ wherein two leaflets belonging to adjacent traditional bilayers are strongly coupled by the head groups and slide relatively easily at the hydrocarbon tail-tail interface. This is the opposite from hydrated phospholipid biological membranes.
In Fig 2 we have highlighted four CHOL molecules, showing that CHOL frequently exchanges between the ordered regions of leaflets and the liquid-like tail-tail inter-leaflet region. SC lipids in vivo are in a glassy or gel state; despite local segmental motion (e.g. slithering of the tails), two dimensional diffusion only occurs through slow cage-hopping Das et al. (2009). However, the CHOL molecules in the liquid-like region can readily diffuse, both translationally and rotationally, which allows high overall CHOL mobility. A molecule in the ordered region can transfer to the liquid-like region and move a large distance. Because of the rapid tumbling and head-group reorientation due to rotational diffusion, it can easily be reabsorbed into either of the leaflets. The vacancy left when CHOL exits the ordered regions in turn increases the in-plane mobility of CER and FFA molecules.
From the peaks of CHOL center of mass density (Fig. 1d) we identify zones associated with the ordered and liquid-like regions of the bilayers, with boundaries specified by the local minima of . We define a transition between zones when the center of mass of a molecule penetrates 10% of the way into a neighboring zone, and remains in the new zone for at least 0.4 ns. In the long trajectory, we identified 322 such transitions involving 35 individual molecules (31% of total CHOL content), while 6 molecules (5% of CHOL) occupied both leaflets at different times. Assuming steady state, the characteristic time scale for CHOL exchange from an ordered leaflet to the central liquid-like zone is , and the characteristic flip-flop time for CHOL exchange between the two leaflets is 111In steady state, detailed balance implies that , where is the number in a given zone, is the rate, per molecule, that a molecule in zone transits to zone , and is the total number that transit in a time . Hence, if there are total transitions between two zones in time , then the characteristic time . For flip events in , and , giving and . For flip-flop events we consider all 112 CHOL molecules to be members of one of the two leaflets (exploring an ordered and a disordered zone) until the flip-flop event takes place (to another ordered zone). Hence, 6 flip-flop events in leads to . . Accounting for the inner and outer leaflets separately leads to a CHOL exchange timescales from the ordered to disordered region of for the outer (hydrated) leaflets and for the inner leaflets. The much faster CHOL exchange from the outer hydrated leaflets is reflected in a much larger mean-square in-plane displacement for all lipids in the outer leaflets, as compared to their counterparts in the inner leaflets (Fig. S7, Supplementary Information Sup ).
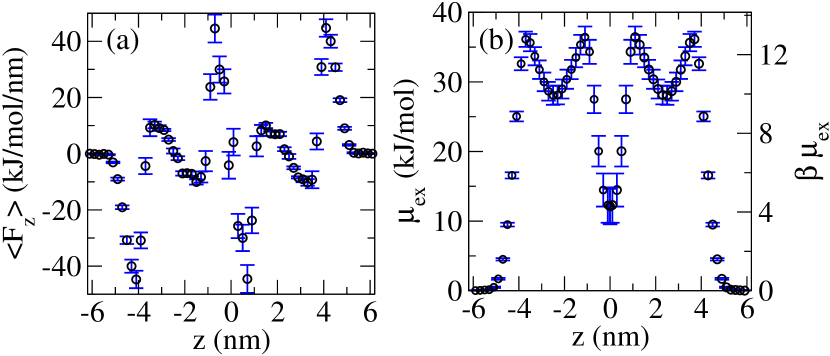
Excess chemical potential of water: From simulations with a water molecule constrained at a given height , we calculate the average -component of the force on the constrained water. Fig. 3(a) shows averaged over time and six different water molecules. Because of the symmetry about the lipid center of mass, we expect to be an odd function of . We exploit this symmetry in calculating the excess chemical potential, , from numerical integration of (Fig 3(b)). The maximum in the ordered region is similar to that found in simulations of hydrated SC lipid bilayers Das et al. (2010). The excess chemical potential remains positive and large compared to the thermal energy () at the bilayer-bilayer interface (), which demonstrates that at equilibrium the SC multilayers do not undergo swelling.
Discussion: The long () simulations show that CHOL has a dynamic subpopulation at the disordered bilayer midplane, which rapidly exchanges with CHOL in the ordered lipid region on s timescales. The high rotational diffusivity (tumbling) of CHOL in the mid-leaflet liquid-like region allows molecules from the subpopulation to readily incorporate into the ordered region of either of the adjacent leaflets, leading to fast flip-flop times .
CHOL flip-flop has been investigated extensively for phospholipid bilayers, yielding much slower timescale than found here. Different experiments assign a timescale of milliseconds to hours Garg et al. (2011); Bruckner et al. (2009). From potential of mean force calculations using an all atom DPPC bilayer with 40% CHOL concentration, the flip-flop time scale of CHOL was estimated to be Drew Bennett et al. (2009). Similar time scales were estimated from simulations of bilayers containing 1:1:1 molar ratios of palmitoylsphingomyelin (PSM), 1-palmitoyl-2-oleoyl-sn-glycero-3-phosphocholin (POPC), and CHOL Bennett and Tieleman (2012). Naively one would assign a much smaller flip-flop rate for CER bilayers, in which the small ceramide headgroup and prevalence of single chain fatty acids lead to relatively high densities in the ordered region, which would imply much lower molecular mobility, particularly in the gel phase found in vivo (and in our simulations).
However, CHOL flip-flop is enhanced by a number of effects that are specific to the SC membrane: (1) strong hydrogen bonding among CER molecules leads to an ordered dense leaflet (Fig. 1), which is comparatively less favorable for CHOL than in phospholipid solid (or fluid) phases; (2) the length asymmetry of the CER tails leads to a low-density liquid-like inter-leaflet region, within which the CHOL can reside (Fig S3, Supplementary Information Sup ); (3) the higher free-energy of CHOL in the ordered region lowers the barrier for hopping into the liquid-like region; (4) the relative disorder in the liquid-like region allows the CHOL to easily reorient to incorporate into another leaflet (Fig S3, Supplementary Information Sup ).
A flat multicomponent lipid bilayer is governed by a free energy that includes the asymmetry of the CHOL content between leaflets Ben-Shaul (1995); Bruckner et al. (2009):
| (1) |
where is the bending curvature, the bending modulus, the penalty for creating asymmetry, and the bending-asymmetry coupling depends on the shape and energetics of CHOL packing into the leaflets. An imposed curvature can induce a CHOL fluctuation on timescales longer than the flip-flop timescale , which leads to a reduction of the bending modulus . Thus, SC membranes can quickly adapt to widely different curvatures without the high elastic penalty expected for a gel-like phase. Such dynamic curvature changes are expected in vivo due to hydration- and dehydration-induced shape changes of the corneocytes, and normal folding and stretching of skin due to physiological activities. With the low permeability of skin such hydration-induced changes of corneocyte shape will happen much more slowly than flip-flop, which can act to keep the SC multilayers free of curvature stress.
The subpopulation of CHOL within the disordered center region allows for anomalous in-plane diffusion controlled by adsorption-desorption between the ordered and disordered regions Bychuk and O’Shaughnessy (1995), which is much faster than permitted in the dense lipid lamellae. In turn, the CHOL dynamics enhances the mobility of other lipid species by creating temporary free volumes in the ordered leaflet. Such enhanced molecular mobility should render skin more dissipative than similarly packed long chain molecules. Hence, flip-flop may be the dominant mechanism for the experimentally-observed enhancement of fluidity of SC lipids due to CHOL Kitson et al. (1994).
Summary: We have carried out large-scale molecular dynamics simulations of stratum corneum lipid bilayers. The membranes are strongly dehydrated, with a barrier for aqueous swelling of multilayers that is governed by inter-leaflet hydrogen bonding. Hence, theories developed to describe fully-hydrated phospholipids must be applied to SC multilayers with care. The gel-like phase found at physiological temperatures has a liquid-like disordered layer between leaflets, which facilitates rapid cholesterol flip-flop and can significantly soften the bending modulus, as well as inducing mechanisms for greater dissipation. One expects a strong modulus with little dissipation at high frequencies , and a softer response and greater dissipation at lower frequencies. These effects are important for adaptation of the skin to changing conditions, as well as contributing to the skin’s effective and remarkable resilience. The extensive hydrogen bonding within SC multilayers has some similarities with novel self-healing materials invented by Liebler et al. Cordier et al. (2008). In both cases, hydrogen bonds form and reform to control the mechanical properties and response of materials. Implementing an analog of CHOL flip-flop in self-healing materials might impart stronger dissipation and frequency dependent bending response.
The primary function of SC lipids is as a hydration barrier. Simulations show Das et al. (2010) that CER alone provides orders of magnitude lower permeability for water, when compared to three component CER:CHOL:FFA bilayer. The presence of CHOL decreases the tail order and thus increases permeability; however, CHOL also helps to soften the mechanical properties, both the intrinsic bilayer compressibility Das et al. (2010) and the bending modulus. Hence, Nature may have optimized the lipid composition so that the SC lipid matrix can be deformed rapidly and relatively easily, while still maintaining an acceptable hydration barrier.
This work was supported by Yorkshire Forward (YFRID Award B/302) and part financed by the European Regional Development Fund (ERDF). Computational resources were provided by SoftComp EU Network of Excellence. We gratefully acknowledge discussions with Anna Akinsina, Johan Mattsson, and Patrick Warren.
References
- Freinkel and Woodley (2001) R. K. Freinkel and D. T. Woodley, eds., The Biology of the Skin (Parthenon Publishing, London, 2001).
- Elias (2005) P. M. Elias, J. Invest. Dermatol. 125, 183 (2005).
- Michaels et al. (1975) A. S. Michaels, S. K. Chandrasekaran, and J. E. Shaw, AICHE J. 21, 985 (1975).
- Åberg et al. (2008) C. Åberg, H. Wennerström, and E. Sparr, Langmuir 84, 8061 (2008).
- Moghimi et al. (1996) H. R. Moghimi, A. C. Williams, and B. W. Barry, Int. J. Pharm. 131, 117 (1996).
- Sparr and Wennerström (2000) E. Sparr and H. Wennerström, Col. Surf. B: Biointerfaces 19, 103 (2000).
- Bouwstra et al. (1991) J. A. Bouwstra, G. S. Gooris, J. A. ver der Spek, and W. Bras, J. Invest. Derm. 97, 1005 (1991).
- Mak et al. (1991) V. H. W. Mak, R. O. Potts, and R. H. Guy, Pharm. Res. 8, 1064 (1991).
- Kiselev et al. (2005) M. A. Kiselev, N. Y. Ryabova, A. M. Balagurov, S. Dante, T. Hauss, J. Zbytovska, S. Wartewig, and R. H. H. Neubert, Eur. Biophys. J. 34, 1030 (2005).
- Swartzendruber et al. (1989) D. C. Swartzendruber, P. W. Wertz, D. J. Kitko, K. C. Madison, and D. T. Downing, J. Invest. Derm. 92, 251 (1989).
- Forslind (1994) B. O. Forslind, Acta Dermato Venerol 74, 1 (1994).
- Bouwstra et al. (1998) J. A. Bouwstra, G. S. Gooris, F. E. R. Dubbelaar, A. M. Weerheim, A. P. Ijzerman, and M. Ponec, J. Lipid Res. 39, 186 (1998).
- McIntosh (2003) T. J. McIntosh, Biophys. J. 85, 1675 (2003).
- Hill and Wertz (2003) J. R. Hill and P. W. Wertz, Biochim. Biophys. Acta - Biomembranes 1616, 121 (2003).
- Schr oter et al. (2009) A. Schr oter, D. Kessner, M. Kiselev, T. Hauß, S. Dante, and R. H. Neubert, Biophys. J. 97, 1104 (2009).
- Iwai et al. (2012) I. Iwai, H. Han, L. den Hollander, S. Svensson, L. Ofverstedt, J. Anwar, J. Brewer, M. Bloksgaard, A. Laloeuf, D. Nosek, S. Masich, L. Bagatolli, U. Skoglund, and N. L., J. Invest. Derm. 132, 2215 (2012).
- Bouwstra et al. (2003) J. A. Bouwstra, A. de Graaff, G. S. Gooris, J. Nijsse, J. W. Wiechers, and van Aelst Adriaan C., J. Invest. Derm. 120, 750 (2003).
- Richter et al. (2001) T. Richter, J. H. Müller, U. D. Schwarz, R. Wepf, and R. Wiesendanger, Appl. Phys. A 72, S125 (2001).
- Höltje et al. (2001) M. Höltje, T. Förster, B. Brandt, T. Engels, W. von Rybinski, and H.-D. Höltje, Biochim. Biophys. Acta 1511, 156 (2001).
- Pandit and Scott (2006) S. A. Pandit and H. L. Scott, J. Chem. Phys. 124, 014708 (2006).
- Notman et al. (2007) R. Notman, W. K. den Otter, M. G. Noro, W. J. Briels, and J. Anwar, Biophys. J. 93, 2056 (2007).
- Das et al. (2009) C. Das, M. G. Noro, and P. D. Olmsted, Biophys. J. 97, 1941 (2009).
- Das et al. (2010) C. Das, P. D. Olmsted, and M. G. Noro, Soft Matter 5, 4549 (2010).
- Das et al. (2013) C. Das, M. G. Noro, and P. D. Olmsted, Phys. Rev. Lett. 111, 148101 (2013).
- Engelbrecht et al. (2011) T. Engelbrecht, T. Hauß, K. Süß, A. Vogel, M. Roark, S. E. Feller, R. H. H. Neubert, and B. Dobner, Soft Matter 7, 8998 (2011).
- Ryckaert and Bellemans (1975) J.-P. Ryckaert and A. Bellemans, Chem. Phys. Lett. 30, 123 (1975).
- Jorgensen and Tirado-Rives (1988) W. Jorgensen and J. Tirado-Rives, J. Am. Chem. Soc. 110, 1657 (1988).
- Chiu et al. (1995) S. W. Chiu, M. Clark, V. Balaji, S. Subramaniam, H. L. Scott, and E. Jackobsson, Biophys. J. 69, 1230 (1995).
- Berger et al. (1997) O. Berger, O. Edholm, and F. Jähnig, Biophys. J. 72, 2002 (1997).
- Berendsen et al. (1981) H. J. C. Berendsen, J. P. M. Postma, W. F. van Gunsteren, and J. Hermans, in Intermolecular Forces, edited by B. Pullman (Reidel, Dordrecht, 1981) pp. 331–342.
- (31) Supplementary Material contains details about calculating hydrogen bonds, flip-flop times, diffusion, and the excess chemical potential of water. An animation of the trajectory is available on http://goo.gl/qqMzrE.
- Berendsen et al. (1995) H. J. C. Berendsen, D. van der Spoel, and R. van Drunen, Comp. Phys. Comm. 91, 43 (1995).
- van der Spoel et al. (2005) D. van der Spoel, E. Lindahl, B. Hess, G. Groenhof, A. E. Mark, and H. J. C. Berendsen, J. Comp. Chem. 26, 1701 (2005).
- Marrink and Berendsen (1994) S. J. Marrink and H. J. C. Berendsen, J. Phys. Chem. 98, 4155 (1994).
- Note (1) In steady state, detailed balance implies that , where is the number in a given zone, is the rate, per molecule, that a molecule in zone transits to zone , and is the total number that transit in a time . Hence, if there are total transitions between two zones in time , then the characteristic time . For flip events in , and , giving and . For flip-flop events we consider all 112 CHOL molecules to be members of one of the two leaflets (exploring an ordered and a disordered zone) until the flip-flop event takes place (to another ordered zone). Hence, 6 flip-flop events in leads to .
- Garg et al. (2011) S. Garg, L. Porcar, A. C. Woodka, P. D. Butler, and U. Perez-Salas, Biophys. J. 101, 370 (2011).
- Bruckner et al. (2009) R. J. Bruckner, S. S. Mansy, A. Ricardo, L. Mahadevan, and J. W. Szostak, Biophys. J. 97, 3113 (2009).
- Drew Bennett et al. (2009) W. F. Drew Bennett, J. L. MacCallum, M. J. Hinner, S. J. Marrink, and D. P. Tieleman, J. Am. Chem. Soc. 131, 12714 (2009).
- Bennett and Tieleman (2012) W. F. D. Bennett and D. P. Tieleman, J. Lipid Res. 53, 421 (2012).
- Ben-Shaul (1995) A. Ben-Shaul, in Handbook of biological physics, edited by R. Lipowsky and E. Sackmann (Elsevier, 1995) pp. 359–401.
- Bychuk and O’Shaughnessy (1995) O. V. Bychuk and B. O’Shaughnessy, Phys. Rev. Lett. 74, 1795 (1995).
- Kitson et al. (1994) N. Kitson, J. Thewalt, M. Lafleur, and M. Bloom, Biochemistry 33, 6707 (1994).
- Cordier et al. (2008) P. Cordier, F. Tournilhac, C. Soulié-Ziakovic, and L. Leibler, Nature 451, 977 (2008).
Supplementary material:
Fast cholesterol flip-flop and
lack of swelling in skin lipid multilayers
Chinmay Das, Massimo G. Noro and Peter D. Olmsted
S1 Analysis details and additional results
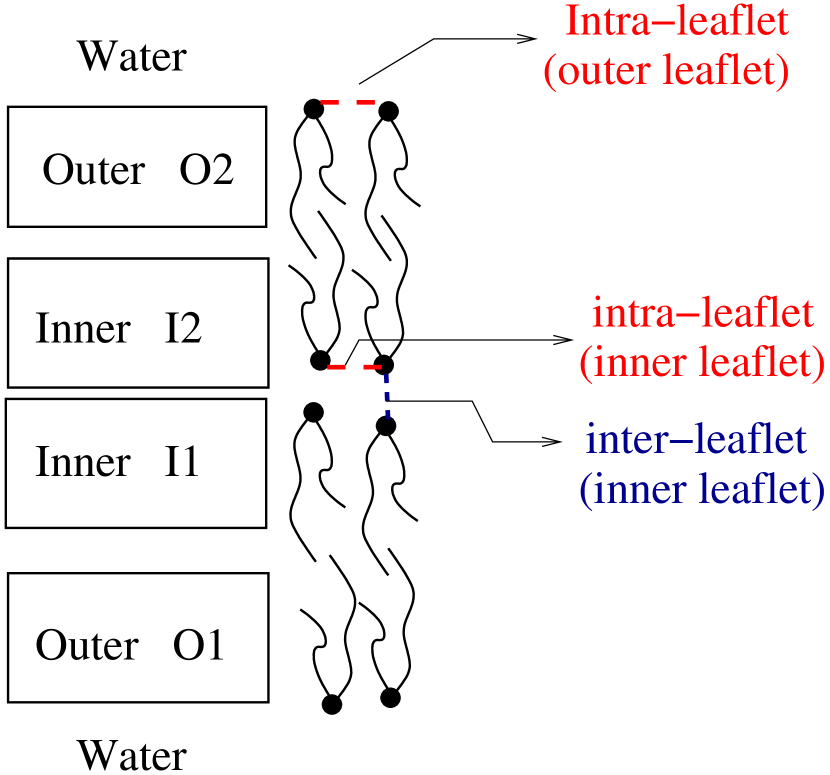
In this supplementary material, we provide the methods used in calculating the hydrogen bonds, flip-flop time-scales, in-plane molecular diffusion, and the excess chemical potential of water. In our simulation of double bilayer in excess water, only two of the leaflets are in contact with water (Fig. S1). We term these two leaflets as the ‘outer leaflets’. The other two ‘inner’ leaflets face each other and are not in contact with water. After an equilibration time of 20 ns, we stored 5000 configurations separated by 0.2 ns spanning a total of 1 s. Unless otherwise stated, the results below are averaged over these 5000 configurations.
S1.1 Hydrogen bonds
We use a geometric criteria Ferrario et al. (1990); Luzar and Chandler (1993, 1996); Torshin et al. (2002) to define a hydrogen bond if the distance between the donor and the acceptor atoms is less than Å and simultaneously the absolute angle between the vectors and is less than 30∘ (Fig. S2).
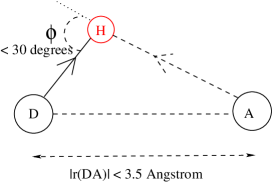
Table S1 shows the average number of lipid-lipid hydrogen bonds for each lipid species. We have separated these into intra-leaflet and inter-leaflet (for inner leaflets that face each other) hydrogen bonds. The inner leaflet lipids form a large number of intra-leaflet, as well as inter-leaflet, hydrogen bonds with lipids. In addition, lipids in the outer leaflets are also involved in a large number of hydrogen bonds with water molecules.
| Lipid | Outer leaflets | Inner leaflets | ||||
|---|---|---|---|---|---|---|
| lipid | water | total | intra | inter | total | |
| CER | 0.94 | 2.02 | 2.96 | 1.27 | 0.70 | 1.97 |
| CHOL | 0.26 | 0.58 | 0.84 | 0.36 | 0.29 | 0.65 |
| FFA | 0.36 | 1.30 | 1.66 | 0.72 | 0.70 | 1.42 |
S1.2 Tail order
To investigate the alignment of the lipid tails, for any three consecutive CH2 groups (Ci-1, Ci and Ci+1) in the CER or FFA molecules, we consider the angle of the vector (Ci+1 - Ci-1) with respect to the z-axis (normal direction to the lipid layers). We define an order parameter Vermeer et al. (2007)
| (S1) |
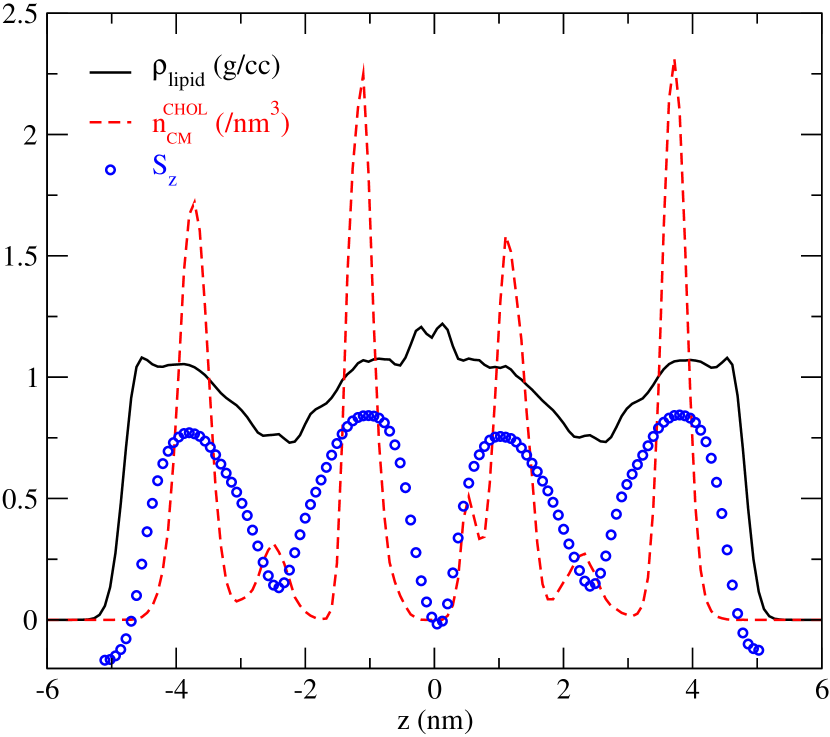
where the angular bracket denotes averaging over all CH2 triplets with the central group being at a distance from the lipid center of mass. The usual order parameter is calculated (or measured) as a function of carbon number along the lipid tails Vermeer et al. (2007), while we consider it as a function of . For perfect tail alignment along the -direction, ; random order gives ; and perfect aligment perpendicular to the -direction gives . Fig. S3 shows that becomes close to zero in the tail-tail interface region () signifying a disordered region. The same region shows lower total mass density and a subpopulation of CHOL center of mass.
S1.3 Density profile and CHOL flip-flop
We unfold the molecules in the saved configurations and fix the lipid center of mass at the origin. The mass density of the lipids and the number density of the center of masses of the lipids were calculated in this lipid center of mass reference frame.
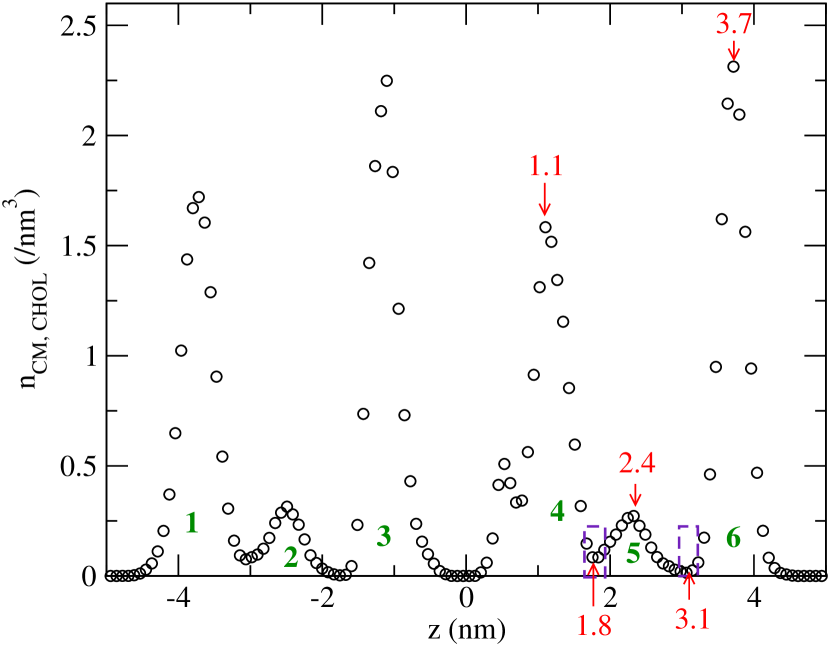
From the distribution of the centers of mass of CHOL, we identify two inter-leaflet liquid like regions centered at . For the peak at , the minima in the distribution of CM are at and . In the first configuration, we assign a zone index to a given CHOL depending on the -coordinate of its center of mass:
| (ordered) zone 1: | ||||
| (disordered) zone 2: | ||||
| (ordered) zone 3: | ||||
| (ordered) zone 4: | ||||
| (disordered) zone 5: | ||||
| (ordered) zone 6: |
In subsequent configurations we assign a new provisional zone index to a given CHOL only if has moved into the next zone by at least 10% of width of the next zone. This criteria is indicated by dashed boxes in Fig. S4. Thus, a CHOL initially belonging to zone 5 is considered to have moved to zone 4 only if its .
We define a flip event as a transit between that does not revert to the original zone within two frames (0.4ns). There are nearly 3 times more flip events involving the outer leaflets than involving the inner leaflets. We define a flip-flop event to be when a CHOL enters a ordered zone after having entered the disordered zone from a different ordered zone. In our trajectory we did not find any lipid exchange between the bilayers, so that all flip-flop events involve CHOL exchange between an inner leaflet and an outer leaflet. Table S2 shows the data used in calculating the flip-flop time scales.
| Transition | Starting zone | Finishing Zone | events | ||||
|---|---|---|---|---|---|---|---|
| region | zone # | region | zone # | ||||
| flip | outer ordered | (1, 6) | 102.7 | disordered | (2, 5) | 241 | 0.4 |
| inner ordered | (3, 4) | 102.7 | disordered | (2, 5) | 81 | 1.2 | |
| ordered | (1, 3, 4, 6) | 102.7 | disordered | (2, 5) | 322 | 0.64 | |
| disordered | (2,5) | 9.3 | ordered | (1,3,4,6) | 322 | 0.06 | |
| flip-flop | outer or inner leaflets | (1,6) or (3,4) | 112 | inner or outer leaflets | (3,4) or (1,6) | 6 | 0.19 |
S1.4 Mean square displacement
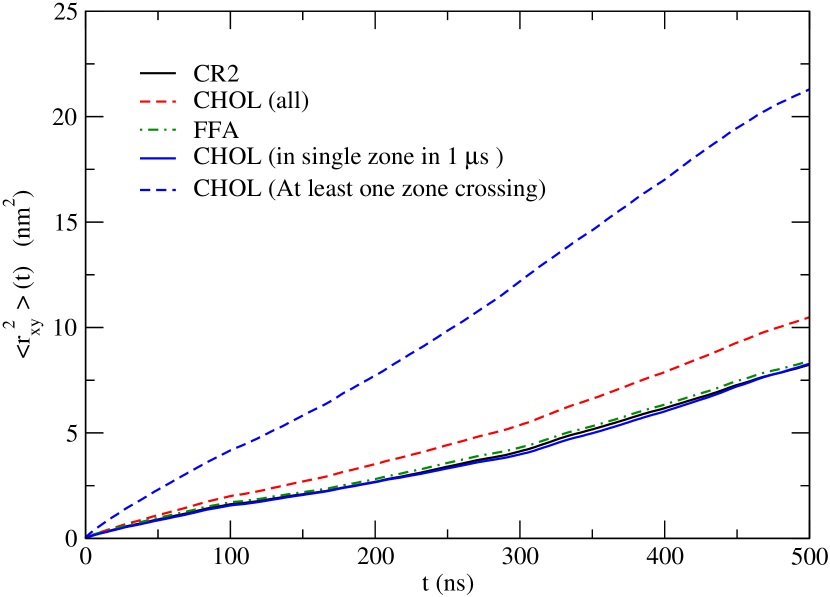
Fig. S5 shows the component of mean square displacement of the center of mass of the lipids, in a reference frame in which the center of mass of all the lipids is fixed. The data is averaged over the lipid molecules and over the time origin. CHOL shows higher in-plane mobility (red dashed line) than CER or FFA. We separate CHOL into populations that did and did not undergo flip events during the entire trajectory. CHOL without any flip events show a mean-square in-plane displacement similar to that of CER or FFA, while CHOL with flip events have a much larger mobility: e. g.
| (S2) |
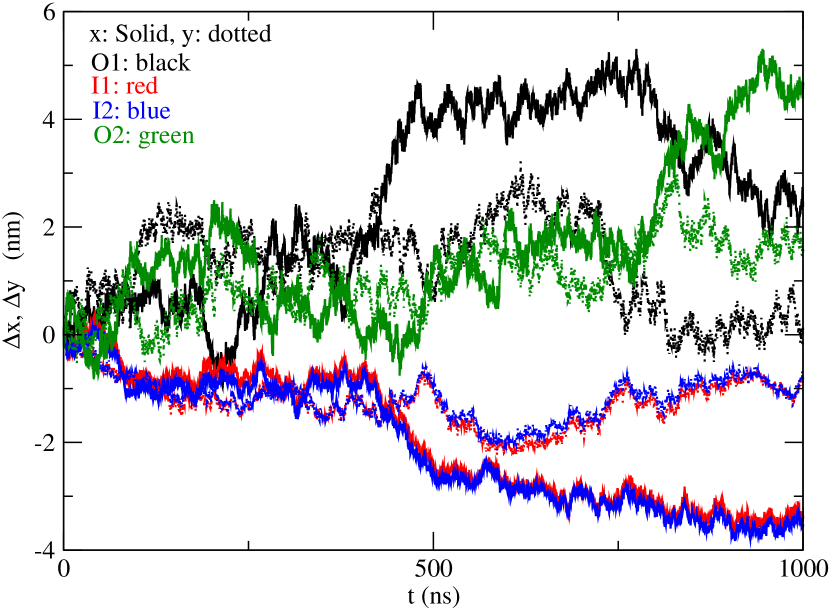
In simulations of finite bilayers the leaflets can diffuse with respect to each other Den Otter and Shkulipa (2007). Since some of the CHOL molecules move between leaflets, we define an approximate leaflet center of mass in terms of the CER and FFA molecules. Fig. S6 shows the diffusion of the leaflets’ centers of mass. Both the and components of the inner two leaflets (red and blue) move together coherently over the entire trajectory.
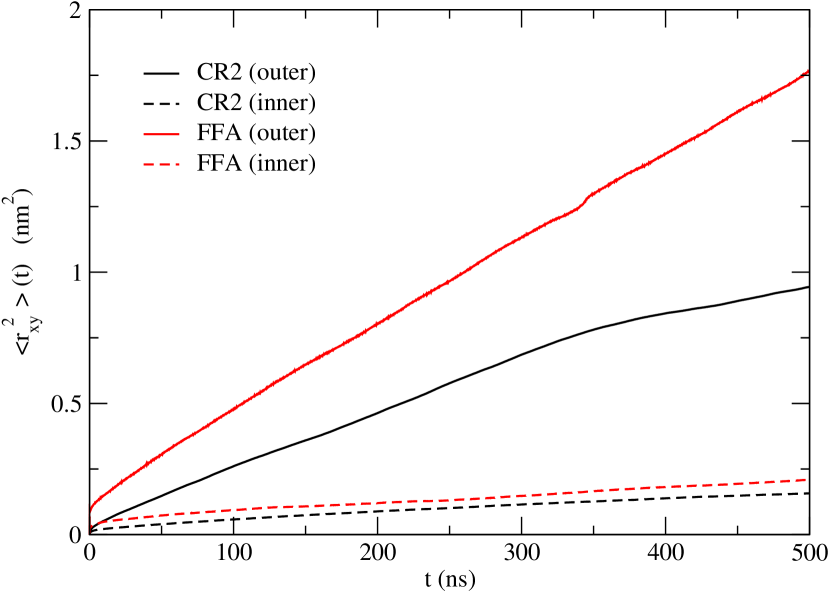
By calculating displacements in the reference frame of a given leaflet, we obtain the mean square displacement of CER and FFA lipids in the reference frame in which the leaflet center of mass is fixed, which is appropriate for a multilayer stack in which leaflet diffusion or sliding is prohibited. Fig. S7 shows that the lipids in the outer leaflets are significantly more mobile than those in the inner leaflets. Comparison of Figs. S7 and S5 shows that, even for the outer leaflets, the main contribution to in-plane displacement is from leaflet diffusion, which is pronounced here because of the small membrane size and periodic boundary conditions. The fast CHOL exchange and fewer inter-lipid hydrogen bonds render the lipids in the outer leaflets several times more mobile.
S1.5 Force fluctuations for constrained water molecules
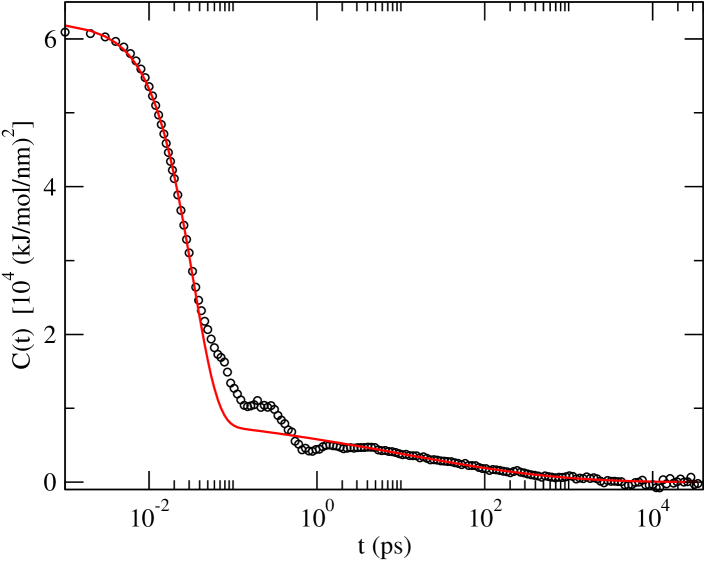
We perform simulations in which a single water molecule is constrained to at a given -separation from the lipid center of mass. This constraint induces a rapidly fluctuating force in the direction. However, we find a slowly decaying time correlation in , particularly in the ordered regions. At a fixed , we fit the autocorrelation of to a sum of two generalized exponentials:
| (S3) | ||||
| (S4) |
where the parameters , and are fitted with the Levenberg-Marquardt damped least-square method. Fig. S8 shows in the ordered leaflet region close to bilayer-bilayer interface () along with the fit with two stretched/compressed exponentials. Assigning an average decay time , the fit gives a fast decay time of and a slow decay time of . At each , we ensure that the simulations are longer than the slow decay time.
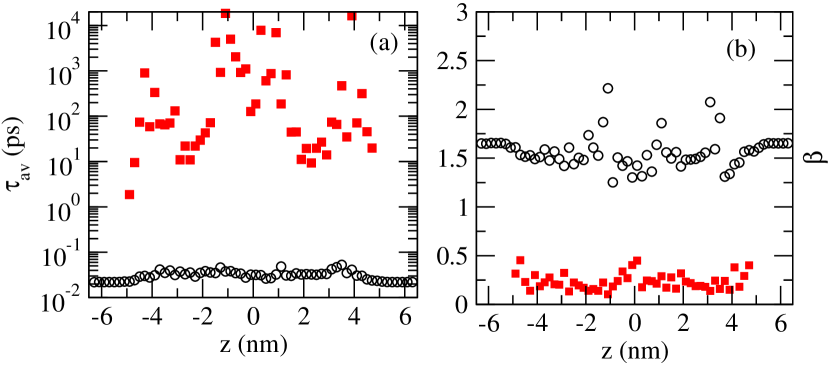
Fig. S9 shows the variation of the average decay times and the exponents with . There is a fast decay in at all with and exponent (open circles in Fig. S9). Inside the lipid double bilayer, there is an additional slowly decaying component (filled squares in Fig. S9) that follows a stretched exponential with in the most ordered part of the leaflets, with a stretching exponent .
Inside the ordered lipid leaflets, the diffusion of the constrained water molecule is limited to timescale (the longest time simulated for the constrained water simulations). We use six separate simulations with a different randomly chosen water molecules to calculate at a fixed . Furthermore, we use the antisymmetric property of to get 12 independent estimates of at a given . The error-bars in the excess chemical potential are calculated from error of mean from these 12 estimates of at each .
References
- Ferrario et al. (1990) M. Ferrario, M. Haughney, I. R. McDonald, and M. L. Klein, J. Chem. Phys. 93, 5156 (1990).
- Luzar and Chandler (1993) A. Luzar and D. Chandler, J. Chem. Phys. 98, 8160 (1993).
- Luzar and Chandler (1996) A. Luzar and D. Chandler, Phys. Rev. Lett. 76, 928 (1996).
- Torshin et al. (2002) I. Y. Torshin, I. T. Weber, and R. W. Harrison, Protein engineering 15, 359 (2002).
- Vermeer et al. (2007) L. S. Vermeer, B. L. de Groot, V. Réat, A. Milon, and J. Czaplicki, Eur. Biophys. J. 36, 919 (2007).
- Den Otter and Shkulipa (2007) W. Den Otter and S. Shkulipa, Biophys J. 93, 423 (2007).