Emergence of cooperativity in plasticity of soft glassy materials
Abstract
The elastic coupling between plastic events is generally invoked to interpret plastic properties and failure of amorphous soft glassy materials. We report an experiment where the emergence of a self-organized plastic flow is observed well before the failure. For this we impose an homogeneous stress on a granular material, and measure local deformations for very small strain increments using a light scattering setup. We observe a non-homogeneous strain that appears as transient bands of mesoscopic size and well defined orientation, different from the angle of the macroscopic frictional shear band that appears at failure. The presence and the orientation of those micro-bands may be understood by considering how localized plastic reorganizations redistribute stresses in a surrounding continuous elastic medium. We characterize the lengthscale and persistence of the structure. The presence of plastic events and the mesostructure of the plastic flow are compared to numerical simulations.
pacs:
83.50.-v,62.20.M-,83.80.Fg,62.20.F-Amorphous materials have intermediate mechanical properties between solids and liquids. At low stress, they behave as elastic solids, but deform plastically and flow when the stress increases. These generic behaviors, observed in many different systems such as concentrated emulsions Goyon2008 , colloidal systems Besseling2010 , foams Kabla2007b or molecular glasses Tanguy2006 with apparently universal plastic or rheological laws Sollich1997 ; Derec2001 , suggest that such materials may be described using a common framework Goyon2008 ; Katgert2010 ; Nguyen2011 . At the center of those descriptions is the hypothesis of localized reorganizations. Such events have been observed in many different studies Tanguy2006 ; Kabla2007b ; Schall2007 ; Amon2012 . Each event modifies locally the mechanical equilibrium, causing the surrounding material to deform, and creating internal stresses. These stresses may then provoke other events, leading to a succession or avalanche of events Falk1998 ; Maloney2006 . The coupling between events, and its relevance to an avalanche-like cascade scenario for the description of the final persistent shear-band is still an open question Maloney2006 ; Dahmen2011 .
Several experimental works show isolated reorganizations followed by localized flow structures, suggesting the existence of such coupling. Conclusions remain elusive in direct observation of colloidal glasses due to the dominance of thermal activity over the triggered events Schall2007 . In athermal systems such as granular materials Amon2012 or foams Kabla2007b , the steps between accumulation of individual events and appearance of shear bands remain unclear. Very recent numerical and theoretical results suggest that reorganization events may indeed couple in order to produce bands Maloney2006 ; Tsamados2008 ; Talamani2011 ; Martens2012 ; Dasgupta2012 ; Gimbert . However, the bands observed numerically resulting from the interacting local events are transient and correspond to self-healing micro-cracks, of a different nature than the final persistent shear-bands. To our knowledge such transient micro-bands forming a clear intermittent structure have never been reported experimentally.
We present in this letter the first direct experimental evidence showing the progressive emergence of cooperative effects during plastic deformations of an amorphous material. For this, we use a very sensitive light scattering setup to monitor the homogeneous biaxial compression of a granular material. We then show that the plastic flow at the early stage of the loading of a granular material is concentrated along self-healing micro-bands. The orientation of those transient micro-bands are clearly different from the Mohr-Coulomb angle of the final permanent shear band. We show that the orientations of those microbands are given by the Eshelby solution Eshelby1957 for the long-range stress redistribution induced by local plastic reorganizations in an elastic material. We also show that the transient micro-bands are more prominent as the rupture is approached.
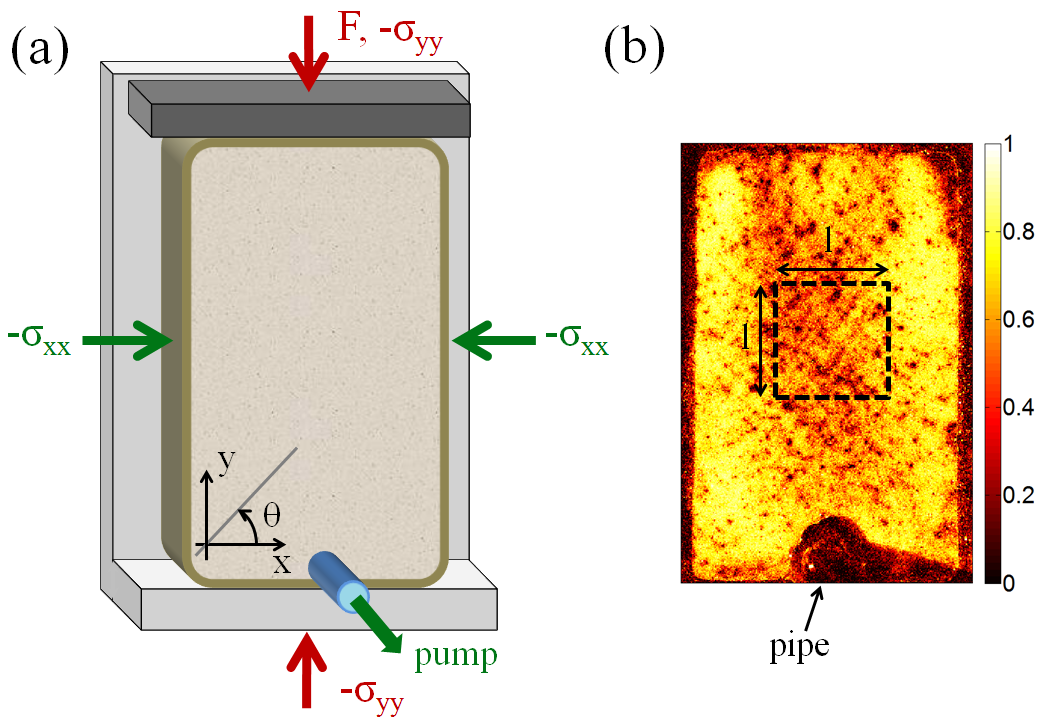
–Experimental setup. We deform an assembly of glass spheres by imposing a homogeneous stress with a biaxial apparatus. We recall here the main features of the setup described extensively elsewhere LeBouil2013 : The material (glass beads, diameter , volume fraction ) is placed between a preformed latex membrane (size mm) and a glass plate. A pump produces a partial vacuum inside the membrane, creating a confining stress . The confined sample is positioned on a metallic structure (in light grey on Fig. 1(a)). The glass plate is not represented on Fig. 1(a) and is at the front. The back metallic plate and the front glass plate forbid displacement normal to the plane, ensuring plane-strain conditions. The bottom of the sample rests on a fixed plate, while the upper plate (dark grey) is displaced by a step motor. The stress on the moving plate is , where is the force measured by a sensor fixed to the plate, and the section of the sample. Although there is probably some solid friction between the granular material and the plates, we do not observe noticeable differences of deformation between the upper and lower part of the sample. The stress gradient due to gravity is negligible, and the value of confining stress is such that cohesion effects and crushing of particles are unimportant. The global macroscopic deformation is calculated as with the upper plate displacement and the sample height (see left inset of Fig. 2(a)). The compressions are done at fixed deformation rate . We checked that we were in the quasistatic limit.
Strain heterogeneities are observed using a dynamic light scattering setup Erpelding2008 . An expanded nm laser beam illuminates the material. Because of the coherence of the light source, interferences occur and a speckle pattern forms. The image of the front side of the sample is recorded by a camera. Two different speckle images are compared using a correlation method explained elsewhere Erpelding2008 . Images are subdivided in square zones, and for each zone we calculate the normalized correlation function
| (1) |
where and are the intensity matrices of a same zone in two different images, and indicates the average over the zone. Each zone becomes a pixel in a correlation map (see Fig. 1(b) and movie in supplemental material movie ), corresponding to a volume of surface in the plane and of depth of few . The decorrelation of the scattered light comes from relative bead motions. We thus measure a combination of affine and nonaffine bead displacements, and rotation of non-spherical beads. In the following we present maps based on images made at sample deformations and , and we note the value of the normalized correlation at compression and at position (see Fig. 1(b)).
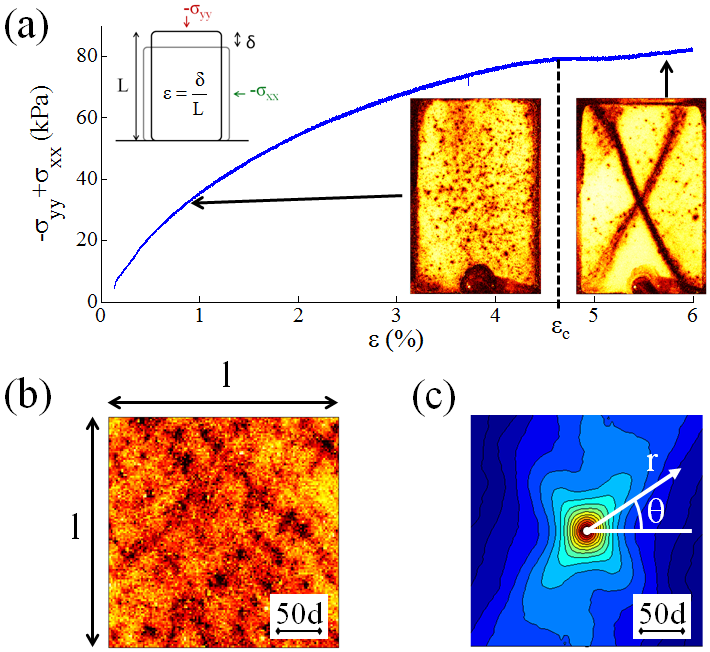
–Plastic flow structure. Fig. 2(a) shows the evolution of the stress difference as a function of the deformation . At the beginning of the loading, increases with , and then attains a plateau, consistent with numerous preceding studies, where a granular material was prepared near the critical state volume fraction schofield . The stress plateau at corresponds to the failure of the sample, confirmed by the correlation map shown in Fig. 2(a) (rightmost inset). The deformation is dominated by two symmetric shear bands where is low, corresponding to highly localized deformation. The inclination of the bands is , in agreement with a Mohr-Coulomb analysis for a frictional material, with the internal friction angle nedderman . at failure (). Those bands are permanent in the sense that they do not evolve with once they appear (see movie in supplemental material movie .
Fig. 2(b) shows a map of deformation before failure. The deformation is strongly heterogeneous with a complicated fine structure at small scale. In contrast with the permanent shear bands observed after failure, this deformation pattern fluctuates strongly during the loading (see movie in supplemental material movie ). To investigate the spatial structure and intermittency of the plastic flow, we consider the spatial correlation function of :
| (2) |
where is an average over correlation maps, i.e. a deformation of , and over , for and covering the region of interest on Fig. 1(b). Fig. 2(c) shows a plot of . Along two symmetric directions with the correlation decays slowly with (see fig.4.(a)). The direction of anisotropy is almost constant during the loading, and is clearly different from .
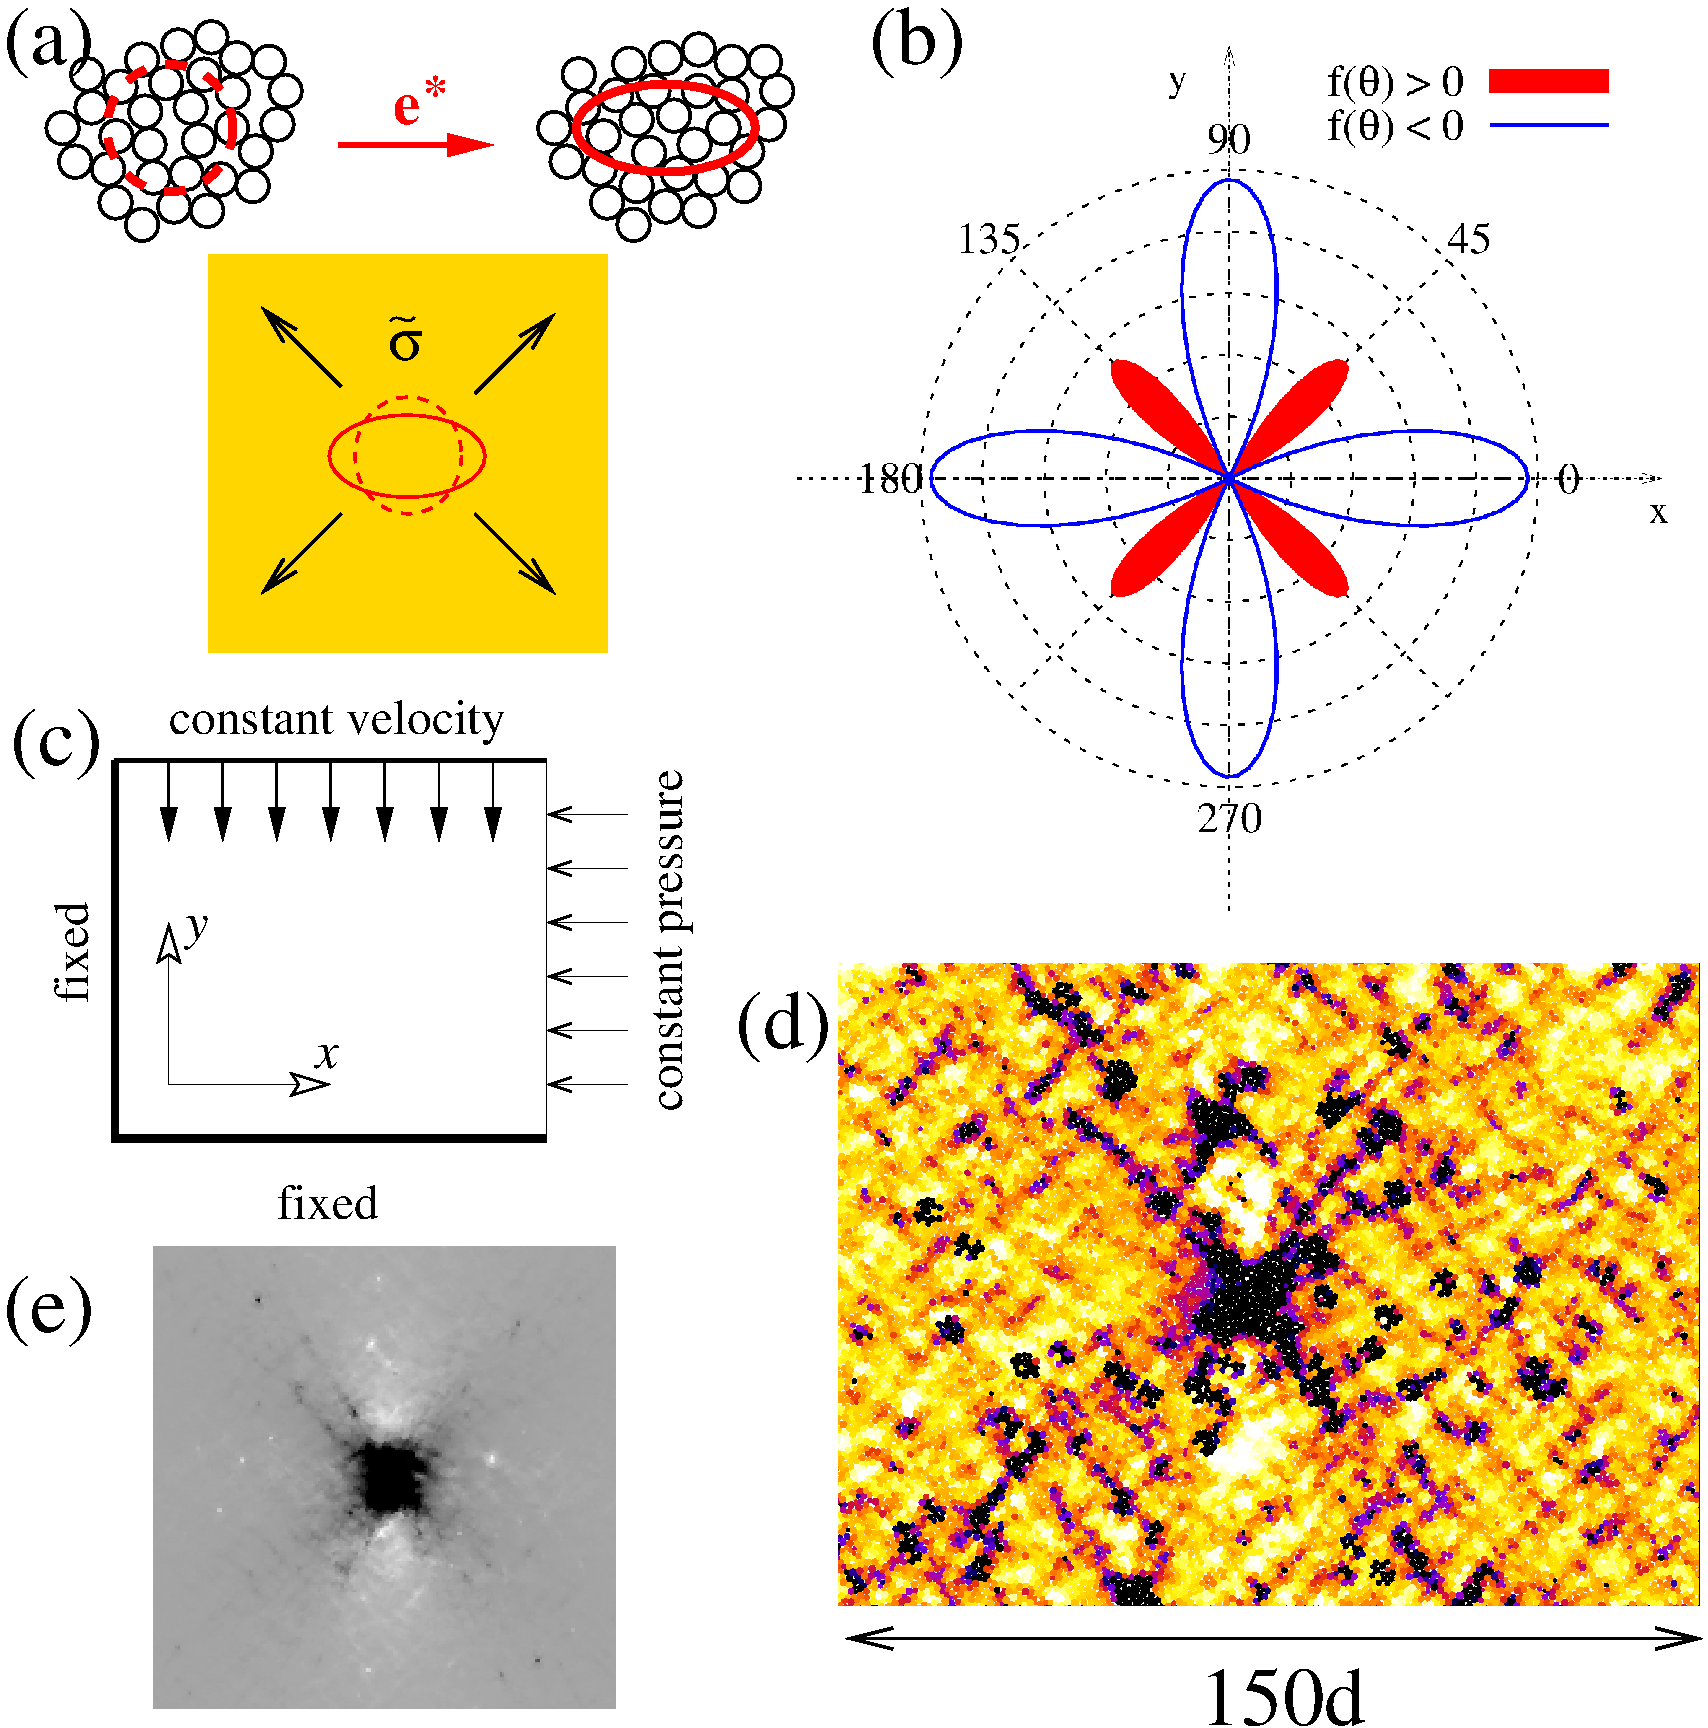
–Localized plastic events. To explain the observed structure of the plastic flow we first investigate theoretically the consequences of a single, isolated reorganization somewhere in the granular material. Consider a plastic deformation that relaxes stress within a small volume, but redistributes it in the surrounding material. We consider that the surrounding region behaves as a linear elastic material Makse2004 , that we will suppose isotropic with Poisson ratio . Eshelby gave an analytical solution to this 3D problem Eshelby1957 : Let be the strain tensor of the reorganization (see Fig.3(a)). We suppose , i.e., that is coaxial to the applied stress tensor and because of the plane-strain configuration, leaving only and as the non-zero strain components. Far from the rearrangement, the additional stress originating from the rearrangement in the x-y plane is , with , where
| (3) |
If the redistributed stress adds to the applied stress, increasing strain along those directions. Its maximum occurs for . In the case of an isovolumic transformation, . Fig. 3(b) shows in this case. For a local rearrangement in agreement with the macroscopic deformation of the sample, i.e. and of opposite signs, increases (resp. decreases) for a dilating (resp. contracting) rearrangement, with extremal values . The largest possible value for is then , close to the value of of the experiment. This reorganization structure has been shown in numerical studies of molecular glasses Maloney2006 ; Tsamados2008 and cellular foam Kabla2007b , but the existence of such elastic redistribution in frictional granular material is still an open question. Indeed, the existence of an elastic limit for such system is still a matter of debate Makse2004 . We performed numerical bidimensional Discrete Element Method simulations of a biaxial compression test (see Fig. 3(c) for boundary conditions). Fig. 3(d) shows results from a simulation of grains, using a visualization method inspired by the experimental technique: Positions of the grains are recorded at strain increments of . Two successive system states are compared, and for each grain, a local strain (average relative change in distance to its neighbors) is calculated. Those grains whose local strain is large are dark. We can generate a plastic event in the simulation by softening a small number of grains in the sample (see Fig. 3(e)) and we obtain a local deformation in accordance with the analytical solution of Fig. 3(b). Fig. 3(d) shows that such local events also occur during the compression of the granular material.
–Coupling between localized events and plastic flow structure. Along the directions where is positive, the additional stress has the same sign as the applied stress, possibly triggering new reorganizations. We therefore expect deformation to be organized in micro-bands whose orientations are given by the Eshelby solution. This structure is visible in the numerical experiments where very transient localized lines inclined at are present (see Fig. 3(d)). The resulting images display the same phenomenology as the experimental results: well before failure, deformation is concentrated in short diagonal micro-bands, (probably similar to those reported in other studies Kuhn1999 ; Gimbert ; Hall2010 ), and at failure, a shear band appears (not shown here). The agreement between 2D simulation and 3D experiments supports our plane strain hypothesis.
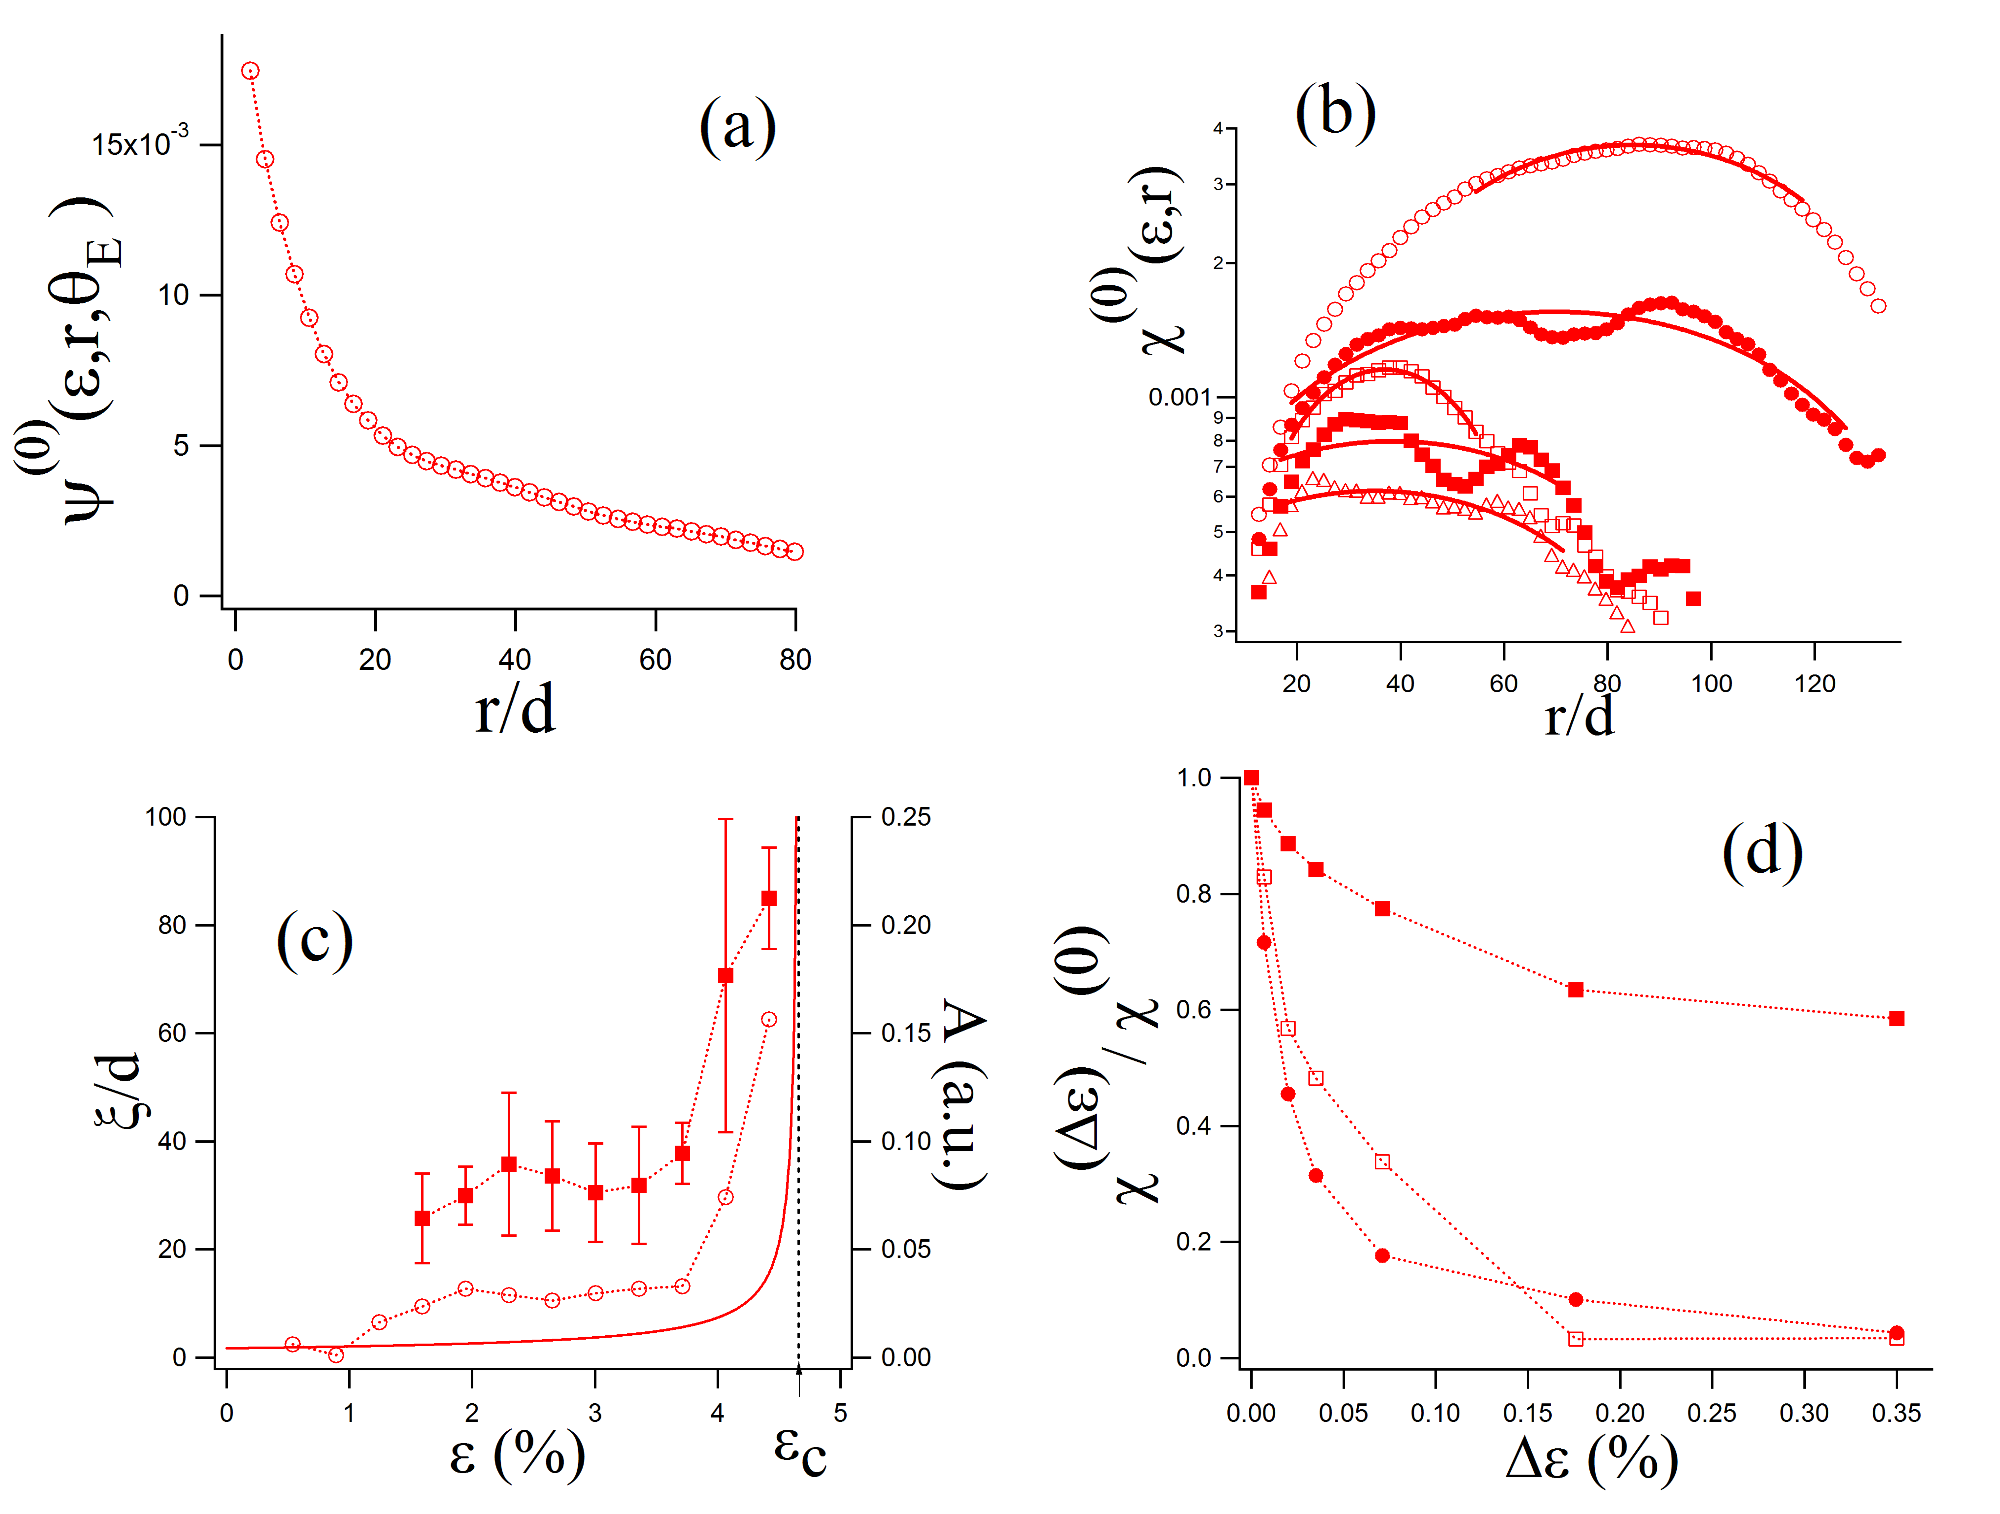
–Spatial and temporal correlations. Coming back to our experimental data, we focus on the evolution of the anisotropic part of during the loading, which we define as:
| (4) |
with the isotropic part of . Fig. 4(b) shows the evolution of in function of for different values of . We observe that the anisotropic part of the correlation function increases as the loading increases. We consider a two-fold characterization of . First the integral estimates the strength of the anisotropy. Second the characteristic distance at which the correlation is maximum is computed using a quadratic fit (plain line of fig. 4(b)) of the experimental curves near maximum. Fig. 4(c) shows that both the integral and the characteristic length of the anisotropy increase as the loading progresses toward rupture. Finally, the transient nature of the observed structure can be shown by considering the scale of deformation at which the plastic flow persists. For this, we considered the evolution of with at a given . Fig. 4(d) shows that close to rupture, for and , the deformation persists after a deformation increment . On the contrary, further from the failure (), the deformation decays over a typical increment of deformation .
From the structure of the plastic flow, a characteristic length revealing the cooperativity of the fluctuation of plastic flow emerges. The values of are in quantitative agreement with numerical simulations of granular material Kuhn1999 where fluctuations coupled on distance are reported. Theoretically bocquet2009 a non-local rule for the mean plastic flow is expected to emerge from those fluctuations. Such non-local flow rule have been proposed to describe granular plastic flow Kamrin2012 . Fig. 4(c) shows the expected evolution of the cooperativity length notemu proposed in kamrin2013 during the loading. The cooperativity length of the mean flow is smaller than . This is probably due to the coarse-graining process described in bocquet2009 .
–Conclusion. In summary, a careful experimental study of the plastic flow of an athermal amorphous material reveals a mesoscopic structure of the strain since the early stage of the loading process: deformation concentrates in transient short micro-bands of well-defined orientation. We connect those orientations with the elastic long-range stress redistribution due to localized plastic reorganizations. We show an increasing characteristic length and persistence during the loading. However, the relationship between these transient micro-bands and the final permanent frictional shear bands is more complex than the description of a final persistent shear-band formation as a mere growing cascade of local rearrangements. The final shear band does not arise from a coalescence of micro-bands, nor is it initiated by a single micro-band that reaches the boundary and becomes locked. Instead, as the movie in supplemental material movie shows, the two types of deformation, oriented in two different directions, coexist near failure. We observe a hierarchical structure with a mesoscopic pattern embedded in large scale shear band. The modelization of the final persistent shear-band needs to describe the complex interaction between the micro-bands and the larger scale localization. The careful characterization of the birth of the permanent shear band is a work-in-progress.
This work has been supported by ANR (No.2010-BLAN-0927-01) and Région Bretagne (MideMade). We thanks P. Chasle, H. Orain, J.-C. Sangleboeuf, P. Bésuelle and C. Viggiani for help with the biaxial apparatus, and GDR Mephy for fruitful discussions.
References
- (1) J. Goyon et al., Nature 454, 84–87 (2008).
- (2) R. Besseling et al., Phys. Rev. Lett. 105 268301 (2010).
- (3) A. Kabla, J. Scheibert, & G. Debregeas, Jour. of Fluid Mech. 587 45 (2007).
- (4) A. Tanguy, F. Leonforte, & J.-L. Barrat, Eur. Phys. J. E 20, 355-364 (2006).
- (5) P. Sollich et al., Phys. Rev. Lett. 78, 2020–2023 (1997).
- (6) C. Derec, A. Ajdari, & F. Lequeux, Eur. Phys. J. E 4, 355-361 (2001).
- (7) G. Katgert et al., Europhys. Lett. 90, 54002 (2010).
- (8) V. B. Nguyen et al., Phys. Rev. Lett. 107, 138303 (2011).
- (9) P. Schall, D. A. Weitz, & F. Spaepen, Science 318, 1895 (2007).
- (10) A. Amon et al., Phys. Rev. Lett. 108, 135502 (2012).
- (11) M. L. Falk, & J. S. Langer, Phys. Rev. E 57, 7192–7205 (1998).
- (12) C. E. Maloney, & A. Lemaître, Phys. Rev. E 74, 016118 (2006).
- (13) K. A. Dahmen, Y. Ben-Zion, & J. T. Uhl, Nature Physics 7, 554 (2011).
- (14) M. Tsamados et al., Eur. Phys. J. E 26, 283 (2008).
- (15) S. M. Talamali et al., Comptes Rendus Mécanique 340, 275 (2011).
- (16) K. Martens, L. Bocquet, & J.-L. Barrat, Soft Matter 8, 4197 (2012).
- (17) R. Dasgupta et al., Phys. Rev. Lett. 109 255502 (2012).
- (18) J. D. Eshelby, Proc. R. Soc. Lond. A 241, 376-396 (1957).
- (19) A. Le Bouil et al., Granular Matter 16, 1-8 (2014).
- (20) M. Erpelding, A. Amon, & J. Crassous, Phys. Rev. E 78, 046104 (2008).
- (21) Supplemental Material: movie.avi represents the successive maps of incremental deformation during the loading shown in Fig. 2(a). The value of the imposed strain is indicated in percent. The colorscale is the same as Fig. 1(b).
- (22) Critical State Soil Mechanics, A. N. Schofield, & C. P. Wroth (McGraw-Hill, 1968)
- (23) Statics and Kinematics of Granular Materials, R. M. Nedderman (Cambridge University Press, 1992).
- (24) H. A. Makse et al., Phys. Rev. E 70, 061302 (2004).
- (25) F. Gimbert, D. Amitrano, & J. Weiss, EPL 104 46001 (2013).
- (26) K. Kamrin, & G. Koval, Phys. Rev. Lett. 108 178301 (2012).
- (27) M. R. Kuhn, Mechanics of Materials 31, 407 (1999).
- (28) S. A. Hall et al., Granular Matter 12 1 (2010).
- (29) L. Bocquet, A. Colin & A. Adjari, Phys. Rev. Lett. 103 036001 (2009).
- (30) The cooperativity length is kamrin2013 : , with . We define here from the Mohr-Coulomb analysis: with , and the value of at failure.
- (31) D.L. Henann & K.Kamrin, PNAS 110 6730 (2013).