Relation between cuprate superconductivity and magnetism:
A Raman study of (CaLa)(BaLa)2Cu3Oy
Abstract
We present an investigation of charge-compensated antiferromagnetic (CaxLa1-x)(Ba1.75-xLa0.25+x)Cu3Oy single crystals using Raman scattering as well as muon spin rotation. In this system the parameter controls the Cu-O-Cu superexchange interaction via bond distances and buckling angles. The oxygen content controls the charge doping. In the absence of doping the two-magnon peak position is directly proportional to the superexchange strength . We find that both and affect the peak position considerably. The Néel temperature determined from muon spin rotation on the same samples independently confirms the strong dependence of the magnetic interaction on and . We find a considerable increase in the maximum superconducting transition temperature with . This is strong evidence of the importance of orbital overlap to superconductivity in this family of cuprates.
- PACS numbers
-
74.20.-z, 74.25.Ha, 74.72.Cj
pacs:
74.20.-z, 74.25.Ha, 74.72.CjI Introduction
The complexity of high-temperature superconductors (HTSC), with several parameters controlling their properties, hinders progress in uncovering their superconducting mechanism. It is extremely difficult to isolate and control only one parameter at a time. To overcome the experimental challenge in the study of HTSC, we prepare and investigate single crystalline samples of the (CaxLa1-x)(Ba1.75-xLa0.25+x)Cu3Oy (CLBLCO) system, with , , and . This system is isostructural to YBa2Cu3O7-y (YBCO) and supplies us with two tuning parameters: the amount of oxygen and the ratio of calcium to barium set by . Each defines a superconducting family. Calcium and barium have the same valence, and their total amount in the chemical formula is constant. Therefore, does not serve as a formal dopant. However, tunes the Cu-O-Cu bond distances and buckling angles, leading to variations in the overlap of orbitals. Rinat08 This property of CLBLCO opens a window to investigate the relation between and the physical parameters that are determined by orbital overlap.
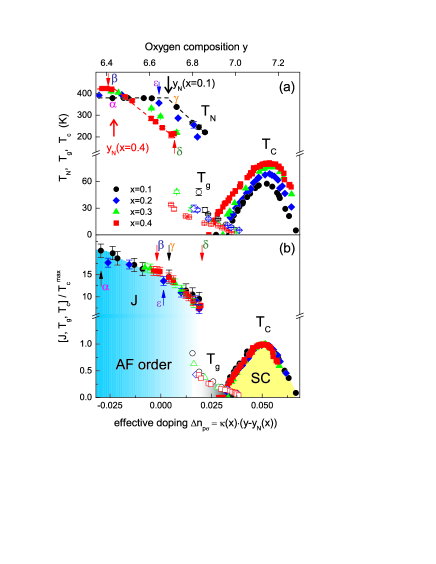
Phase diagrams of CLBLCO with different are shown in Fig. 1(a). They summarize muon spin rotation (SR) Kanigel02 ; Rinat06 and transport Yaki99 experiments performed on powder samples. It can be seen that the transition temperatures to the antiferromagnetic, spin-glass, and superconducting phases (, , and , respectively) are strongly dependent. In particular, the superconducting transition temperature of the optimally doped samples increases by more than 30% from the family to the family. However, high-resolution powder x-ray diffraction Xray and NMR experiments KerenNJP09 indicate that samples are more ordered than ones. Therefore, disorder can not be responsible for the reduction of as decreases; there has to be a more fundamental reason for these variations of .
Figure 1(b) depicts a re-scaled phase diagram for CLBLCO. We obtain this unified diagram by replacing with the superexchange strength , normalizing the temperature scales by , Rinat06 and transforming the oxygen composition parameter according to . Eran10 The scaling parameter translates to the doping efficiency with which holes are introduced in the CuO2 planes and was determined via measurements of the 17O nuclear quadrupole resonance parameter . Eran10 is the oxygen composition where starts to decrease, as shown in Fig. 1(b), and stands for the effective hole variation on the oxygen orbital. The unified phase diagram suggests a similar origin for the magnetic and superconducting phase transitions. The superexchange is determined by orbital overlap and is closely related to the hopping rate . While is well-defined for only the parent compounds, hopping exists even in the doped system. A close relation between and would therefore imply that superconductivity in this family of cuprates is dominantly driven by kinetic energy. molegraaf
However, the values for were determined by SR. This method requires measurements over a wide range of temperatures in which could change due to lattice expansion. Furthermore, the theory that extracts from the data is rather involved and can only fit the data to a certain extent. Rinat06 The work presented here overcomes these challenges by using two-magnon Raman scattering experiments. This technique determines directly by measuring the shift in photon energy between incoming and outgoing light due to a spin-flip process of two adjacent spins. Our measurements of the Raman shift as a function of both and reveal a strong correlation between and in CLBLCO.
II Experimental details
Several single crystals of (CaxLa1-x)(Ba1.75-xLa0.25+x)Cu3Oy with varying for both the and families, as well as one single crystal of the family, were successfully grown in a floating zone furnace. Crystal In order to control the amount of oxygen in the samples we followed the procedure known for powder samples of this material. Yaki99 The oxygen composition of the samples has been determined by iodometric titration. Crystal
For the Raman measurements the crystals were cleaved to obtain a shiny, flat, virgin surface. The cleaving produces facets which are perpendicular to the axis. Therefore, the light scatters with its polarization within the plane for all measurements. Polarized Raman spectra were obtained using a Jobin-Yvon micro-Raman spectrometer (LabRAM HR) in backscattering geometry with a nm solid-state Nd:YAG laser, a 50 magnification objective, and a diffraction grating with 1800 grooves/mm. The detection was done with a nitrogen-cooled CCD (Horiba Spectrum One). To prevent damage to the sample from overheating the laser power at the sample was kept below 1 mW.
III Experimental Results and Discussion
The CLBLCO system crystallizes in a simple tetragonal structure (space group ). Five Raman-active phonon modes are expected from backscattering within the plane. Four of these phonon modes are of symmetry, where the scattered light has the same polarization as the incident light. Crystal One phonon mode has a symmetry, where the polarization of the scattered light is perpendicular to the incident light polarization and the phonon intensity reaches a maximum when both and are at from the and axes. This intensity dependence allows for an easy orientation of the crystallographic plane.
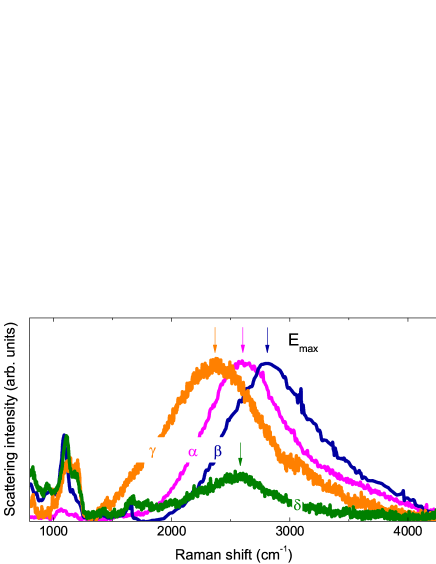
In Fig. 2 we depict raw two-magnon Raman scattering data for four samples marked , , , . The position of these samples in the phase diagram is indicated in Figs. 1(a) and 1(b). Samples and are part of the family, while samples and belong to the family. In the unified phase diagram [Fig. 1(b)], it can be seen that samples and are comparable with respect to doping at , while sample is in the highly underdoped region and sample is on the verge of the spin-glass phase.
The data in Fig. 2 are taken at K, deep in the magnetically ordered phase. Peaks with energies below 1500 cm-1 are due to phonon and multiphonon scattering. The arrows in Fig. 2 indicate the peaks’ respective maxima. A clear shift in the two-magnon peak energy is observed for the different samples. For both families the peak shifts to lower energies as increases, in accordance with a previous Raman study. Sugai As approaches the spin-glass phase, the two-magnon Raman signal dramatically decreases in intensity and vanishes in the spin-glass phase. At equal , the sample has a higher two-magnon mode energy than the sample. The principle observation is that samples and , with the same effective doping but varying , exhibit a huge difference in the two-magnon energy, with having the largest energy.
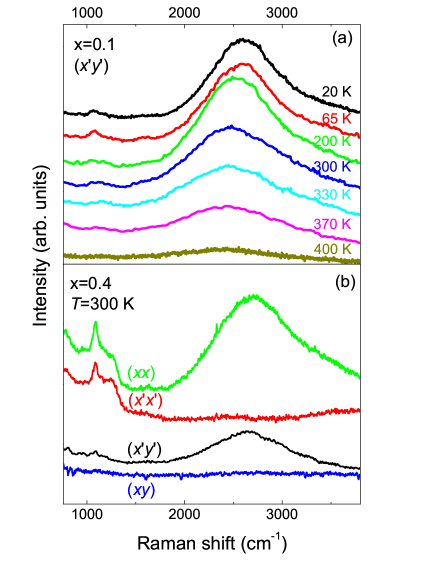
In order to verify that the broad peak around 2500 cm-1 is indeed related to a two-magnon scattering process we measure its intensity as a function of temperature. The results for , are shown in Fig. 3(a). It is evident that the intensity of the peak drops above K. However, some remaining intensity of the two-magnon scattering is observed even at 400 K due to its local scattering nature. Moreover, as the temperature increases, the peak shifts to lower energies, revealing the temperature dependence of . At there is a high probability that neighbors of the spin-flipping pair are excited. This will reduce the energy cost in the flipping process. TDepRaman
Figure 3(b) shows the Raman spectra at four different polarizations. Here, we use the following notations: () and axis, () and axis, () axis, and () axis. It is found that the broad peak appears only in the configuration, i.e., in () and () polarization, as expected from two-magnon Raman scattering in a square lattice. Fleury ; Freitas
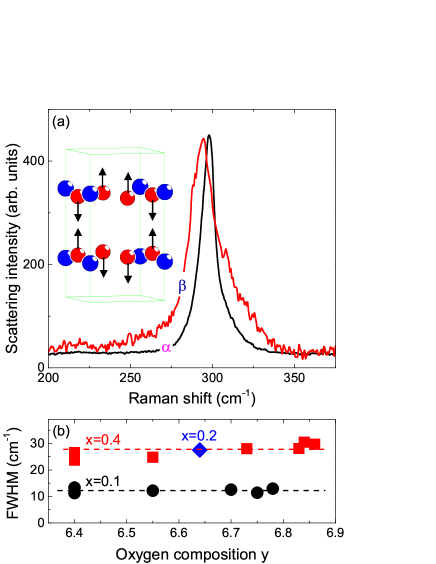
In Fig. 4(a) we plot the low-energy part of the Raman spectra for samples and , focusing on the phonon mode. The atomic displacement for this mode corresponds to an out-of-plane motion of oxygen ions in the CuO2 plane at 300 cm-1. This motion is sketched in the inset of Fig. 4(a). We note two important observations regarding the phonons: () the sample has a slightly higher phonon frequency, and () the family with has a smaller line-width than or , which is also indicated. Both trends are independent of doping. In particular, the dependence of the line-width can be seen in Fig. 4(b).
Observation () supports the notion that the 300 cm-1 phonon does not play a dominating role in the superconducting mechanism for CLBLCO since a higher phonon frequency should lead to a higher . The respective line-width is a measure of the crystal quality and the electron-phonon coupling strength. It is inversely proportional to the phonon life time. Thus, observation () suggests that as decreases, the coherence does not change or even increases. This is in agreement with the x-ray diffraction and NMR measurements of CLBLCO and reinforces the conclusion that the crystal quality is not responsible for the variation in .
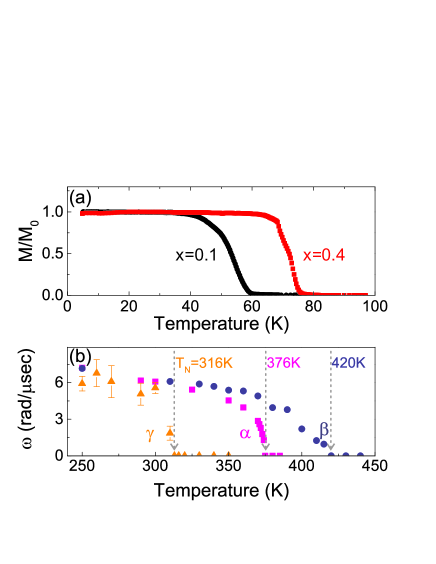
Two of the samples that were used in the Raman measurements were subsequently oxygenated close to optimum doping at . Their magnetization curves, obtained from a superconducting quantum interference device (SQUID) magnetometer, are shown in Fig. 5(a). A clear transition from the normal state to the superconducting state can be seen, with of the sample being much higher than that of the sample. As single crystals that are oxygenated to the exact optimum doping are difficult to achieve, we will use the values for obtained from the phase diagram in Fig. 1(a) in the following.
Since the oxygenation of crystals is slow and Raman scattering is surface sensitive, it is also important to check the antiferromagnetic part of the phase diagram. Thus, we determine for the samples that participated in the Raman experiments using zero-field SR. In these experiments we follow the angular rotation frequency of the spin of a muon implanted in the sample as a function of temperature. The measurements were performed at the General Purpose Surface-Muon Instrument at the Paul Scherrer Institute (PSI). In Fig. 5(b) we depict the temperature-dependent muon rotation frequency for samples , , and . The Néel temperature is defined as the point where upon warming. We find that the Néel temperatures of the crystals agree with the phase diagram in Fig. 1(a). In particular, as the oxygen composition increases (samples and ), decreases. At constant (samples and ) increases with . Most importantly, at constant effective doping (samples and ) increases from 376 K at to 420 K at .
The mechanism for a two-magnon Raman scattering process in an undoped sample corresponds to a simultaneous exchange of two neighboring spins, induced by the incoming photons. As a result, the magnetic coupling of the exchanged spins to their neighboring spins will be broken, and photons with reduced energy will be emitted. Hence, the photon energy shift is related to . A simple broken-bond counting argument for spin on a two-dimensional square lattice indicates that the Raman shift peaks at . A more detailed calculation indicates that the exact factor between the Raman peak and ranges from , Weber via , Chubukov to . Canali For the purpose of the work presented here it is sufficient to assume that the ratio between the Raman shift and is close to 3 and constant for all CLBLCO compounds. In a doped sample the number of broken bonds in the scattering process is smaller, and is expected to decrease with doping.
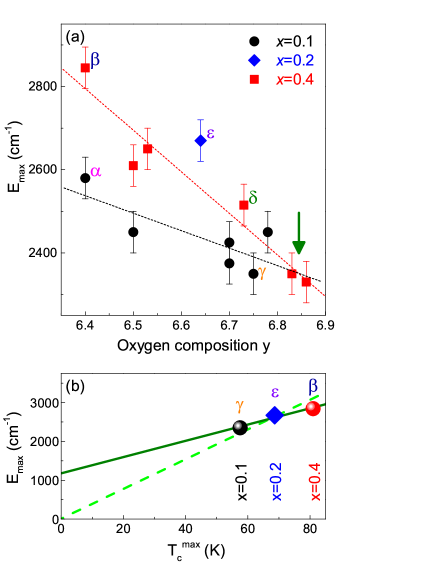
In Fig. 6(a) we compare the Raman shift as a function of oxygen composition for the two families. The data points corresponding to samples – are marked accordingly. Sample of the family is also indicated. For low values, the samples have higher two-magnon mode energies than the samples. This result indicates that is larger for the family with higher . In both cases a clear and steady decrease is observed as a function of . Around there is a crossing point that suggests that for becomes smaller than that for . The same trend can be seen for in the phase diagram in Fig. 1(a), but the crossing is taking place at a different . Here we note that the two-magnon mode energy and are not directly related; however, a similar trend is to be expected. The fact that shows a different doping dependence for the two families is another indication that the efficiency of doping holes in the CuO2 planes is not the same for the two families. The strong doping dependence of and the crossing point shown in Fig. 6 emphasize the importance of comparing samples with the same effective doping .
Figure 6(b) summarizes the main finding of this work. In this figure we plot the Raman shift obtained at K for the family (black), the family (blue), and the family (red) at versus obtained from the phase diagram in Fig. 1(a). The solid line is a linear fit through the data. A dashed proportionality line through the origin is also shown. Although single crystals from only three families are available for this plot, there is clear evidence for a strong correlation between the magnetic exchange interaction , measured by two-magnon Raman scattering, and the superconducting temperature , which is close to proportionality.
In a recent Raman study on (Ba,Sr)2Cu3Oy [=(La, … Lu,Y)], it was found that anticorrelates with set by internal pressure, and correlates with induced by external pressure. MallettCM12 The internal pressure experiment is in strong contrast to our findings. We believe that the impact of disorder on is at the heart of this contradiction. Clarifying this contradiction, which stems from the same experimental method, is essential for understanding the relevant mechanisms for cuprate superconductivity.
IV Summary
We report evidence for a strong correlation between the superconducting temperature and the magnetic exchange interaction in the cuprate system (CaxLa1-x)(Ba1.75-xLa0.25+x)Cu3Oy, confirmed by two independent, complementary techniques. The two-magnon Raman scattering technique measures directly but is limited to the antiferromagnetic phase and to single crystals. The analysis of the SR technique requires theoretical modeling to extract , but it is applicable from the antiferromagnetic phase through the spin-glass phase and up to the mixed spin-glass superconducting phase.
The exchange interaction is determined by overlaps of orbitals on neighboring sites. The larger the overlap is, the easier it is for holes to hop from site to site. Thus, in the family the overlap of orbitals is larger than in . This finding is supported by recent angle-resolved photoemission spectroscopy measurements. Drachuck13
Acknowledgements.
This work was supported by the German-Israeli Foundation (GIF, 1171-189.14/2011) and the joint German-Israeli DIP Project (YE 120/1-1 LE 315/25-1). The authors wish to thank the PSI staff for support with the μSR experiments and K. S. Kim for helpful discussions.References
- (1) R. Ofer, A. Keren, O. Chmaissem, and A. Amato, Phys. Rev. B 78, 140508(R) (2008).
- (2) A. Kanigel, A. Keren, Y. Eckstein, A. Knizhnik, J. S. Lord, and A. Amato, Phys. Rev. Lett. 88, 137003 (2002).
- (3) R. Ofer, G. Bazalitsky, A. Kanigel, A. Keren, A. Auerbach, J. S. Lord, and A. Amato, Phys. Rev. B 74, 220508(R) (2006).
- (4) A. Knizhnik, Y. Direktovich, G. M. Reisner, D. Goldschmidt, C. G. Kuper, and Y. Eckstein, Physica C 321, 199 (1999).
- (5) S. Agrestini, S. Sanna, K. Zheng, R. De Renzi, E. Pusceddu, G. Concas, N. L. Saini, A. Bianconi, Journ. Phys. Chem. Solids 75, 259 (2014).
- (6) A. Keren, New J. Phys. 11, 065006 (2009); T. Cvitanić, D. Pelc, M. Požek, E. Amit, and A. Keren, Phys. Rev. B 90, 054508 (2014).
- (7) E. Amit, A. Keren, Phys. Rev. B 82, 172509 (2010).
- (8) see, e.g., H. J. A. Molegraaf, C. Presura, D. van der Marel, P. H. Kes, M. Li, Science 295, 2239 (2002).
- (9) G. Drachuck, M. Shay, G. Bazalitsky, R. Ofer, Z. Salman, A. Amato, C. Niedermayer, D. Wulferding, P. Lemmens, A. Keren, J. Supercond. Nov. Magn. 25, 2331 (2012).
- (10) S. Sugai, H. Suzuki, Y. Takayanagi, T. Hosokawa, and N. Hayamizu, Phys. Rev. B 68, 184504 (2003).
- (11) M. Bloch, J. Appl. Phys. 34, 1151 (1963); S. R. Chinn, R. W. Davies, and H. J. Zeiger, Phys. Rev. B 4, 4017 (1971).
- (12) P. J. Freitas and R. R. P. Singh, Phys. Rev. B 62, 5525 (2000).
- (13) P. A. Fleury and R. Loudon, Phys. Rev. 166, 514 (1968).
- (14) W. H. Weber and G. W. Ford, Phys. Rev. B 40, 6890 (1989).
- (15) A. V. Chubukov and D. M. Frenkel, Phys. Rev. B 52, 9760 (1995).
- (16) C. M. Canali and S. M. Girvin, Phys. Rev. B 45, 7127 (1992).
- (17) B. P. P. Mallett, T. Wolf, E. Gilioli, F. Licci, G. V. M. Williams, A. B. Kaiser, N. W. Ashcroft, N. Suresh, and J. L. Tallon, Phys. Rev. Lett. 111, 237001 (2013).
- (18) Gil Drachuck, Elia Razzoli, Rinat Ofer, Galina Bazalitsky, R. S. Dhaka, Amit Kanigel, Ming Shi, and Amit Keren, Phys. Rev. B 89, 121119(R) (2014).