Spin-charge interplay in antiferromagnetic LSCO studied by the muons, neutrons, and ARPES techniques
Exploring whether a spin density wave (SDW) is responsible for the charge excitations gap in the high-temperature superconducting cuprates is difficult, since the region of the phase diagram where the magnetic properties are clearly exposed is different from the region where the band dispersion is visible. On the one hand, long range magnetic order disappears as doping approaches 2% from below, hindering our ability to perform elastic neutron scattering (ENS). On the other hand, cuprates become insulating at low temperature when the doping approaches 2% from above, thus restricting angle-resolved photoemission spectroscopy (ARPES). In fact, ARPES data for samples with doping lower than 3% are rare and missing the quasiparticle peaks in the energy distribution curves (EDCs) ShenPRB04 VallaJPCM12 . The main problem is the high resistivity of extremely underdoped samples, which is detrimental to ARPES due to charging effects. Nevertheless, the resistivity of La2-xSrxCuO4 [LSCO] as a function of temperature, at 2% doping, has a broad minimum around 100 K AndoPRL04 . This minimum opens a window for both experiments. By preparing a series of LSCO single crystals with 0.2-0.3% doping steps around 2%, we managed to find one to which both techniques apply. This allows us to explore the cross talk between the magnetic and electronic properties of the material.
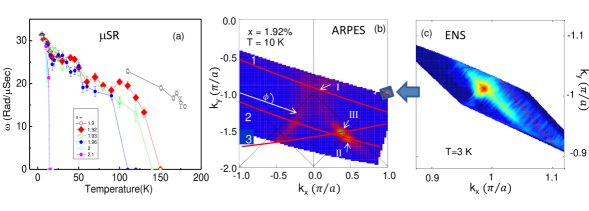
The series of samples are first characterized by muon spin rotation (SR). In Fig. 1a we show the muon spin rotation frequency as a function of temperature for all the crystals. In samples with doping equal to or less than 2%, the oscillation starts at temperatures on the order of 100 K. At 2%, there is a sharp transition from the antiferromagnetic long range order to the spin glass state where the same oscillations appear only at temperatures on the order of 10 K NeidermayerPRL98 . More details of the SR characterization of the samples are given below and in the supplementary material. We perform the ENS and ARPES measurements on a sample with % (red rhombuses) which is antiferromagnetic with a Néel temperature K. Fig. 1b shows the ARPES intensity map near the Fermi level () in the second Brillouin Zone (BZ), measured along cuts parallel to cut 1 and 2 shown in the figure. The high intensities represent the underlying Fermi surface (FS) and has the morphology of the FS in more doped LSCO RazzoliNJP and other cuprates. Most of the intensity is centered around the zone diagonal. This suggests the presence of gapped electronic excitations in the off-diagonal region. Similar results were obtained at a higher doping level of – Razzoli .
Figure 1c depicts ENS for the same sample at 3 K. The scans are performed in a narrow range in the reciprocal lattice space centered around the point, in the standard tetragonal ARPES units of . The scanned area of the ENS experiment is presented on the BZ of the ARPES experiment by the small inset in Fig. 1b. Two incommensurate peaks are present in the center of the figure. Such incommensurate peaks occur when, on top of the main magnetic order, the system develops spin modulations (stripes) running in diagonal to the bond directions (diagonal stripes). The stripes and commensurate scattering observed in our sample are in agreement with previous reports for low doping LSCO FujitaPRB02 ; MatsudaPRB2002 , and are discussed further below.
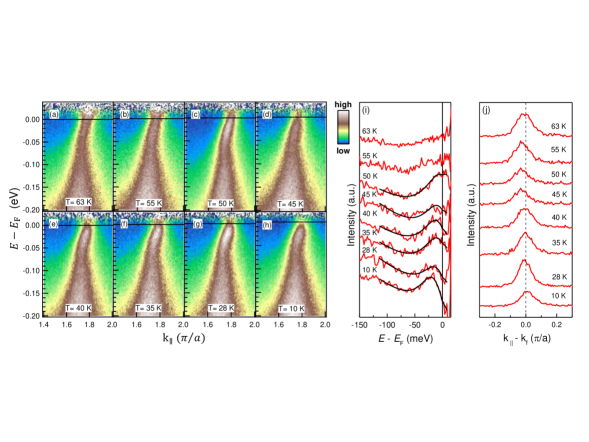
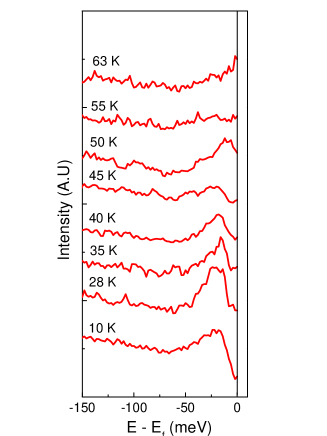
In Fig. 2a-h, we show the temperature dependence of ARPES data in the vicinity of point III along cut 3 in Fig. 1b. All spectra are divided by resolution broadened Fermi-Dirac distribution at the nominal temperature. Data analysis by the Lucy–Richardson deconvoltion method LRDeconvolution is discussed in the supplementary material. At high temperatures ( K), the dispersive peak crosses as clearly seen in Fig. 2a. In contrast, at low temperatures ( K) there is a gap in the electronic spectra, i.e. the peak position at stays below . A similar gap exists in LSCO up to 8% doping Razzoli , in LBCO at 4% VallaJPCM12 , in the electron doped compound HarterPRL12 , and in Bi2212 VishikPNAS12 , and also in simulations where inhomogeneous SDW and superconductivity coexist AtkinsonXXX . EDCs extracted from Fig. 2a-h, at given by point III of Fig. 1b, are plotted in Fig. 2i. The solid lines are guides to the eye. At temperatures above 45 K, the peak is at . However, below this temperature the peaks are clearly below , indicating the presence of a gap. Another important aspect of these EDCs is the fact that at all low temperatures, is not in the middle of the gap, namely, the intensity of the spectra immediately above is lower than at . This could be an analysis artifact due to the division by the resolution broadened Fermi-Dirac function RameauJESRP10 or indicate that the particle-hole symmetry is broken. Particle-hole asymmetry toward the diagonal region in the non-superconducting phase YangNature08 , and in the off-diagonal region HashimotoNatPhys10 , was found previously. However, it is very difficult to distinguish between the two options in our sample with extremely low carrier concentration.
Another parameter relevant for understanding the mechanism by which this diagonal gap opens is the temperature dependence of . This is explored by extracting the momentum dispersion curve (MDC) at from Fig. 2a-h, as presented in Fig. 2j. The peak position fluctuates somewhat around a constant value as the temperature is lowered, indicating that along the diagonal is temperature-independent. Therefore, the high intensity curves in Fig. 1b represents the FS.
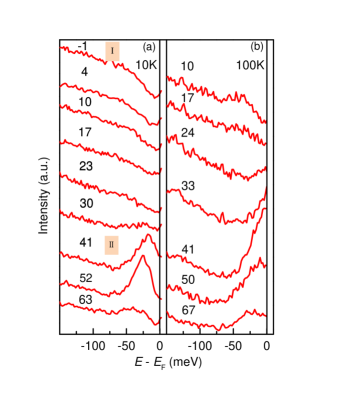
The evolution of the gap around the FS is shown in Fig. 3a-b for 10 and 100 K. The spectra marked I and II in Fig. 3a are EDCs at the of points I and II in Fig. 1b. The spectrum in between correspond to between point I and II. EDCs shown in Fig. 3b are from similar point along the FS. In the off-diagonal region, there is no spectral weight at for both temperatures, indicating that the off-diagonal gap opens at a temperature higher than 100 K. In the diagonal region, there is high spectral weight at 100 K, but not at 10 K. Thus at 100 K we observe a Fermi arc KanigelNatPhys06 , while at 10 K a gap appears all around the FS.
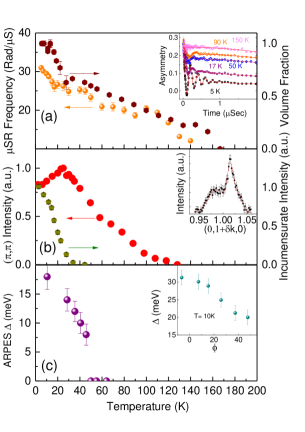
Finally, in Fig. 4 we present a summary of parameters extracted from all three techniques. Fig. 4a shows the temperature dependence of the muon rotation frequency and magnetic volume fraction. The inset represents a fit of a three-component model, with one frequency, to the SR data at different temperatures. More details are available in the supplementary material. The magnetic parameters grow upon cooling, saturate between and K, and grow again at lower temperatures. The temperature K was associated with hole freezing into one dimensional domain walls NeidermayerPRL98 ; ChargeFreezing . The restriction of the charge motion below must be intimately related to the opening of the nodal gap.
Fig. 4b shows the commensurate and the incommensurate scattering intensity. The inset shows the raw data along the red diagonal line in Fig. 1c (in orthorhombic units). As the temperature is raised, the incommensurate intensity decreases until it disappears at K. The commensurate intensity peaks at , just when the muon oscillation change its behavior, and vanishes at K. Our ENS temperature dependence results and incommensurability parameter (in tetragonal units) are in good agreement with previously reported data MatsudaPRB2002 . While the ENS data is well understood in terms of a spiral ground state LuscherPRL07 , its relation to the gap is still mysterious, since the nesting condition is not fulfilled in our sample.
The diagonal gaps at , , are determined from the peak in the EDCs of Fig. 2i and presented in Fig. 4c as a function of temperature. Very similar gap values are found using the Lucy–Richardson de-convolutions method (see supplementary material) LRDeconvolution . The gap opens at K. The major observations in this figure are: I) the diagonal gap opens only when the commensurate moment is nearly at its full value. II) the diagonal gap opens when the incommensurate moment is not detectable by ENS. The angular dependence of the gaps is presented in the inset of Fig. 4c; the angle is defined in Fig. 1b,. When a peak is absent, the gap is taken from the change of slope in the EDCs. is in agreement with previous measurements for 3 to 8% dopings Razzoli .
On the basis of weak coupling theory, Berg et al. BergPRL08 argued that the commensurate part of the SDW can open a diagonal gap only if the moment is larger than a critical value. However, the opening of the gap will be accompanied by a shift in . The effect of the incommensurate part of the SDW depends on the properties of time reversal followed by translation symmetry, which can be broken or unbroken. In the unbroken case a nodal gap will open when the perturbation exceeds a critical value. Both these options do not agree with our data. In the broken symmetry case, a nodal gap can open for arbitrarily small perturbation with no impact on . This option is in agrement with our measurements and bares important information on the symmetries of the ground state. Another possibility is that the gap is of the superconducting type, which maintains particle-hole symmetry and keeps fixed. This option would mean that the cuprates have a superconducting gap in the AFM phase.
To summarize, we detect a nodal gap in the AFM phase of La2-xSrxCuO4. The gap opens well below and a bit above the temperature where incommensurate SDW is detected. This finding puts strong restrictions on the origin of the nodal gap.
I Supplementary Material
I.1 SR
The experiment was carried out at PSI on the GPS beam line. We fit the muon polarization as a function of time to
where is the muon rotation angular frequency, stands for the magnetic volume fraction, is the amplitude of the rotating signal resulting from the angle between the muon spin and the internal field, and are relaxation rates, and are stretching exponents, and is the background polarization from muon that missed the sample. We could fit the data well with and for most of the temperatures. Between K to 50 K we allowed freedom in their values to achieve an optimal fit.
I.2 ARPES
The experiment was done in PSI using conditions similar to those in Ref. ShiPRL08 . Charging tests have been carried out by varying the photon flux. No charging was found. In addition, after performing the high temperature measurements, the sample was cooled again and the results at 10 K were reproducible. We examined the surface with LEED at each temperature and no degeneration or reconstruction was found during the measurements.
It should be pointed out that in ARPES the incoming light warms the surface and there could be a few degrees difference between the temperature of the surface from which electrons are ejected and the temperature of the cold figure which we quote in the paper.
EDCs obtained by LRM are depicted in Fig. 5.
I.3 Neutron diffraction
The neutron diffraction experiments was carried out at Paul Scherrer Institute (SINQ, PSI). The crystal was mounted on an aluminium sample holder with the perpendicular to the neutron beam; scattering plane. The collimation was 80’-40’-80’. Beryllium filter was placed before the analyzer to remove higher order neutrons. The instrument has a nine-blade pyrolytic graphite (PG) analyzers. The diffraction studies were performed with 4.04A (5 meV) neutrons, using all blades to create a 2D color plot. The sample was aligned in such a manner that the area of interest (commensurate and incommensurate magnetism) was measured in the center blade. The incommensurate part was measured in a scan direction. The high temperature data was subtracted to remove the contribution form the structural Bragg peak. For the commensurate part, the measurement was performed with a scan direction to avoid the incommensurate contribution.
II Acknowledgements
The Technion team was supported by the Israeli Science Foundation (ISF) and the joint German-Israeli DIP project. E.R. was partially supported by the Fonds National Suisse pour la Recherche Scientifique through Div. II and the Swiss National Center of Competence in Research MaNEP. We thank the SLS, SS and SINQ beam line staff at the Paul Scherrer Institute for their excellent support.
References
- (1) K. M. Shen et al., Phys. Rev. B 69, 054503 (2004).
- (2) T. Valla, Physica C 481, 66 (2012).
- (3) Y. Ando, S. Komiya, K. Segawa, S. Ono, and Y. Kurita, Phys. Rev. Lett. 93, 267001 (2004).
- (4) F. C. Chou, F. Borsa, J. H. Cho, D. C. Johnston, A. Lascialfari, D. R. Torgeson, and J. Ziolo, Phys. Rev. Lett. 71, 2323 (1993); Ch. Niedermayer, C. Bernhard, T. Blasius, A. Golnik, A. Moodenbaugh, and J. I. Budnick, Phys. Rev. Lett. 80, 3843 (1998).
- (5) E. Razzoli et al., New J. Phys. 12, 125003 (2010).
- (6) E. Razzoli, G. Drachuck, A. Keren. M. Radovich, N. C. Plumb, J. Chang, Y.-B. Huang, H. Ding, J. Mesot, and M. Shi, Phys. Rev. Lett. 110, 047004 (2013).
- (7) M. Fujita, K. Yamada, H. Hiraka, P. M. Gehring, S. H. Lee, S. Wakimoto and G. Shirane, Phys. Rev. B 65, 064505 (2002).
- (8) Matsuda, M. et al., Phys. Rev. B 65, 134515 (2002).
- (9) J. Rameau, H.-B. Yang, and P. Johnson, J. Electron. Spectrosc. Relat. Phenom. 181, 35 (2010).
- (10) John. W. Harter, Luigi Maritato, Daniel E. Shai, Eric J. Monkman, Yuefeng Nie, Darrell G. Schlom, and Kyle M. Shen, Phys. Rev. Lett 109, 267001 (2012).
- (11) Vishik et al., PNAS 109 18332 (2012).
- (12) W. A. Atkinson J. D. Bazak, and B. M. Andersen Phys. Rev. Lett. 109, 267004 (2012).
- (13) J. D. Rameau, H.-B. Yang, and P. D. Johnson, J. Electron. Spectrosc. Relat. Phenom. 181, 35 (2010).
- (14) H.-B. Yang, J. D. Rameau, P. D. Johnson, T. Valla, A. Tsvelik and G. D. Gu, Nature 456, 77 (2008).
- (15) M. Hashimoto et al., Nature Physics 6, 414 (2010).
- (16) A. Kanigel et al. Nature Physics 2, 447 (2006).
- (17) R. J. Gooding, N. M. Salem, and A. Mailhot, Phys. Rev. B 49, 6067 (1994); F. Borsa, P. Carreta, J. H. Cho, F. C. Chou, Q. Hu, D. C. Johnston, A. Lascialfari, R. J. Gooding, N. M. Salem, and K. J. E. Vos, Phys. Rev. B 52, 7334 (1995).
- (18) Andreas Lüscher, Alexander I. Milstein, and Oleg P. Sushkov, Phys. Rev. Lett. 98, 037001 (2007).
- (19) E. Berg C-C Chen, and S. A. Kivelson, Phys. Rev. Lett. 100, 027003 (2008).
- (20) M. Shi, J. Chang, S. Pailhés, M. R. Norman, J. C. Campuzano, M. Månsson, T. Claesson, O. Tjernberg, A. Bendounan, L. Patthey, N. Momono, M. Oda, M. Ido, C. Mudry, and J. Mesot Phys. Rev. Lett. 101, 047002 (2008).