Nonlinear conductivity in CaRuO3 thin films measured by short current pulses
Abstract
Metals near quantum critical points have been predicted to display universal out-of equilibrium behavior in the steady current-carrying state. We have studied the non-linear conductivity of high-quality CaRuO3 thin films with residual resistivity ratio up to 57 using micro-second short, high-field current pulses at low temperatures. Even for the shortest pulses of 5 µs, Joule heating persists, making it impossible to observe a possible universal non-linearity. Much shorter pulses are needed for the investigation of universal non-linear conductivity.
1 Introduction
A quantum critical point (QCP) arises when the critical temperature of a phase transition is suppressed to by means of an external control parameter such as pressure, magnetic field or doping [1]. In contrast to a phase transition at finite temperature, which is driven by thermal fluctuations, a quantum phase transition (QPT) is characterized by quantum fluctuations between the ordered and disordered state. Although the QCP at is experimentally not accessible, these quantum fluctuations drastically influence many physical properties even at finite temperatures. Examples include non-Fermi-liquid (NFL) behavior in resistivity or electronic specific heat [2] and divergences in the thermal [3] and magnetic [4] Grüneisen ratios. Quantum critical materials display thermodynamic equilibrium fluctuations completely controlled by temperature and a non-thermal parameter, leading to universal energy over temperature scaling in wide regions of phase space. Importantly, it has been suggested that universality may extend also to out-of-equilibrium dynamics in driven quantum critical states beyond linear response [5]. In particular it has been proposed that transport properties of quantum critical metals can be understood using an effective temperature induced by the current and non-linear electrical resistivity is determined by universal exponents of the underlying QCP [6]. Experimental observation of universal non-linear non-equilibrium behavior far from thermal equilibrium would be also of general importance for understanding of energy conversion processes.
Hogan and Green [6] have considered the steady-state nonlinear conductivity of a quantum critical metal at large electric fields. It is expected when the energy gained by an electron from the electric field between scattering events exceeds the temperature. Above a critical field , with the temperature and the electronic transport mean free path , they found a universal relation between current density and electric field , given by
Here denotes the dynamical critical exponent which equals 3 for ferromagnetic and 2 for antiferromagnetic quantum critical metals and the parameter is the temperature exponent of the electrical resistivity in thermal equilibrium, , experimentally often found between 1 and 1.5.
In order to minimize the critical field , low temperatures and clean samples, which are indicated by high residual resistivity ratio (RRR), are needed. In addition, a temperature rise by Joule heating increases the sample resistance and therefore trivially leads to a nonlinear --curve. This requires that the sample must be very well thermally coupled in order to transport the dissipated heat. We are not aware of any experimental studies on possible non-linear conductivity behavior in quantum critical metals. The need of high electric fields and a very good thermal coupling to the temperature bath requires the usage of thin film samples for which high surface-to-volume ratio ensures an efficient heat transport. Furthermore, a well-ordered stoichiometric material is need for the requirement of a large mean free path. There are only very few clean metals near QCPs and even much less can be prepared as thin films.
We attempt to meet these stringent requirements by choosing for our experiments thin films of the perovskite ruthenate CaRuO3. Studies on the series Sr1-xCaxRuO3 suggest that CaRuO3 is close to a ferromagnetic QCP [7, 8]. We have recently shown, that CaRuO3 displays a very fragile Fermi liquid ground state and extended temperature range in which the electrical resistivity follows a behavior [9]. Most importantly, very high-quality epitaxial unstrained thin films with resistivity ratio above 50, allowing the study of quantum oscillations, can be prepared by metal-organic aerosol deposition [9]. In order to reduce Joule heating we perform resistivity measurements with short pulses in the microsecond range.
Our paper is outlined as follows. In section 2 we will discuss sample preparation and characterization, examine the heat flows in our setup and describe the circuit used for producing the short current pulses. We show that the pulse shapes can be well analysed in order to extract the sample resistance. Then in section 3 we show the experimental results for the pulse length dependence of the electrical resistivity and the shape of the measured --curve. Finally we discuss our results and establish a relationship to the theoretical predictions made by Hogan and Green.
2 Experimental Details
| RRR | (mm) | w (µm) | (nm) | (nm) |
|---|---|---|---|---|
| 57 | 2 | 90 | 80 | 21.24 |
| 35 | 1.5 | 408 | 43 | 13.04 |
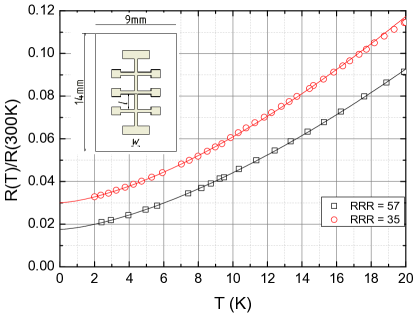
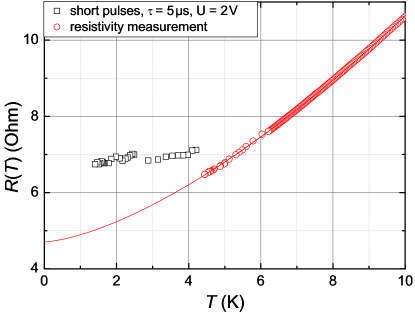
The CaRuO3 thin films are grown on vicinal NdGaO3 substrates by the metal-organic aerosol deposition (MAD) technique, which is described in [10, 11], and structured by argon ion etching. X-ray diffraction measurements prove the phase purity of our samples. For the subsequent investigation of the sample quality we performed resistivity measurements using a Physical Property Measurement System (PPMS) (see Fig. 1). Both studied samples display a dependence, similar as found in [9] for temperatures below 20 K, indicating NFL behavior in the electrical resistivity.
The pulsed current measurements were performed in a 4He evaporation cryostat. The samples (substrate and thin film) were mounted on a copper block located directly in the liquid helium bath. By pumping the bath, the temperature could be reduced from 4.2 K to K.
For the thermal transport between thin film and surrounding 4He bath, we make the optimistic assumption that the epitaxially grown film is well thermally coupled to the substrate, which can therefore act as a heat sink. Film and substrate then have a combined heat capacity which is coupled to the bath by a thermal conductance as shown in Fig. 2a.
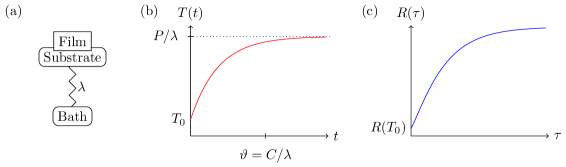
When an electric field is applied at and the bath temperature , the sample dissipates the power . Its temperature will increase as
which is solved by
with and the time constant . For large pulse lengths, a steady state temperature increase is reached. Since resistivity is a function of temperature, it will also increase with time, as illustrated in Fig. 2c.
At low temperatures, the specific heat of NdGaO3 is strongly enhanced by a Schottky contribution from the magnetic Nd3+ ground state due to crystal electric field splitting [12]. At 2 K, our 0.5 mm thick substrate has a heat capacity of approximately 15 µJ mm-2K-1. The Kapitza thermal boundary conductances between a metal and liquid 4He (film – bath) as well as between a metal and an insulator (substrate – copper block) are of the order of mW mm-2K-1 at the same temperature [13]. These values provide a rough estimate of the time constant ms. In order to minimize Joule heating, we aim to keep the pulse width small against .
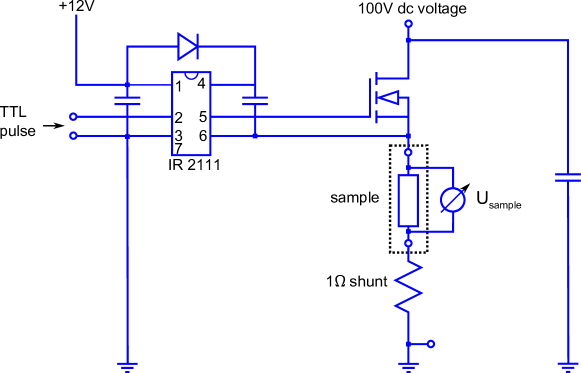
Short current pulses were realized by the circuit shown as inset in Fig. 3. An adjustable dc voltage source is connected to the sample via a fast field effect transistor. The current is measured through the voltage over a high precision shunt. A function generator drives the MOSFET gate with pulse length and a small duty cycle, i. e. the delay between consecutive pulses being much larger than . The voltages and are measured differentially with a 14 bit, 2.5 MS/s ADC card. Due to the connection in series, the current through the thin film is given by:
Pulse lengths of µs are possible with the used circuit elements. A more detailed circuit diagram is shown in the appendix.
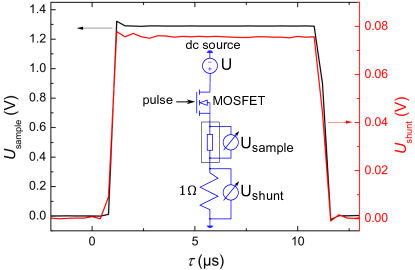
Figure 3 shows the measured voltages for a pulse length of µs. After switching the transistor, the voltage rises quickly to the final value for and and reaches a plateau, before dropping quickly to zero as the transistor is turned off. We analyze the measured waveforms and extract the height of the plateau, accounting for some over- and undershoot at the flanks of the pulse. By this method, we can determine the voltage and the current for the thin film during a single pulse.
3 Results
3.1 Pulse length dependence of the electrical resistivity
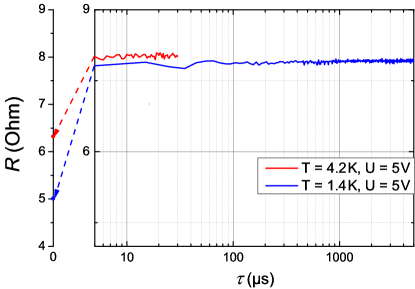
In order to investigate the pulse length dependence of the electrical resistivity, we vary the pulse length at a constant dc voltage and temperature . Figure 4 displays the dependency between resistance and pulse length for the CaRuO3 sample with RRR at 4.2 K and 1.4 K, respectively. At V, the electric field is still below the criticial field . The measured resistance is constant for all investigated pulse lengths. A shape as in Fig. 2c can not be observed. Arrows indicate the resistivity values determined from a conventional low-current measurement. As no heating occurs there, these values correspond to a vanishing pulse length . The difference to the expected value is and at K and K, respectively.
In Fig. 5, we show the temperature dependence of the electrical resistivity as determined from pulsed measurements with pulse length µs for the thinner sample. is only weakly temperature dependent. Comparison to the conventional, low-current resistivity measurement indicates an effective sample temperature of K of the CaRuO3 thin film. The sample temperature increases due to the pulse current. For the pulsed measurement the measuring current was mA, while for the conventional, low-current resistivity measurement the measuring current was µA. Although the measuring current for the pulsed measurement was larger than for the conventional one, it is still much smaller than for the universal region needed.
3.2 j-E-curve
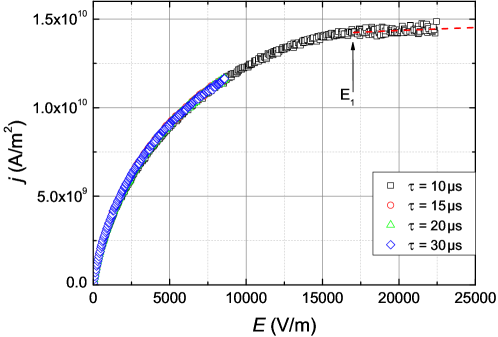
Figure 6 displays the measured --curve of the thin film with RRR at K using pulse lengths between µs and µs.
We observe a strong nonlinear behavior in the shape of the curve for all used pulse lengths.
Furthermore, the curve for µs coincides with all curves with larger pulse lengths.
Taking and , the above equations from Hogan and Green predict a universal behavior for fields above a critical field of V/m.
In contrast to this prediction we observe a very flat curve beyond with exponent close to zero, i.e. a much stronger nonlinearity in the conductivity than expected, which most likely is related to the Joule heating.
4 Discussion
In order to experimentally investigate possible universal nonlinear conductivity behavior for a quantum critical metal, we have performed short-pulse current measurements on high-quality thin films of CaRuO3 on NdGaO3 substrate immersed in liquid helium at low temperatures. Already at fields much below the threshold value for expected universal nonlinearity, we observe pronounces nonlinear behavior in --curves, independent of the pulse lengths for pulses as short as 5 µs. Furthermore, the observed non-linearity at is much stronger than predicted for the universal case. The pulse length dependence of the resistivity shows that joule heating is not yet reduced as the pulse duration is lowered towards 5 µs. We thus conclude that in our experiment, we can only observe the high- constant temperature regime indicated in Fig. 2c and Joule heating is responsible for the vast bulk of the observed nonlinear conductivity.
The assumption of the substrate acting as a perfect heat sink seems may be too simplistic in this case. Despite epitaxial growth and high substrate heat capacity, a finite thermal boundary resistance between film and substrate and the finite thermal conductivity of the substrate may hinder an efficient transport of the heat dissipated in the film.
Our results show that it is experimentally challenging to verify the predicted nonlinear conductivity. Pulses much shorter than µs are needed. However, in order to apply the formalism for steady-state non-equilibrium, the pulses must not get shorter than intrinsic time scales of the (slow) fluctuations within the quantum critical regime. Recent THz spectroscopy indicates that the frequency dependent real part of the resistivity approaches the dc resistivity below about 0.2 THz which corresponds to 5 ps [9]. Thus, short-pulse experiments on ns time scales may be able to approach the universal nonlinear regime.
Appendix
Figure 7 displays a more detailed version of the circuit used for producing short current pulses. By using an IR2111 gate driver to level-shift the pulse from the signal generator, the transistor can be located at the high side of the sample, which avoids large voltage swings at the measurement outputs to the ADC.
References
References
- [1] Sondhi S L, Girvin S M, Carini J P and Shahar D 1997 Rev. Mod. Phys. 69 315–333
- [2] Gegenwart P, Si Q and Steglich F 2008 Nature Physics 4 186–197
- [3] Küchler R, Oeschler N, Gegenwart P, Cichorek T, Neumaier K, Tegus O, Geibel C, Mydosh J A, Steglich F, Zhu L and Si Q 2003 Phys. Rev. Lett. 91 066405
- [4] Tokiwa Y, Radu T, Geibel C, Steglich F and Gegenwart P 2009 Phys. Rev. Lett. 102 066401
- [5] Dalidovich D and Phillips P 2004 Physical review letters 93 027004
- [6] Hogan P M and Green A G 2008 Phys. Rev. B 78 195104
- [7] Schneider M, Moshnyaga V and Gegenwart P 2010 physica status solidi (b) 247 577–579
- [8] Cao G, Korneta O, Chikara S, DeLong L and Schlottmann P 2008 Solid State Communications 148 305–309
- [9] Schneider M, Geiger D, Esser S, Pracht U, Stingl C, Tokiwa Y, Moshnyaga V, Sheikin I, Mravlje J, Scheffler M et al. 2013 arXiv preprint arXiv:1312.3809
- [10] Schneider M, Moshnyaga V and Gegenwart P 2010 Journal of Physics: Conference Series vol 200 p 012178
- [11] Moshnyaga V, Khoroshun I, Sidorenko A, Petrenko P, Weidinger A, Zeitler M, Rauschenbach B, Tidecks R and Samwer K 1999 Appl. Phys. Lett. 74 2842–2844
- [12] Schnelle W, Fischer R and E G 2001], pages=846–851 J. Phys. D: Appl. Phys. 34
- [13] Pobell F 2006 Matter and Methods at Low Temperatures (Springer)