Analyzing Cascading Failures in Smart Grids under Random and Targeted Attacks
Abstract
We model smart grids as complex interdependent networks, and study targeted attacks on smart grids for the first time. A smart grid consists of two networks: the power network and the communication network, interconnected by edges. Occurrence of failures (attacks) in one network triggers failures in the other network, and propagates in cascades across the networks. Such cascading failures can result in disintegration of either (or both) of the networks. Earlier works considered only random failures. In practical situations, an attacker is more likely to compromise nodes selectively.
We study cascading failures in smart grids, where an attacker selectively compromises the nodes with probabilities proportional to their degrees; high degree nodes are compromised with higher probability. We mathematically analyze the sizes of the giant components of the networks under targeted attacks, and compare the results with the corresponding sizes under random attacks. We show that networks disintegrate faster for targeted attacks compared to random attacks. A targeted attack on a small fraction of high degree nodes disintegrates one or both of the networks, whereas both the networks contain giant components for random attack on the same fraction of nodes.
Keywords: Complex networks, Percolation theory, Smart grids, Cascading failures, Random and targeted attacks.
I Introduction
Smart grids are next generation electricity grids, in which the power network and the communication network work in tandem. Power grids have suffered severe attacks in the past. The black out of Northern US/Canada and that of Italy in 2003 affected the lives of millions of people and resulted in huge monetary losses. More recently, the largest blackout in the world occurred in India in July 2012. The complete shutdown of the Northern, Eastern, and Northeastern power grids in the country affected over 620 million people. Such calamities could have been avoided, if the power grid functioned properly. In order to ensure that the electric grid functions smoothly, it is important that the control information is collected and transmitted in an orderly fashion, and the existing systems be highly automated. Smart grids promise to fulfill this vision by synchronizing the power network with the communication network. The idea is to replace the existing SCADA (Supervisory Control and Data Acquisition) system by an intelligent and automatic communication network.
The power network consists of power plants, generation and distribution stations, whereas the communication network consists of sensors attached to appliances to collect information, aggregator sensors to aggregate information and smart meters for monitoring and billing. The smart meters in home area networks, building area networks, and neighborhood area networks are responsible for aggregating, processing and transmitting data and control information for proper functioning of the smart grid. The question is how to make such a network robust and fault-tolerant. Researchers have addressed smart grid architectures [1] and the problem of cascading failures [4], in which a small fault propagates throughout the network and affects a large part of the network. Most of the current techniques and models use concepts from distributed systems. However, because of the large size of smart grids and their unique properties, new models, interconnection patterns, and analysis techniques are required to increase the robustness of networks.
Recently, Huang et al. [9] initiated the study of modeling and analyzing smart grids using interdependent complex networks. A smart grid can be thought of as two complex networks, which are interconnected. The question is how to make this network robust and fault tolerant. In order to provide a solution, we have to understand what kind of faults and attacks can take place and how faults propagate in the network. The failure of nodes in one network results in the disruption of the other network, which in turn affects the first network. This type of failure propagates in a cascading manner and was the main reason for the blackouts in the US and in India. To understand this cascading failure, we need to study the structure of the networks. In this paper, we model and study smart grids as complex networks and show the effect of cascading failure, when adversaries compromise nodes in the network.
Though cyber-security issues have been studied in details [17], modeling the network in order to make it resilient still needs lot of research. The main contribution of this paper is to study the effect of targeted attacks in smart grids, in which the attacker selectively disrupts communication nodes. To the best of our knowledge, this is the first work on targeted attacks on smart grids using complex network model. We argue that an adversary is more likely to attack selected high degree nodes, rather than attacking nodes randomly. As an example, we consider the recent Stuxnet worm [11] which was targeted on Siemens PCs and caused large-scale destruction to industrial control systems. Yagan et al. [20] studied cascading failures in cyber-physical systems. They studied different interdependent Erdos-Renyi (ER) networks [13], but they did not consider scale-free networks, which are used to represent power and communication networks. Till date, all works [9, 10, 20] on complex networks models of smart grid have considered only random attacks. Huang et al. [10] addressed the cost of maintaining such networks by analyzing the number of support links between networks. Whereas increasing the support links might make the interdependent networks stronger, large number of support links imply higher cost of maintenance. They suggested that smart grids should have some nodes which are connected to power nodes (also called operation centers) and the rest of the nodes are relaying nodes. Using such a model, they studied the resilience of the network under random attacks. According to their model, each control node is linked to power nodes and each power node is operated by operation centers.
I-A Problem statement and our contribution
We model the smart grid as a complex interdependent network consisting of two networks, the power network and the communication network. Both the power network and the communication network are scale-free (SF) networks, where the degree distribution follows the power law, , where is the fraction of nodes of degree and is the power-law parameter specific to the network. Support links are randomly assigned from one network to another, such that a power node is controlled by multiple communication nodes, and functions properly as long as at least one such link exists. In our model, we consider targeted attacks on the communication network. We mathematically analyze the effect of cascading failure for this type of attack and find out the sizes of giant components when nodes are compromised.
We compare the following attack models: random attacks, targeted attacks, and a combination of targeted and random attacks. We show that an adversary has a definite advantage if it compromises nodes selectively. In targeted attack, the adversary compromises a node with a probability proportional to the degree of the node. Our main conclusion is that by launching a targeted attack, an adversary can disrupt significant part of the network. For a large network, compromising about 2.2% of the network can disrupt either of the networks under targeted attack, whereas under random attack, the networks are still connected and work smoothly.
I-B Organization
The paper is organized as follows: Related works are presented in Section II. The network model, attack model, and preliminary material on complex networks is presented in Section III. Cascading failure is mathematically analyzed in Section IV. In Section V, we present experimental results to understand our model and make some conclusions. We conclude in Section VI with directions for future work.
II Related works
Smart grid communication and network architecture have been widely studied in [1, 18, 12]. Most smart grid literature concentrate on distribution of power [21], balancing supply and demand [15], detecting and predicting faults [4], designing network architecture which are fault tolerant [20]. The bulk of literature on fault tolerance address cyber-physical systems in general [20] and use general models and techniques of distributed systems.
Fault tolerance in power grids has been studied widely in the past. The study of the model, analysis of structure, increasing the robustness of power grids have been studied using complex networks. Here, electric distribution stations, transmission stations, generation centers are modeled as nodes. Two nodes are connected by a link, if there is power flow from one node to the other. The structure of the underlying graph has been widely studied, to find the effect of node failures. When certain nodes fail (or are attacked), the corresponding links are disrupted. This affects other nodes, whose links fail in return. Such failures propagate in a cascading manner throughout the network. Thus, a small fraction of nodes can disrupt a large part of the network. It has been shown that the graph structure underlying a power grid follows a power law distribution [13]. An extensive survey appears in [14].
Although, complex networks have been widely used to study different networks like social networks, biological networks, citation networks, power networks, etc [13], smart grid networks have not been widely studied. Huang et al. [9] introduced the study of smart grids using complex interdependent networks, in which the power network and the communication network are modeled as individual networks which have scale-free property. The links connecting nodes within a network are called intralinks. The networks are connected to each other via links (also called interlinks), such that a power node depends on communication nodes and vice versa. Such a network is called interdependent network.
Interdependent networks were introduced by Buldyrev et al. [2]. They studied the effect of failure cascades in such networks. The failure of a few nodes in the communication network will affect nodes in the power network, which will further affect nodes in the communication network. Thus, failures propagate in cascades till a steady state is reached or when either or both of the networks disintegrate. We say that a network disintegrates if there are no giant components in the network. A giant component is a connected component of size , where is the number of nodes in the network. Since then, a number of researchers have analyzed interdependent networks.
The initial study by Buldyrev et al. [2] studied the case where the two networks are of the same size, and there is a one-to-one correspondence between nodes which are joined by an interlink. Shao et al. [16] studied multiple support interlinks, where a node in the power network was connected to multiple nodes in the communication network and vice-versa. Most of the results have been analyzed experimentally, because closed-form analytical solutions are difficult to obtain. A special case of support links, where nodes having identical degree are connected across networks was studied in [3]. It has been observed in all these cases that interdependent systems make the network much more vulnerable to attacks, compared to a single network.
A well-known result in complex networks is that, randomly removing 95% of the nodes in the Internet (which is a scale-free network) can still result in a connected network. However, strategically removing even 2.5% of the nodes can disrupt the whole network [7]. Such a result motivates us to study the effect of targeted attacks on smart grids. In case of smart grids, an adversary is more likely to compromise nodes of strategic importance like hubs, than nodes of low degree. Thus, selective attacks give substantially different results compared to random attacks.
Targeted attacks on interdependent networks has been studied in [8]. They considered networks of the same size, each node in the power network being connected to an unique node in the communication network. The nodes are attacked such that a high degree node has higher probability of being attacked. They studied different networks like SF-SF or ER-ER and experimentally calculated the critical probabilities at which networks disintegrate They showed that targeted attack leads to faster disintegration than random attack. In other words, strategically compromising a few nodes results in the removal of the giant component, where as compromising even a large number of nodes randomly, does not result in the removal the giant component.
Instead of studying interdependent networks consisting of two networks, Dong et al. [6] studied targeted attacks on a network of networks. Zheng and Liu [19] proposed a solution for making a network robust against targeted attacks by suggesting a onion-like structure. Here high-degree nodes are present towards the center in clusters and low-degree nodes are present in concentric rings depending upon their degree. They analyzed results from power networks. Their technique is however restricted to single networks.
III Smart grid model
We will first discuss the network model and then the attack model.
III-A Network Model
We consider two interdependent scale free networks, a communication network and a power network , where and are the number of nodes in the communication and power networks, respectively, and and are the power-law coefficients. This implies that, has the power law distribution , which means that the fraction of nodes with degree is . Similarly, has the power law distribution . We assume that there are more communication nodes than power stations, which implies that .
The interlinks, also called support links [16] are directed edges from one network to the other. We assume that a communication link supports one power station and is powered by one power node, meaning that both the in-degree and out-degree of a communication node is one. A power node is controlled by multiple communication node and supplies power to multiple communication nodes, meaning the in-degree of a power node is greater or equal to one and there is no restriction on the out-degree of a power node. Links are assigned randomly from the communication network to the power network . Let denote the support degree of a node in Network . This implies that there are nodes in , that support a node in . Let denote the degree distribution of support links from to . can be defined analogously. From the structure of the network, is equal to one for all nodes in .
To calculate the degree distribution , we note that the problem of assigning support links from to is equivalent to assigning balls randomly into bins. If denotes the random variable that counts the number of balls in bin , then,
.
Thus, the degree distribution follows Binomial distribution with parameters .
III-B Attack Model
We consider targeted attack on communication network, in which the attacker attacks a node with probability proportional to the degree of the node. This implies that a high degree node is more prone to attack than a low degree node. Targeted attacks are more likely to arise in real-world situations, as we have seen during the recent Stuxnet attack. Attacking the high degree node is also intuitive, since disrupting the high degree nodes result in more connections being disrupted, thus disrupting the network.
III-C Giant Component
A giant component in a graph on vertices is a maximal connected component with at least vertices, for some constant . If , this means that the giant component should have at least half of the vertices in the graph. A vertex can be deleted from the graph in two ways.
-
1.
If the vertex is attacked.
-
2.
If the vertex is not attacked, but all its support links on the other network has been attacked.
Note that due to this kind of cascading failure of nodes, many more nodes will be compromised. This is different from the normal scenario, where only the attacked nodes are compromised.
III-D Notations
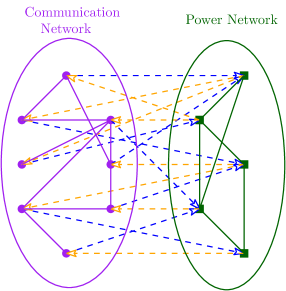
We have used the notations in Table I throughout the paper. Figure 1 shows smart grid as an interdependent network.
| Communication network | |
|---|---|
| Power network | |
| Number of nodes in and | |
| Degree of a node | |
| Degree distribution of communication network | |
| Degree distribution of power network | |
| Degree distribution of support degree of a node in | |
| Degree distribution of support degree of a node in | |
| Giant component of at stage | |
| Giant component of at stage | |
| Probability of a node having excess degree (i.e., total degree ) in | |
| Probability of a node having excess degree (i.e., total degree ) in | |
| Fraction of removed nodes in at stage , due to removal of nodes in at stage | |
| Fraction of removed nodes in at stage , due to removal of nodes in at stage | |
| Fraction of functional nodes in at stage | |
| Fraction of functional nodes in at stage |
IV Modeling cascading failure due to targeted attack on communication network
We first analyze the targeted attack on communication network and then show how the failure propagates across the interdependent networks in stages.
IV-A Targeted attack on the communication network
Let be the probability that a node of degree is not removed. In a targeted attack, the attacker removes a node with a probability proportional to the degree of the node. So, a high degree node is removed with higher probability. Note that,
Here is the degree of node and is the number of edges in . We note that represents random removal of nodes.
We will first calculate the size of the giant component . Let denote the average probability that a node is not connected to the giant cluster via one of its neighbors. Consider a node of degree . Probability that it is not connected to the giant component via any of its neighbors is .
Probability of it being in the giant component =
Probability that it is not attacked probability that one of its neighbors is in the giant component.
Thus, probability of it being in the giant component is . Averaging over the degree distribution , we can calculate the fraction of nodes in the initial giant component as
| (1) |
where,
| (2) |
We will now show how to calculate . A node is not connected to the giant component when either of the following cases arise.
-
•
The node is attacked and thus removed,
-
•
The node is present, but not connected to any node in the giant component.
Let be the excess degree of a neighboring node. The original degree of a node is one more than the excess degree, i.e., [13]. Probability that a neighbor is removed is . Probability that a neighbor is present, but the node itself is not present in the giant component is .
Hence using [13], can be calculated as,
| (3) |
where,
| (4) |
Note that , the probability of a node having excess degree in can be given by [13]. It can be seen that, . Substituting the value of , the value of can be calculated as,
| (5) |
where, is the average degree of nodes in . We observe that,
| (6) |
where is the generating function,
| (7) |
IV-B Stage II: Effect of cascading failure on power network
Due to the attack on communication nodes, the power network is affected. A node in the power network is functional, if a node in has at least one support link from . Initially, at stage II all nodes in are in the giant component. We consider all those nodes which are supported by nodes not in . Such nodes will not remain functional because they will be cut off from the communication network. Probability that a node is not in the giant component is . Suppose, a node is supported by nodes in . Probability that the neighboring nodes are not in is . Fraction of nodes in disconnected due to attack on is given by,
| (8) |
The fraction of nodes remaining in is given by . This is similar to the random removal of vertices. The fraction of nodes in the resulting giant component can be calculated by the technique in Appendix A as
| (9) |
where,
| (10) |
| (11) |
and
| (12) |
IV-C Stage III: Cascading failure in communication network
We will now study the effect of cascading failure in the communication network, due to the failure in power networks. Each node in is supported by only one link from the power network. If a node in fails, then the communication node it supports, also fails. The fraction of nodes in which fail due to failure of node in is given by,
| (13) |
We can consider that these nodes are randomly removed in and find the giant component resulting due to this removal of nodes. The fraction of nodes in the giant component which result from this random compromise is calculated as shown in Appendix A, as,
| (14) |
where,
| (15) |
| (16) |
and
| (17) |
.
IV-D Stage IV: Cascading failure in power network
We now calculate the number of nodes in the power network which are connected to nodes not in the giant component in the communication network. The fraction of nodes which are removed because they have all their support links from the nodes not in the giant component of , is given by,
| (18) |
The giant component can be calculated as in Appendix A.
IV-E Giant components and steady state conditions
We will now calculate the size of the giant component at steady state. Let, () be the fraction of nodes in that are removed due to the removal of nodes in at stage . For , the analysis is given in Section IV-A. Then,
| (19) |
Proceeding similarly as above, the general expression for nodes for the fraction of nodes in the giant component at the -th stage in the communication network is given by,
| (20) |
where,
| (21) |
| (22) |
and
| (23) |
Similarly, let, be the fraction of nodes in that are removed due to the removal of nodes in at stage . Then,
| (24) |
The fraction of nodes in the giant component of at stage is given by,
| (25) |
where,
| (26) |
| (27) |
and
| (28) |
.
We arrive at a steady state when,
| (29) | |||||
| (30) |
It is difficult to solve these systems of equations analytically. So, we generate the smart grid using different random graph models and simulate the effect of targeted and random attacks on these graphs. The results of this study is given in the next section.
V Experimental results
V-A Experimental Set-up
In order to simulate a smart grid, we use the network library igraph [5] on C. We consider two networks: the power network and the communication network, both of which are scale-free networks. For each communication node, an interlink is assigned by choosing a power node at random. We consider three types of attack on the communication network – targeted, random and mixed (combination of the first two). In the random attack, we choose nodes uniformly at random from all the nodes without replacement. In the targeted attack, we choose nodes without replacement, such that the probability of choosing a node is proportional to the degree. For mixed attacks, we select half of the nodes for targeted attack and half of the nodes for random attack. Finally, we study the effect of compromise by running the experiment 50 times for each input . Every time the same graphs are considered.
V-B Experimental results, observations and inferences
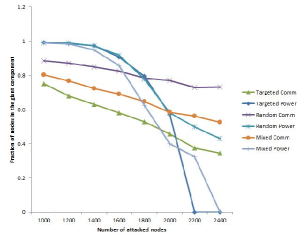
In Figure 2, the power network consists of 1,000 nodes and the communication network consists of 10,000 nodes. The communication/power network is generated as a scale-free network using a power-law degree distribution. We have plotted the size of the giant component (as a fraction of the size of the communication/power network) against the number of nodes attacked in the communication network. We observe that for a given value of the number of attacked nodes (only nodes in the communication network are attacked), the fraction of nodes in the giant component of the communication network is highest for random attacks and lowest for targeted attack. The corresponding fraction for mixed attacks lies somewhere in the middle. We also see that for the same fraction of nodes compromised, the giant component of the power network disintegrates faster for targeted attacks, compared to random attacks. We see that on compromising 2200 nodes, there is no giant component when targeted attack occurs, whereas giant component exists, under random attacks. This is expected, as attacking higher degree nodes result in a faster disintegration of the network, resulting in smaller components.
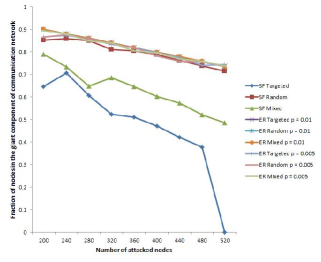
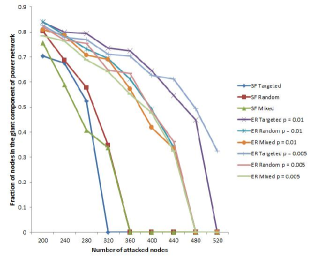
In Figures 3 and 4, the communication network consists of 2000 nodes, whereas the power network consists of 1000 nodes. In Figure 3, we have plotted the size of the giant component (as a fraction of the size of the communication network) against the number of attacked nodes. The communication network is generated using (i) a scale-free (SF) network using a power-law degree distribution, (ii) the Erdos-Renyi (ER) model with , and (iii) the Erdos-Renyi (ER) model with . Only nodes in the communication network are attacked. In Figure 4, we have plotted the size of the giant component (as a fraction of the size of the power network) against the number of attacked nodes. The power network is generated using the same models as mentioned above. From Figures 3 and 4 we see that, for all the three types of attacks, the sizes of the giant components for ER graphs are comparable. The power and communication networks will be more fault tolerant to targeted attacks for Erdos-Renyi networks, compared to scale free networks.
VI Conclusion and future work
We model the power and communication networks as two interdependent networks, and analyze cascading failure in smart grids for targeted attacks. To the best of our knowledge, this is the first work which addresses targeted attack on smart grids, which are modeled as interdependent networks. We have given a mathematical expression for the sizes of giant components when nodes are compromised. We have carried out experiments to show that a targeted attack gives an advantage to the adversary over random attacks.
A challenging open problem is to obtain a closed-form solution for the size of the giant component from the mathematical analysis that we have presented. Another important question is to present a good model of smart grids, which will be resilient to both random and targeted attacks. The structure of both the power and communication networks and the assignment of interlinks need to be studied. Thus, an important question is to find which network model and interconnection model will increase the resilience of the smart grid. In the future, the smart grid will be an internet of things, so a future direction of work is to propose a model, which will be resilient to attacks and can disseminate information rapidly in the network.
VII Acknowledgement
This work is partially supported by DRDO sponsored project Centre of Excellence in Cryptology (CoEC), under MOC ERIP/ER/1009002/M/01/1319/788/D (R&D) of ER&IPR, DRDO.
References
- [1] Anjan Bose. Smart transmission grid applications and their supporting infrastructure. IEEE Transactions on Smart Grids, 1(1):11–19, 2010.
- [2] Sergey V. Buldyrev, Roni Parshani, Gerald Paul, H. Eugene Stanley, and Shlomo Havlin. Catastrophic cascade of failures in interdependent networks. Nature, 464:1025–1028, 2010.
- [3] Sergey V. Buldyrev, Nathaniel W. Shere, and Gabriel A. Cwilich. Interdependent networks with identical degrees of mutually dependent nodes. Phys. Rev. E, 83:016112, Jan 2011.
- [4] Michael Chertkov, Feng Pan, and Mikhail G. Stepanov. Predicting failures in power grids: The case of static overloads. IEEE Trans. Smart Grid, 2(1):162–172, 2011.
- [5] Gabor Csardi and Tamas Nepusz. The igraph software package for complex network research (http://igraph.sourceforge.net/). InterJournal Complex Systems, 1695, 2006.
- [6] Gaogao Dong, Jianxi Gao, Ruijin Du, Lixin Tian, H. Eugene Stanley, and Shlomo Havlin. Robustness of network of networks under targeted attack. Phys. Rev. E, 87:052804, May 2013.
- [7] Richard Durrett. Random Graph Dynamics. Cambridge University Press, 2007.
- [8] Xuqing Huang, Jianxi Gao, Sergey V. Buldyrev, Shlomo Havlin, and H. Eugene Stanley. Robustness of interdependent networks under targeted attack. Phys. Rev. E, 83:065101, 2011.
- [9] Zhen Huang, Cheng Wang, Sushmita Ruj, Milos Stojmenovic, and Amiya Nayak. Modeling cascading failures in smart power grid using interdependent complex networks and percolation theory. In The 8th IEEE Conference on Industrial Electronics and Applications, ICIEA’13, pages 1023 – 1028, 2013.
- [10] Zhen Huang, Cheng Wang, Milos Stojmenovic, and Amiya Nayak. Percolation of partially interdependent networks under targeted attack. IEEE Trans. Emerging Topics in Computing, Jan 2013.
- [11] David Kushner. The real story of stuxnet. IEEE Spectrum, March, 2013.
- [12] Jing Liu, Yang Xiao, Shuhui Li, Wei Liang, and C. L. Philip Chen. Cyber security and privacy issues in smart grids. IEEE Communications Surveys and Tutorials, 14(4):981–997, 2012.
- [13] Mark.E.J. Newman. Networks: An Introduction. Oxford University Press, 2010.
- [14] Giuliano Andrea Pagani and Marco Aiello. The power grid as a complex network: A survey. Physica A: Statistical Mechanics and its Applications, 392:2688–2700, Jun 2013.
- [15] Amir Hamed Mohsenian Rad, Vincent W. S. Wong, Juri Jatskevich, Robert Schober, and Alberto Leon-Garcia. Autonomous demand-side management based on game-theoretic energy consumption scheduling for the future smart grid. IEEE Trans. Smart Grid, 1(3):320–331, 2010.
- [16] Jia Shao, Sergey V. Buldyrev, Shlomo Havlin, and H. Eugene Stanley. Cascade of failures in coupled network systems with multiple support-dependent relations. CoRR, 2010.
- [17] Wenye Wang and Zhuo Lu. Cyber security in the smart grid: Survey and challenges. Computer Networks, 57(5):1344–1371, 2013.
- [18] Wenye Wang, Yi Xu, and Mohit Khanna. A survey on the communication architectures in smart grid. Computer Networks, 55(15):3604–3629, 2011.
- [19] Wenye Wang, Yi Xu, and Mohit Khanna. Enhancing network robustness against malicious attacks. Physical Review E, 85:066130, 2012.
- [20] Osman Yagan, Dajun Qian, Junshan Zhang, and Douglas Cochran. Optimal allocation of interconnecting links in cyber-physical systems: Interdependence, cascading failures and robustness. CoRR, abs/1201.2698, 2012.
- [21] Yanling Yuan, Zuyi Li, and Kui Ren. Quantitative analysis of load redistribution attacks in power systems. IEEE Trans. Parallel Distrib. Syst., 23(9):1731–1738, 2012.
Appendix A: Calculating giant component upon random removal of vertices
Let us consider a network have a degree distribution . Let be the fraction of nodes left after random removal of nodes. Let be the probability that a vertex is not connected to the giant component via a particular neighbor. If the vertex has degree , then average probability that it is not in the giant component is
| (31) |
where , is the generating function for the degree distribution. Hence, the probability that a vertex belongs to a giant component is . However, the vertex itself present with a probability . Thus fraction of nodes in the giant component is
| (32) |
In order to calculate the value of we note that a node is not in the giant component if it is either removed, or it is present but not connected to the giant component via any of its neighbors. The first condition happens with probability whereas the second condition happens with probability . Since node can be reached following an edge, the value of follows the excess degree distribution
| (33) |
where is the average degree of the network. Thus, averaging over this distribution we get
| (34) |
where
| (35) |
is the generating function for excess degree distribution.