CPA for strongly correlated systems: Electronic structure and magnetic properties of NiO-ZnO solid solutions.
Abstract
The method of electronic structure calculations for strongly correlated disordered materials is developed employing the basic idea of coherent potential approximation (CPA). Evolution of electronic structure and spin magnetic moment value with concentration in strongly correlated Ni1-xZnxO solid solutions is investigated in the frame of this method. The obtained values of energy gap and magnetic moment are in agreement with the available experimental data.
Keywords: nickel oxide; zinc oxide; solid solution; coherent potential approximation
pacs:
71.23.-k, 71.15.Dx, 71.20.Be1 Introduction
The study of the electronic structure of the solid compounds with the impurities within density functional theory could be performed in two ways. One is the supercell method when the unit cell of parent compound is enlarged by several times and one of the atoms is replaced by the atom of impurity. This method has two basic shortcomings: first, the atoms of impurity are turned out to be ordered and second, only discrete concentration could be treated (specified by the number of unit cells). Another approach is the coherent potential approximation developed in the 1970s [1]. The main idea of the CPA is the modification of the electronic Green function by introducing the coherent potential describing self-consistent effective medium containing randomly distributed impurity. The compounds with arbitrary concentration and disordered impurities could be naturally treated within this approach. The main objects of investigation studied within CPA until now are the transition metal and semi-conductor alloys (for instance Ga-As), which generally have quite similar potentials of matrix and impurity atoms. Recently the CPA was also applied for nonstoichiometric materials with vacancies in metallic and nonmetallic sublattices (TiO2-δ, TiOy, TiO2-x-yCxNy) [2, 3, 4, 5].
In searching the alloy theory based on first principles the large efforts have been made to combine CPA with different methods of electronic structure calculation in the 1980s and 1990s. The Korringa-Kohn-Rostoker (KKR) method was combined with CPA approach and applied to the Cu-Ni alloy [6]. The KKR-CPA was found to be very time consuming. The well known problems with the energy dependence of the structure constants which takes most of calculation time can be solved by linear approaches in the band theory of ordered systems like linearized muffin-tin orbitals method (LMTO). The next step was the realization of TB-LMTO-CPA method proposed by Kudrnovský and Drchal [7] though some difficulties with the Brillouin zone integration remain. The efficient scheme for obtaining the electronic properties of random solid solutions was developed on the basis of CPA and LMTO Green function method by Abrikosov et al. and applied for Cu-Ni and Cu-Au alloys [8]. In the last few years the interest to the CPA approach is revived mainly because of its natural incorporation into the LDA+DMFT computational scheme. Such combination gives opportunity for investigation of strongly correlated disordered systems. The topical review of the fully self-consistent KKR-based Local Spin Density Approximation + Dynamical Mean Field Theory (LSDA+DMFT) scheme and its application to the ordered and disordered compounds was performed by Minár [9]. This scheme was successfully employed to FexNi1-x alloy [10], Co-Pt solid-state systems [11] and magnetic alloy system NixPd1-x [12].
In the present paper we develop the scheme for calculation of electronic structure of strongly correlated disordered systems based on the CPA. This method is applied for investigation of electronic structure and magnetic moment of the strongly correlated NiO-ZnO solid solutions. The comparison with available experimental data is performed. The current scheme is conceptually close to the dynamical mean field theory DMFT [13]. In present version the strong correlations are treated in the static mean-field limit, while the fully self-consistent CPA-DMFT method is the challenge for the future work.
2 CPA method
The comprehensive review on the CPA methodology could be found in [14]. Below the basic equations of current CPA scheme are presented. The self-consistent coherent potential approximation cycle starts from the calculation of single-site electronic Green function on the imaginary axis:
| (1) |
where ,… are the odd Matsubara frequencies, =1/T is inverse temperature, is a chemical potential, is the unit matrix, is the Hamiltonian of the system without impurity, the summation runs over k vectors of reciprocal lattice in the irreducible part of the Brillouin zone, is starting coherent potential. As in the dynamical mean-field theory is assumed to be k independent which is correct in the limit of and hence all calculated Green functions are wave vector independent.
The self-consistent solution is achieved if the single-site Green function (1) coincide with the Green function of single impurity model . Let us call the part of the Green function corresponding to effective medium (the sites on which the impurity is uniformly distributed) as . Then the Dyson equation for the Green function of the bath will have the form
| (2) |
The effective Green function at the sites containing the impurity with concentration has the form
| (3) |
where
| (4) |
| (5) |
and is the difference in potentials between the “impurity” and “host” atoms. The equation (3) replaces the solution of the single impurity Anderson model in DMFT method. New coherent potential could be obtained from equation (2):
| (6) |
Then the new coherent potential is used in equation (1) and procedure of searching of is repeated until the self-consistency condition will be fulfilled. Finally, to calculate the density of states (DOS), the self-consistent coherent potential is analytically continued to the real energy axis using the Padé approximants [15].
This scheme was developed and successfully applied to the investigation of the electronic structure of nonstoichiometric rutile [2], titanium monoxide [3], and titanium dioxide with carbon and nitrogen impurities in oxygen sublattice [4, 5]. In the case of titanium dioxide the scissors operator was employed to adjust the calculated energy gap value to the experimental one.
The new feature of the current version of CPA is the treatment of the strongly correlations in the static mean-field limit [16]. This scheme is appropriate for disordered compounds with strongly correlated host sublattice (like NiO). In this case equation (4) is transformed in the same manner as (5) to
| (7) |
where could be found in the static mean-field limit [16] as
| (8) |
In (8) the matrix elements of single-particle potential are expressed in terms of complex spherical harmonics , Slater integrals
| (9) |
| (10) |
and occupancy , =. For -elements =0, 2, 4, screened Coulomb parameter =, Stoner exchange parameter =, with ratio =. In the case of strongly correlated impurity, in equation (5) contains additional contribution according to (8).
The first step of the proposed CPA method is the construction of the Hamiltonian of the system without impurity . For that purpose the conventional band structure calculation of the pure system was carried out within TB-LMTO-ASA (Tight Binding-Linearized Muffin-Tin Orbitals-Atomic Sphere Approximation) code [17]. Then the Hamiltonian of the pure system have been derived in the basis of Wannier functions using the projection procedure [18].
The second step is the calculation of the difference in potentials between the “impurity” and “host” atoms, . Generally one should simulate the single impurity embedded in the host matrix and calculate the difference of their potentials. The is obtained from the self-consistent band structure calculation of the supercell in which one of the atoms in the matrix is replaced by the atom of the impurity. The supercell should be large enough to have an atom of the matrix which does not have the impurity atom in its at least nearest neighbor surrounding. Then the Hamiltonian of the supercell is transformed in the Wannier function basis and difference in potentials between impurity atom and the outermost of it host atom is derived. We would like to stress here that the supercell approach is used only for estimation.
In the presented CPA scheme the impurity is supposed to be uniformly distributed among all sites of the matrix. This implies that the symmetry of the lattice dose not change. The impact of the impurity on the matrix is characterized by the value of . The larger concentration of the impurity the stronger these impact. Note that the concentration may have arbitrary value.
3 Details of the calculation
It is known from the literature that the NiO-ZnO solid solutions were synthesized in powder form at high pressure of 7.7 GPa and at temperature 1470 K in the crystal structure of rock salt (NaCl) [19]. Concentration range of single-phase Ni1-xZnxO solutions is . The lattice parameter of the solution depends linearly on the concentration and varies in the range 4.176 Å (NiO) – 4.280 Å (ZnO) [19]. The neutron diffraction experiments revealed that the antiferromagnetic structure AF(II), the same as for NiO, preserves in Ni1-xZnxO in concentration range [20].
We present here the results of the electronic structure calculation of strongly correlated solid solutions Ni1-xZnxO () within the coherent potential approximation, assuming conservation of AF(II) antiferromagnetic structure, taking into account the concentration dependence of the lattice parameter in the NaCl structure. We use a version of the coherent potential approximation introduced in the previous section.
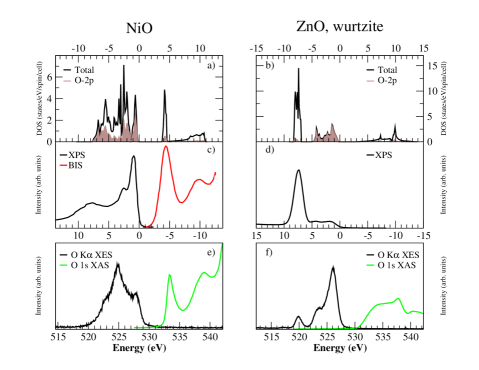
Different theoretical approaches have been applied to resolve correctly electronic structure of pure NiO: LDA+U [21], generalized gradient approximation GGA [22], LDA+DMFT [23]. The detailed comparison of various theoretical results with experimental XES (X-ray Emission Spectroscopy) and XAS (X-ray Absorption Spectroscopy) spectra presented in [24]. In the current work the parameters of Coulomb and exchange interactions for Ni ions in NiO were taken conventional, =8 eV, =1 eV [21]. Obtained within LDA+U (Local Density Approximation+U correction) total and partial densities of states for NiO are in good agreement with the previous results [21] and experimental XES and XAS [24], XPS VB (X-ray Photoemission Spectroscopy of Valence Band) [25] and BIS ( Bremsstrahlung Isohromat Spectroscopy) [26] spectra (figure 1). The calculated within LDA+U characteristics such as the band gap =3.8 eV and the spin magnetic moment =1.75 per Ni ion are in correspondence with experimental data: =4.3 eV [27], =3.8 eV [28], =1.64 [29], =1.77 [30], =1.9 [31].
At ambient conditions the most stable structure of ZnO is hexagonal wurtzite and it can be transformed to the rock salt structure at pressures about 10 GPa [32]. The majority of the experimental data concerns wurtzite ZnO. The basic features of the XAS and XES [33] as well as XPS VB [34] spectra of wurtzite ZnO are reproduced in calculation with =7 eV and =1 eV (see figure 1). On the contrary to the NiO, in ZnO the valence band near the Fermi level is dominated by O-2p states as seen from the shape of DOS O-2p in figure 1. The different methods were implicated to overcome a well-known shortcomings of LDA for these compound. The comprehensive review could be found in [32]. The obtained in LDA+U calculation value of the band gap is =3.0 eV in reasonable agreement with experimental estimations =3.4 eV [33]. Since there are lack of experimental spectra for rock salt ZnO, in what follows for ZnO in the NaCl structure we will use the same set of parameters (the values of Coulomb and exchange interactions) as for wurtzite.
There are two formula units in the unit cell of NiO and ZnO with AF(II) magnetic structure. At each concentration the LDA Hamiltonian with the corresponding lattice constant [19] was calculated self-consistently. At this stage, the LMTO basis included , , -states of Ni(Zn), O and empty spheres, as required by the LMTO code [17]. Then the full Hamiltonian was projected into the basis of Wannier functions for 3 and 4 states of transition metal ions and 2 states of oxygen using procedure described in [18].
To determine the parameters V, calculations of the supercell containing 16 formula units were done. Since the physical idea of V calculation based on the consideration of a single defect (vanishingly small impurity concentrations), and we deal with the full range of in Ni1-xZnxO, a study was carried out from two directions: when Zn is an impurity in NiO, , and when there is an impurity of Ni in ZnO, .
In a self-consistency coherent potential loop the parameter of inverse temperature was chosen to be =40 eV-1, which corresponds to the room temperature, the Matsubara frequency cutoff was set to Ecut=1500 eV.
4 Results and discussion
The calculated results for the total DOS of solid solutions Ni1-xZnxO are shown in figure 2, where the results for Zn impurity in NiO, , are displayed in the left column and for Ni impurity in ZnO, , in the right one.
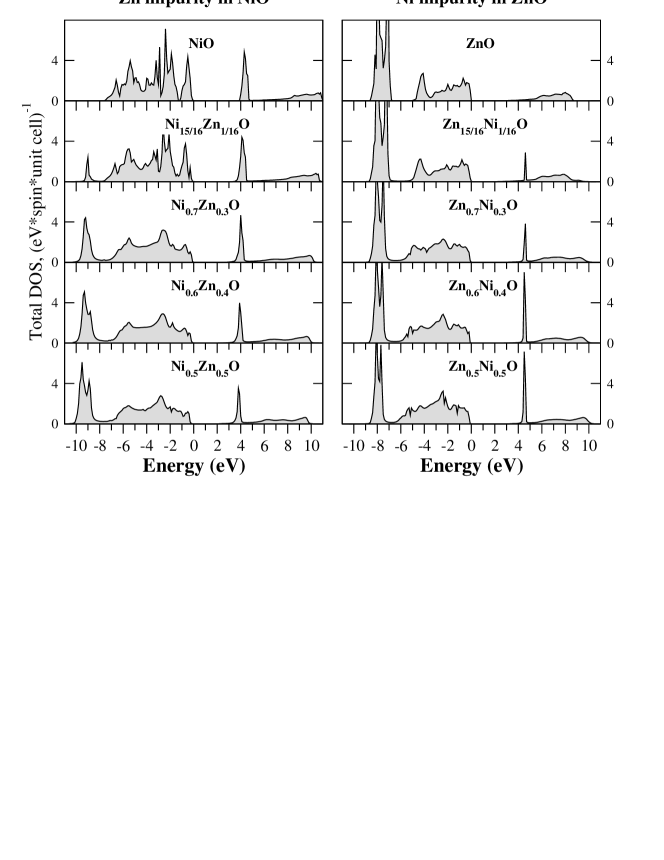
In the case of undoped NiO (left top panel in figure 2) the valence and conduction bands are formed by hybridized O - and Ni -states. The width of the valence band is eV. Under Zn doping emerges an additional band centered at the energy eV and formed by impurity Zn -states. An increase of Zn concentration leads mainly to narrowing of the valence band of undoped NiO and to growth of Zn -peak. Simultaneously, the width and the height of conduction band peak are decreased due to reduction of the number of unoccupied -electrons originated from Ni.
Valence band of pure rock salt ZnO (right top panel in figure 2) consists of two parts: Zn -band of eV width centered at energy eV and O -band with admixture of Zn -states extended in () eV interval. The increase of Ni impurity concentration leads to appearance and growth of unoccupied conduction band peak, broadening of O valence band, and decrease of Zn -band.
Experimental data of the optical absorption edge [35] show that rock salt ZnO is an indirect semiconductor with a band gap of 2.450.15 eV at 13.5 GPa. An intense direct transition occurs at higher energy 4.5 eV at 10 GPa. The energy gap obtained within LDA+U calculation for pure ZnO (right upper panel of figure 2) is about 2.2 eV in agreement with experimental results.
From figure 2(left panel) one can see that the energy gap in Ni1-xZnxO solid solutions with undergoes only slight reduction of about 0.25 eV going from pure NiO to Ni0.5Zn0.5O. The photoluminescence and photoluminescence excitation of NiO and Ni1-xZnxO solid solutions with NaCl crystal structure were investigated in [36]. On the basis of photoluminescence excitation spectra for this solid solutions one can conclude that the value of the band gap in the series NiO-Ni0.5Zn0.5O-Ni0.3Zn0.7O displays minor changes not more than 0.2 eV [37]. This experimental finding is in good agreement with the present CPA results.
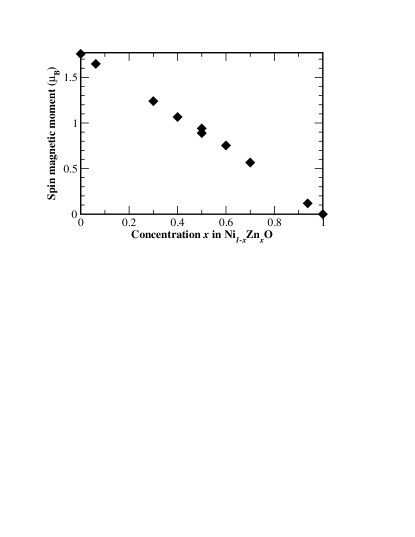
The values of spin magnetic moment of effective -ion in Zn impurity in NiO and Ni impurity in ZnO are shown in figure 3. The small difference of calculated results 0.05 at ”meeting” concentration validates the coherent potential approximation scheme used in this work.
Magnetic moment values presented in figure 3 are calculated basing on the single-site Green function (1) for the effective -shell. It’s values decay linearly from 1.77 in undoped NiO to in undoped ZnO. Meanwhile the magnetic moments for the host -Ni determined from the host Green function (7) are practically the same in the concentration range 00.5 (the difference between them is less than 0.02 ). This agrees well with the neutron diffraction data indicating no change in the magnetic moment despite of the magnetic ion dilution (see figure 5 in [20]).
5 Conclusions
The method for electronic structure calculation of disordered strongly correlated systems is developed on the basis of the coherent potential approximation. It is applied for investigation of the Ni1-xZnxO solid solutions. The novelty of this study lies in the fact that the CPA is applied to the disordered strongly correlated transition metal oxide system for the first time. The energy spectra and spin magnetic moment values have been calculated assuming NaCl crystal structure and antiferromagnetic order of -ions in the whole concentration range = in Ni1-xZnxO. Strong correlations of -ions were treated in the static mean-field limit. The values of the band gap in the Ni1-xZnxO solid solutions exhibit insignificant changes in agreement with results of the photoluminescence excitation. The decrease of the spin magnetic moment value of the effective -ion is found to be linear with the increase of concentration .
Acknowledgements
The authors thank Yuri A. Babanov and Victor I. Sokolov for useful discussions. The study was partially supported by Program of UB RAS, project No 12-P-2-1021 (MAK), 12-I-2-2040 (EZK) and RFFI 13-02-00374, MK 3443.2013.2 (ZVP). Part of the calculations were performed on the “Uran” cluster of the IMM UB RAS.
References
References
- [1] Soven P 1967 Phys. Rev. 156 809
- [2] Korotin M A, Skorikov N A, Zainullina V M, Kurmaev E Z, Lukoyanov A V and Anisimov V I 2012 JETP Letters 94 806-810
- [3] Korotin M A, Efremov A V, Kurmaev E Z and Moewes A 2012 JETP Letters 95 641-646
- [4] Zainullina V M and Korotin M A 2013 Physics of the Solid State 55 26-30
- [5] Korotin M A and Zainullina V M 2013 Physics of the Solid State 55 952-959
- [6] Faulkner J S and Stocks J M 1980 Phys. Rev. B 21 3222
- [7] Kudrnovský J and Drchal V 1990 Phys. Rev. B 41 7515
- [8] Abrikosov L A, Vekilov Yu H and Ruban A V 1991 Phys. Lett. A 154 407
- [9] Minár J 2011 J. Phys.: Condens. Matter 23 253201
- [10] Minár J, Chioncel L, Perlov A, Ebert H, Katsnelson M I and Lichtenstein A I 2005 Phys. Rev. B 72 045125
- [11] Šipr O, Minár J, Mankovsky S and Ebert H 2008 Phys. Rev. B 78 144403
- [12] Braun J, Minár J, Matthes F, Schneider C M and Ebert H 2010 Phys. Rev. B 82 024411
- [13] Metzner W and Vollhardt D 1989 Phys. Rev. Lett. 62 324
- [14] Elliott R J, Krumhansl J A and Leath P L 1974 Rev. Mod. Phys. 46 465
- [15] Vidberg H J and Serene J W 1977 J. Low Temp. Phys. 29 179
- [16] Liechtenstein A I, Anisimov V I and Zaanen J 1995 Phys. Rev. B 52 R5467
- [17] Andersen O K and Jepsen O 1984 Phys. Rev. Let. 53 2571
- [18] Anisimov V I et al 2005 Phys. Rev. B 71 125119
- [19] Baranov A N, Sokolov P S, Kurakevych O O, Tafeenko V A, Trots D and Solozhenko V L 2008 High Press. Res. 28 515-519
- [20] Rodic D, Spasojevic V, Kusigersi V, Tellgren R and Rundlof H 2000 Phys. Stat. Sol. B 218 527-536
- [21] Anisimov V I, Zaanen J and Andersen O K 1991 Phys. Rev. B 44 943
- [22] Cococcioni M and de Gironcoli S 2005 Phys. Rev. B 71 035105
- [23] Kuneš J, Anisimov V I, Lukoyanov A V and Vollhardt D 2007 Phys. Rev. B 75 165115
- [24] Kurmaev E Z, Wilks R G, Moewes A, Finkelstein L D, Shamin S N and Kuneš J 2008 Phys. Rev. B 77 165127
- [25] Uhlenbrock S Ph.D. thesis Fachbereich Physik der Universität Osnabrück 1994
- [26] Hüfner S, Steiner P, Sander I, Neumann M and Witzel S 1991 Z. Phys. B: Condens. Matter 83 185
- [27] Sawatzky G A and Allen J W 1984 Phys. Rev. Lett. 53 2339
- [28] Powell R J and Spicer W E 1970 Phys. Rev. B 2 2182
- [29] Alperin H A 1962 J. Phys. Soc. Jpn. Suppl. B 17 12
- [30] Fender B E F, Jacobson A J and Wedgwood F A 1968 J. Chem. Phys. 48 990
- [31] Cheetham A K and Hope D A O 1983 Phys. Rev. B 27 6964
- [32] Özgür Ü, Alivov Ya I, Liu C, Teke A, Reshchikov M A, Doğan S, Avrutin V, Cho S-J and Morkoç H 2005 J. Appl. Phys. 98 041301
- [33] McLeod J A, Wilks R G, Skorikov N A, Finkelstein L D, Abu-Samak M, Kurmaev E Z and Moewes A 2010 Phys. Rev. B 81 245123
- [34] McLeod J A, Moewes A, Zatsepin D A, Kurmaev E Z, Wypych A, Bobowska I, Opasinska A, Cholakh S O 2012 Phys. Rev. B 86 195207
- [35] Segura A, Sans J A, Manjón F J, Muñoz and Herrera-Cabrera M J 2003 Appl. Phys. Lett. 83 278
- [36] Sokolov V I, Pustovarov V A, Churmanov V N, Ivanov V Yu, Gruzdev N B, Sokolov P S, Baranov A N and Moskvin A S 2012 Phys. Rev. B 86 115128
- [37] Sokolov V I Private communication, 2013