X-ray Spectral Components Observed in the Afterglow of GRB 130925A
Abstract
We have identified spectral features in the late-time X-ray afterglow of the unusually long, slow-decaying GRB 130925A using NuSTAR, Swift-XRT, and Chandra. A spectral component in addition to an absorbed power-law is required at significance, and its spectral shape varies between two observation epochs at and seconds after the burst. Several models can fit this additional component, each with very different physical implications. A broad, resolved Gaussian absorption feature of several keV width improves the fit, but it is poorly constrained in the second epoch. An additive black body or second power-law component provide better fits. Both are challenging to interpret: the blackbody radius is near the scale of a compact remnant ( cm), while the second powerlaw component requires an unobserved high-energy cutoff in order to be consistent with the non-detection by Fermi-LAT.
Subject headings:
gamma-ray burst: individual (GRB130925A)1. Introduction
Recent work has identified several “ultra-long” gamma-ray bursts (GRBs) with properties distinct from normal long GRBs (Levan et al., 2013, and references therein). These events have initial bursting phases lasting thousands of seconds in gamma-rays and show long-lived, highly variable X-ray afterglows. It is currently unclear whether these bursts are simply extreme examples of the long GRB class, as suggested by Zhang et al. (2013); if they are related to the even longer candidate relativistic Tidal Disruption Events (TDEs) Swift J1644+57 (Bloom et al., 2011; Levan et al., 2011; Burrows et al., 2011) and Swift J2058+05 (Cenko et al., 2012); or if they represent a new subclass of transient, perhaps with large-radius progenitors (Woosley & Heger, 2012; Gendre et al., 2013; Nakauchi et al., 2013).
The bright, nearby GRB 130925A is similar to previously reported ultra-long GRBs and, with the launch of NuSTAR, provides an opportunity to observe the X-ray spectrum at high sensitivity over a broad energy band. Here we report time-varying spectral features in the late-time X-ray afterglow of GRB 130925A that were initially discovered by NuSTAR and confirmed in a second epoch by NuSTAR and Chandra. Our detections are at higher energies and significantly later times than previously reported afterglow features.
Before the era of routine afterglow observations with Swift-XRT, several authors claimed detection of lines in GRB X-ray afterglows on top of otherwise smooth power-law spectra (e.g., Piro et al., 2000; Amati et al., 2000; Reeves et al., 2002). Most reports were of emission lines at relatively low signal-to-noise ratio, and there was substantial controversy over the methods used to assess line significance (Protassov et al., 2002; Sako et al., 2005). Since the advent of Swift, no firm afterglow line detections have been reported despite its greater sensitivity and systematic followup, calling previous reports into question (for a review, see Hurkett et al., 2008).
However, statistically significant blackbody components have been reported in the early-time ( s) afterglow spectra of several bursts observed by Swift-XRT (Starling et al., 2012, and references therein). The inferred rest-frame temperatures are typically a few tenths of a keV, the inferred radii are cm, and the blackbody component provides 10–50% of the 0.3–10 keV flux. The first detections were in low-luminosity, SN-associated GRBs, leading to suggestions that the emission was due to shock breakout from the SN (e.g., Campana et al., 2006). Systematic searches have found thermal components in early afterglows of classical GRBs as well (Sparre & Starling, 2012; Friis & Watson, 2013), giving credence to alternative interpretations including late-time emission from a prompt photosphere (Friis & Watson, 2013) or emission from a cocoon around the jet (Suzuki & Shigeyama, 2013; Nakauchi et al., 2013).
Of particular relevance are reports of additional components in the afterglows of other ultra-long GRBs. The “Christmas Day Burst” GRB 101225A showed evidence of two separate blackbody components, a 1 keV X-ray black body with radius cm observed 6 ksec after the burst and a UVOIR black body with radius 2–7 cm which cooled over 18 days (Thöne et al., 2011). In GRB 111209A, Stratta et al. (2013) reported the XMM detection of a second, hard power-law component () during the steep decay phase 70 ksec after the burst.
2. Observations
GRB 130925A produced several emission episodes triggering Swift-BAT, Fermi-GBM, and MAXI. Swift-BAT triggered on GRB 130925A at 2013-09-25 04:11:24 UT (Lien et al., 2013). Fermi GBM triggered on a precursor episode about 15 minutes before the Swift trigger (Fitzpatrick & the Fermi GBM Team, 2013), and MAXI triggered on an emission episode nearly 4 ksec after the initial Swift trigger (Suzuki et al., 2013). The final BAT detection of the emission occurred during a flare observed by XRT, at ksec (Markwardt et al., 2013). Despite an automated repointing, Fermi-LAT did not detect any emission (Kocevski et al., 2013). Both the INTEGRAL-SPI Anti-Coincidence Shield and Konus-WIND detected gamma-rays from the burst over a total interval of nearly 5 ksec (Savchenko et al., 2013; Golenetskii et al., 2013).
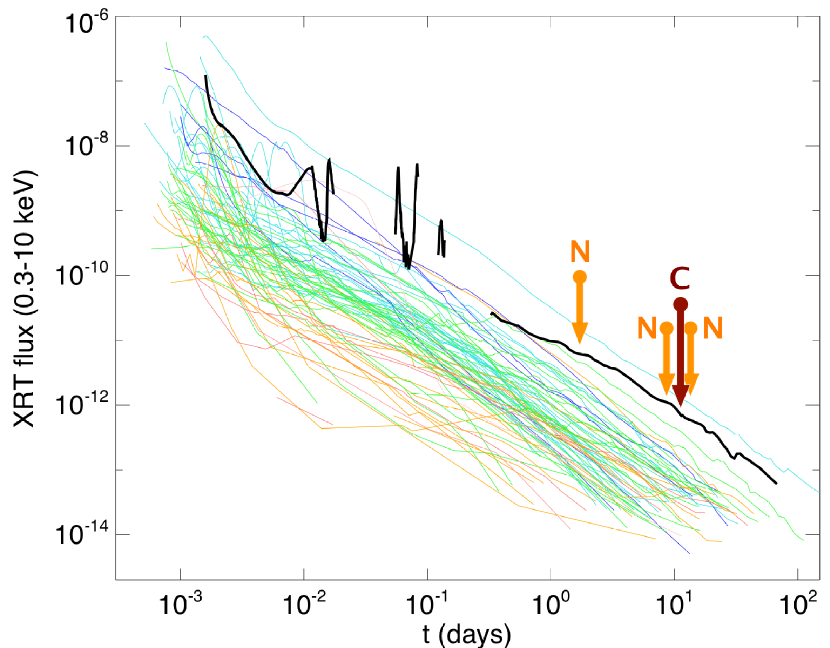
Swift-XRT observed large, repeated flares from the burst (Evans et al., 2013; Figure 1). The extraordinary length of the bursting phase led Burrows et al. (2013) to suggest similarity to the proposed jetted TDE Swift J1644+57, although Golenetskii et al. (2013) argued that some previous ultra-long events thought to be GRBs had been observed with similar total duration.
Starting around sec after the Swift trigger, the X-ray afterglow entered a steady decay phase without new flares (Figure 1). The observed decline is similar to other GRB afterglows and differs markedly from the weeks of flaring observed for Swift J1644+57.
In contrast, the source was faint at optical–NIR wavelengths. Rapid followup observations found a NIR-bright (, mag AB) source near the X-ray position (Sudilovsky et al., 2013a). Spectroscopy of the host galaxy provided a redshift of (Vreeswijk et al., 2013; Sudilovsky et al., 2013b). Late-time HST imaging showed that the event took place in the plane of a disrupted host galaxy but offset 0.12 arcsec (600 pc in projection) from the galaxy nucleus (Tanvir et al., 2013). This offset disfavors a TDE origin for this event, although the authors noted that a galaxy merger could produce a supermassive black hole offset from the light centroid.
NuSTAR (Harrison et al., 2013) provides unprecedented X-ray sensitivity above 10 keV thanks to the combination of its multilayer-coated focusing optics and CdZnTe detectors. NuSTAR observed GRB 130925A during the decay phase beginning 1.8 days after the Swift trigger (Figure 1). The total on-source observation time in the first epoch was 39.2 ksec. Our initial analysis showed that an absorption feature was needed to fit the NuSTAR data (Bellm et al., 2013). We triggered two additional NuSTAR observations of 88.2 and 90.7 ksec integration time; these occurred at 8.8 and 11.3 days after the Swift trigger. We also obtained a 44.3 ksec Director’s Discretionary Time observation with Chandra ACIS-S beginning 11.0 days after the Swift trigger.
3. Data Reduction
We processed the NuSTAR data with HEASOFT 6.14 and the NuSTAR Data Analysis Software (NuSTARDAS) v.1.2.0 using CALDB version 20130509. We extracted source counts from circular regions with 40 arcsec radius from both NuSTAR modules. We identified background regions of 125 arcsec radius on the same NuSTAR detectors as the source. Since the second and third NuSTAR observations and the Chandra observation are nearly contiguous in time and the source is only slowly varying, we analyzed these data together and refer to them hereafter as the second epoch. We combined the NuSTAR data from the second and third observations and from both modules into a single spectrum to maximize the signal-to-noise ratio.
We also downloaded and reduced the 13.0 ksec of Swift-XRT PC-mode data contemporaneous with the first NuSTAR epoch (obsid 00571830006) using standard procedures in HEASOFT 6.14.
We processed the Chandra data using standard procedures with CIAO v4.5. The data were obtained using 1/4 Window readout to reduce pileup; we verified that the effect of pileup on our spectra is negligible and ignore it in further analysis.
We rebinned all of the data to counts per bin and fit the data using ISIS v1.6.2-19. We also required the NuSTAR bins to have SNR of , as above keV the background dominates. We minimized in our fits to the data and use the covariance matrix in our significance calculations in Section 4. We used fit energy bands of 3–30 keV (NuSTAR), 0.3–10 keV (Swift-XRT), and 0.2–10 keV (Chandra). All errors are 90% C.L., and we have used a cosmology with , , (Komatsu et al., 2011).
4. Spectral Modeling
4.1. Single Power law
GRB X-ray afterglow spectra are usually well-fit by absorbed power law (PL) models. We froze a Galactic component of cm-2 (Kalberla et al., 2005; Evans et al., 2013) and allowed a varying component at the reported redshift of .
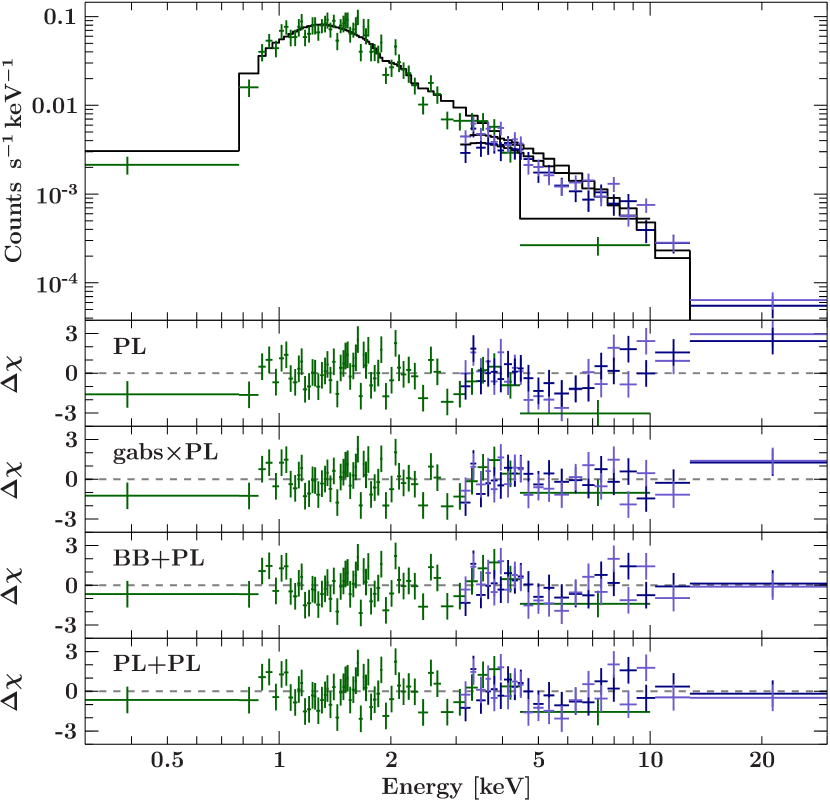
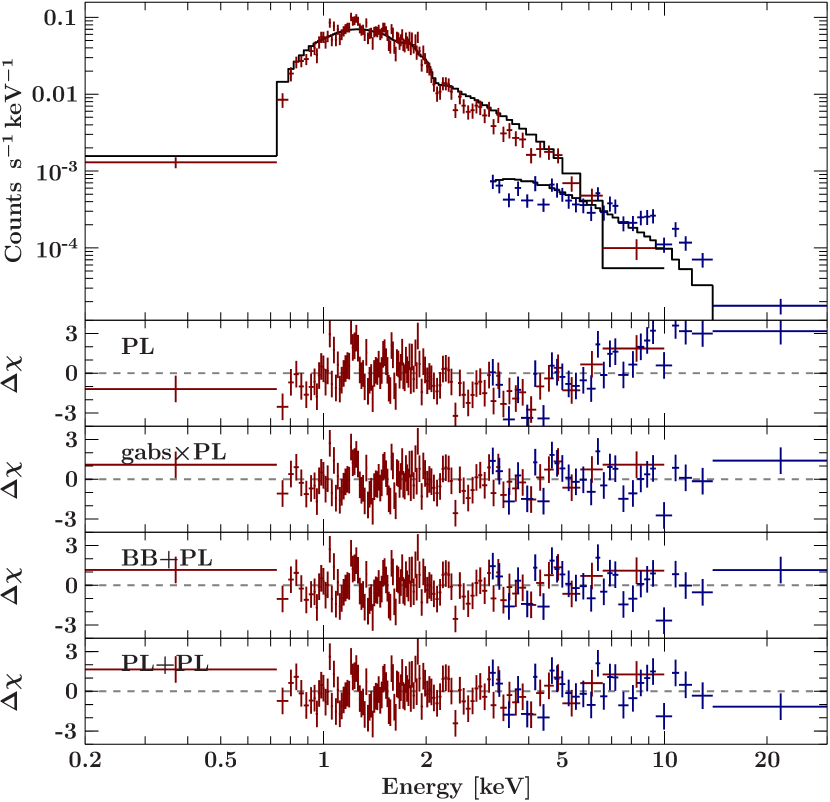
A PL fit to the first epoch NuSTAR data shows a clear deficit in the residuals in the 5–6 keV region (Figure 2). A joint PL fit including the Swift-XRT data improves the parameter constraints, particularly for , but the residual structure remains. The goodness of fit is poor, with (Table 1). A PL fit to the Chandra data and a joint NuSTAR-Chandra PL fit also show residual structure (Figure 3) and poor goodness of fit, with . Additional components (Sections 4.2–4.5) improve these fits.
4.2. Absorption Feature
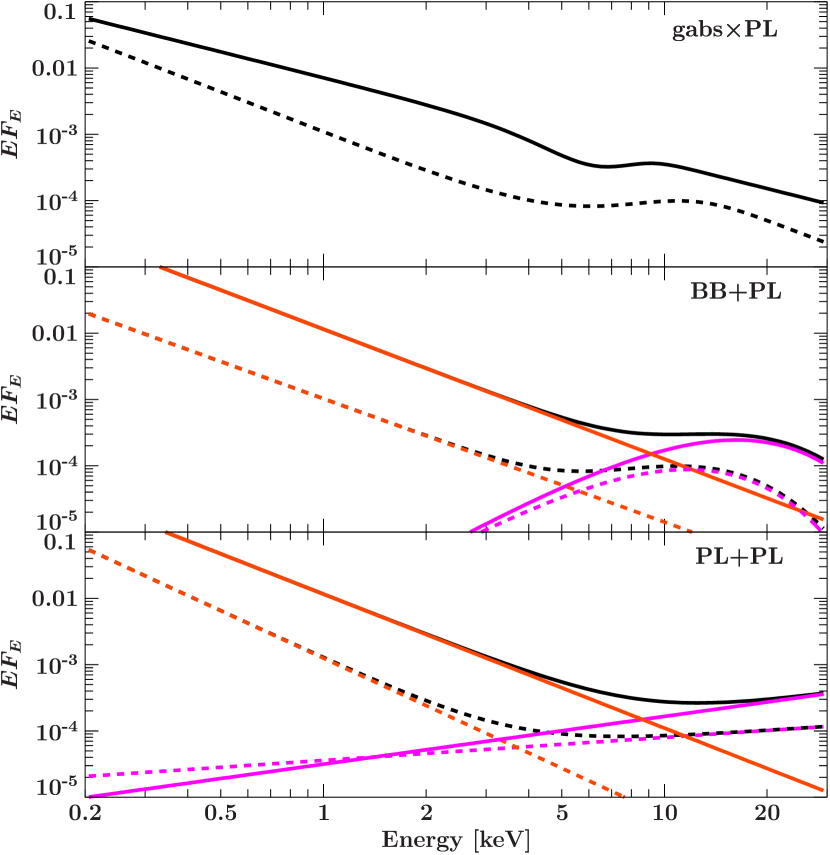
Multiplying by a Gaussian absorber (gabsPL) in the first epoch markedly improves the fit residuals relative to a PL fit (Figure 2). The centroid of the Gaussian absorber is at 5.9 keV, and keV, both in the observer frame. The Swift data show similar residual structure, and in a joint fit the Gaussian absorber gives a similar centroid (6.0 keV) but greater width (1.8 keV; Table 1). In the joint fit, improves to 1.1 from 1.6 for three additional parameters.
In the second epoch, a Gaussian absorber again improves the fit relative to a PL ( from 2.2), but the parameters are poorly constrained. The joint NuSTAR and Chandra fit provides only an upper limit (4.1 keV) on the line centroid. This value is inconsistent with that of the first epoch, and the required line width is substantially larger ( keV, Figure 4). The large shift in the line centroid is difficult to explain with absorption by a single species. If the large linewidth is interpreted as turbulent velocity broadening, this implies relativistic velocities that increase from the first epoch to the second, an unlikely scenario.
4.3. Bremsstrahlung
We obtained good fits () with an absorbed bremsstrahlung plus power-law model (BremssPL). The component is well-constrained in both epochs, with best-fit temperatures of 1.30.2 and 0.83 keV in the comoving frame. The fit emission measures are 1.1 cm-3 and 2.3 cm-3. These extreme emission measures, if produced by a constant-density medium, would require densities of order cm-3. However, a circumstellar medium this dense would be optically thick to electron scattering, violating the assumptions of the optically thin bremsstrahlung model. The emitting region would be optically thin only if the radius of the region were cm, much larger than typical afterglow radii. More complex density profiles would require even higher densities at some locations. Thus while the addition of an optically thin bremsstrahlung spectral component improves the fit to the data, we are unable to construct a self-consistent physical interpretation for it. This problem persists even if instead we require a higher temperature for the bremsstrahlung component in order to fit the high-energy excess. The fit is worse ( increases by 5.9 in both epochs) and provides only a lower limit on the temperature ( keV in the comoving frame). The emission region must still be larger than cm to be optically thin.
Motivated by the presence of possible additional residual structure in the Chandra data in the 1–3 keV range, we attempted to fit mekal and apec plasma emission models to the second-epoch data. With standard abundances, these models fit metallicity values of zero, reproducing the unphysical BremssPL model. Even with highly variable abundances, single-temperature plasmas did not provide clear improvements in the fit.
4.4. Black Body
We also fit a black body plus power-law model (BBPL). The surface shows two minima for the blackbody temperature in both epochs, one near 5 keV and the second near 0.5 keV. In the first epoch the higher temperature is preferred ( vs. for 90 d.o.f.), while in the second epoch the goodness of fit is closer to equivalent ( vs. for 130 d.o.f). We argue that the higher-temperature black body fit is more plausible due to its relative consistency with the component observed in the first epoch and with theoretical expectations (Section 5).
The blackbody components provide 11% (29%) of the total 0.3–30 keV flux in the first (second) epoch. The implied radii for a spherical emission region are small and consistent with constant size: cm and cm. (The radii for the disfavored low-temperature black bodies are larger but also relatively compact. However, they imply a physically unlikely contraction of the emitting region from cm to cm.)
While black body components have been reported in other GRB afterglow spectra, none have been observed at such late times, with such high temperatures, or with such small radii. At 1–10 days after the burst, the blackbody radius inferred from GRB 101225A was over cm and could be explained by the jet interaction with the circumstellar medium (Thöne et al., 2011). The inferred radius of cm for GRB 130925Ais much harder to explain with a jet interaction model. This size scale is instead on par with the radius of the fallback accretion disks expected in stellar collapse (Fryer, 2009).
If we assume we are observing this disk, the fit temperature can place constraints on the progenitor by constraining the conditions in the disk. The luminosity of an accretion disk is roughly equal to the potential energy released in the accretion. If we consider material at radius , the luminosity () is given by where is the accretion rate and denotes a small annulus of material at radius (integrating over would produce the total luminosity). The blackbody emission for such an annulus is , where is the Stefan-Boltzmann constant and is the blackbody temperature. If we know the temperature, we can then derive the accretion rate . For our observed temperatures of 4-5.6 keV, the corresponding accretion rate is . Fallback s after a supernova or GRB explosion has been calculated for a range of progenitors and explosion energies (MacFadyen et al., 2001; Wong et al., 2014). Fallback at late times follows a simple power law (Chevalier, 1989) and depends on the progenitor and the explosion energy of the supernova associated with the GRB. Most fallback calculations (MacFadyen et al., 2001; Wong et al., 2014) predict fallback rates of at s for supernova explosions of .
Our accretion rates imply a luminosity near times the Eddington limit for a stellar mass black hole. Although such extreme super-Eddington emission rates have been invoked from fallback (Dexter & Kasen, 2013), the exact nature of such transient accretion is not well known. Steady-state solutions of disk accretion find that maintaining emission rates even an order of magnitude above Eddington is difficult (Jaroszynski et al., 1980). Whether such steady state limits apply in transient situations like our fallback disk remains to be seen (Abramowicz, 2005). Thus without a full model of these transient events, we are not able to establish a self-consistent explanation for the blackbody emission.
4.5. Hard Power Law
Finally, we considered a two power law model (PLPL) like that reported for GRB 111209A (Stratta et al., 2013). This model is a slightly worse fit in both epochs than the BBPL model for the same number of free parameters (Table 1).
Stratta et al. (2013) interpret the very hard () second PL component they report for GRB 111209A at 70 ksec after the burst as the tail of the hard power-law emission sometimes observed by Fermi-LAT (e.g., Zhang et al., 2011, and references therein). This component is detected in the late prompt and early afterglow phases and decays according to a powerlaw; its physical origin remains uncertain. The non-detection by LAT of both GRBs complicates this interpretation. An extrapolation of our Epoch 1 powerlaw flux to the 0.1–10 GeV band gives a photon flux of photons cm-2 s-1, a value higher than the upper limit of photons cm-2 s-1 reported by Kocevski et al. (2013) in the first 2 ksec after the burst, when the afterglow—and thus presumably the hard component—was much brighter. The problem is even more severe for the component reported by Stratta et al. (2013): its higher flux and much harder spectral index extrapolate to a 0.1–10 GeV photon flux of 1.5 photons cm-2 s-1, an extremely high value sufficient to trigger LAT. We examined the late-time LAT data for both bursts and confirm no excess emission. Consistency with the nondetection by LAT in both cases thus requires a cutoff above the NuSTAR and XMM bandpasses but below the the LAT bandpass at 30 MeV. This phenomenological model is plausible, but the connection of these components to the early-time hard power-law components detected by LAT in other GRBs therefore remains speculative.
| NuSTAR & Swift Epoch 1 | NuSTAR & Chandra Epoch 2 | |||||||
|---|---|---|---|---|---|---|---|---|
| Parameter | PL | gabsPL | BBPL | PLPL | PL | gabsPL | BBPL | PLPL |
| ( cm-2) | 2.55 | 2.71 | 3.32 | 3.35 | 1.980.14 | 2.82 | 2.74 | 3.02 |
| 3.330.13 | 3.29 | 3.96 | 4.02 | 3.060.11 | 3.95 | 3.86 | 4.37 | |
| 1.28 | 1.65 | |||||||
| (keV) | 5.89 | |||||||
| (keV) | 1.75 | 5.15 | ||||||
| 0.73 | 2.8 | |||||||
| (comoving frame, keV) | 5.58 | 4.02 | ||||||
| / | 146.8/92 | 98.1/89 | 103.1/90 | 105.9/90 | 288.8/132 | 158.9/129 | 157.7/130 | 161.0/130 |
| 2.5E-4 | 0.23 | 0.16 | 0.12 | 1.0E-13 | 0.04 | 0.05 | 0.03 | |
4.6. Component significance
We verified the significance of the additional spectral components using Monte Carlo simulations according to the method of posterior predictive p-values (ppp-values; Protassov et al., 2002). We initialized each fit by stepping the additional feature through a grid in energy and finding the largest relative improvement in (c.f. Hurkett et al., 2008). This procedure accounts for the “look-elsewhere” effect of multiple trials, as we have no a priori expectation of the observed line energy or component temperature. In none of our simulated realizations of a null PL model did fits with alternative models (gabsPL, BBPL, or PLPL) produce improvements in as large as observed in the real data. This implies that the spectral features are significant at in both epochs: the improvement for each model fit is extremely unlikely to be due to chance if the true underlying model were simply an absorbed PL.
5. Conclusion
Our late-time afterglow observations of GRB 130925A require an additional spectral component at high significance. Several alternative models provide acceptable fits to the data. These spectral features are detected more than 1 Msec after the burst, much later than any components previously reported in X-ray afterglows, probing a largely unexplored phase of afterglow evolution. Several unique features of GRB 130925A make it possible to detect these late-time features for the first time. The unusually bright afterglow enables high-quality spectral fits, and NuSTAR has excellent sensitivity at the relevant energies and can constrain the continuum above 10 keV. Moreover, the primary power law is unusually soft, so the high-energy component is not swamped. It is not yet clear whether this emission is related to progenitor physics unique to this unusual, ultra-long burst; NuSTAR observations of the bright “canonical” long GRB 130427A were consistent with emission by a single spectral component (Kouveliotou et al., 2013). Future observations of bright afterglows will be needed to determine the prevalence of these late-time spectral components and identify the relevant emission mechanism.
References
- Abramowicz (2005) Abramowicz, M. A. 2005, in Growing Black Holes: Accretion in a Cosmological Context, ed. A. Merloni, S. Nayakshin, & R. A. Sunyaev, 257
- Amati et al. (2000) Amati, L., Frontera, F., Vietri, M., et al. 2000, Science, 290, 953
- Bellm et al. (2013) Bellm, E. C., Harrison, F. A., Forster, K., et al. 2013, GRB Coordinates Network, 15286, 1
- Bloom et al. (2011) Bloom, J. S., Giannios, D., Metzger, B. D., et al. 2011, Science, 333, 203
- Burrows et al. (2013) Burrows, D. N., Malesani, D., Lien, A. Y., Cenko, S. B., & Gehrels, N. 2013, GRB Coordinates Network, 15253, 1
- Burrows et al. (2011) Burrows, D. N., Kennea, J. A., Ghisellini, G., et al. 2011, Nature, 476, 421
- Campana et al. (2006) Campana, S., Mangano, V., Blustin, A. J., et al. 2006, Nature, 442, 1008
- Cenko et al. (2012) Cenko, S. B., Krimm, H. A., Horesh, A., et al. 2012, ApJ, 753, 77
- Chevalier (1989) Chevalier, R. A. 1989, ApJ, 346, 847
- Dexter & Kasen (2013) Dexter, J., & Kasen, D. 2013, ApJ, 772, 30
- Evans et al. (2013) Evans, P. A., Pagani, C., Page, K. L., et al. 2013, GRB Coordinates Network, 15254, 1
- Fitzpatrick & the Fermi GBM Team (2013) Fitzpatrick, G., & the Fermi GBM Team. 2013, GRB Coordinates Network, 15255, 1
- Friis & Watson (2013) Friis, M., & Watson, D. 2013, ApJ, 771, 15
- Fryer (2009) Fryer, C. L. 2009, ApJ, 699, 409
- Gendre et al. (2013) Gendre, B., Stratta, G., Atteia, J. L., et al. 2013, ApJ, 766, 30
- Golenetskii et al. (2013) Golenetskii, S., Aptekar, R., Frederiks, D., et al. 2013, GRB Coordinates Network, 15260, 1
- Harrison et al. (2013) Harrison, F. A., Craig, W. W., Christensen, F. E., et al. 2013, ApJ, 770, 103
- Hurkett et al. (2008) Hurkett, C. P., Vaughan, S., Osborne, J. P., et al. 2008, ApJ, 679, 587
- Jaroszynski et al. (1980) Jaroszynski, M., Abramowicz, M. A., & Paczynski, B. 1980, Acta Astron., 30, 1
- Kalberla et al. (2005) Kalberla, P. M. W., Burton, W. B., Hartmann, D., et al. 2005, A&A, 440, 775
- Kocevski et al. (2013) Kocevski, D., Racusin, J., Vianello, G., Axelsson, M., & Omodei, N. 2013, GRB Coordinates Network, 15268, 1
- Komatsu et al. (2011) Komatsu, E., Smith, K. M., Dunkley, J., et al. 2011, ApJS, 192, 18
- Kouveliotou et al. (2013) Kouveliotou, C., Granot, J., Racusin, J. L., et al. 2013, ApJ, 779, L1
- Levan et al. (2011) Levan, A. J., Tanvir, N. R., Cenko, S. B., et al. 2011, Science, 333, 199
- Levan et al. (2013) Levan, A. J., Tanvir, N. R., Starling, R. L. C., et al. 2013, ArXiv e-prints, arXiv:1302.2352 [astro-ph.HE]
- Lien et al. (2013) Lien, A. Y., Markwardt, C. B., Page, K. L., et al. 2013, GRB Coordinates Network, 15246, 1
- MacFadyen et al. (2001) MacFadyen, A. I., Woosley, S. E., & Heger, A. 2001, ApJ, 550, 410
- Markwardt et al. (2013) Markwardt, C. B., Barthelmy, S. D., Baumgartner, W. H., et al. 2013, GRB Coordinates Network, 15257, 1
- Nakauchi et al. (2013) Nakauchi, D., Kashiyama, K., Suwa, Y., & Nakamura, T. 2013, ApJ, 778, 67
- Piro et al. (2000) Piro, L., Garmire, G., Garcia, M., et al. 2000, Science, 290, 955
- Protassov et al. (2002) Protassov, R., van Dyk, D. A., Connors, A., Kashyap, V. L., & Siemiginowska, A. 2002, ApJ, 571, 545
- Reeves et al. (2002) Reeves, J. N., Watson, D., Osborne, J. P., et al. 2002, Nature, 416, 512
- Sako et al. (2005) Sako, M., Harrison, F. A., & Rutledge, R. E. 2005, ApJ, 623, 973
- Savchenko et al. (2013) Savchenko, V., Beckmann, V., Ferrigno, C., et al. 2013, GRB Coordinates Network, 15259, 1
- Sparre & Starling (2012) Sparre, M., & Starling, R. L. C. 2012, MNRAS, 427, 2965
- Starling et al. (2012) Starling, R. L. C., Page, K. L., Pe’Er, A., Beardmore, A. P., & Osborne, J. P. 2012, MNRAS, 427, 2950
- Stratta et al. (2013) Stratta, G., Gendre, B., Atteia, J. L., et al. 2013, ApJ, 779, 66
- Sudilovsky et al. (2013a) Sudilovsky, V., Kann, D., Greiner, J., & GROND team. 2013a, GRB Coordinates Network, 15247, 1
- Sudilovsky et al. (2013b) Sudilovsky, V., Kann, D., Schady, P., et al. 2013b, GRB Coordinates Network, 15250, 1
- Suzuki & Shigeyama (2013) Suzuki, A., & Shigeyama, T. 2013, ApJ, 764, L12
- Suzuki et al. (2013) Suzuki, K., Sakakibara, H., Negoro, H., et al. 2013, GRB Coordinates Network, 15248, 1
- Tanvir et al. (2013) Tanvir, N. R., Levan, A. J., Hounsell, R., et al. 2013, GRB Coordinates Network, 15489, 1
- Thöne et al. (2011) Thöne, C. C., de Ugarte Postigo, A., Fryer, C. L., et al. 2011, Nature, 480, 72
- Vreeswijk et al. (2013) Vreeswijk, P. M., Malesani, d., Fynbo, J. P. U., De Cia, A., & Ledoux, C. 2013, GRB Coordinates Network, 15249, 1
- Wong et al. (2014) Wong, T.-W., Fryer, C. L., Ellinger, C. I., Rockefeller, G., & Kalogera, V. 2014, ArXiv e-prints, arXiv:1401.3032 [astro-ph.HE]
- Woosley & Heger (2012) Woosley, S. E., & Heger, A. 2012, ApJ, 752, 32
- Zhang et al. (2013) Zhang, B.-B., Zhang, B., Murase, K., Connaughton, V., & Briggs, M. S. 2013, ArXiv e-prints, arXiv:1310.2540 [astro-ph.HE]
- Zhang et al. (2011) Zhang, B.-B., Zhang, B., Liang, E.-W., et al. 2011, ApJ, 730, 141