Amplitude variability in satellite photometry of the non-radially pulsating O9.5 V star Oph
Abstract
We report a time-series analysis of satellite photometry of the non-radially pulsating Oe star Oph, principally using data from SMEI obtained 2003–2008, but augmented with MOST and WIRE results. Amplitudes of the strongest photometric signals, at 5.18, 2.96, and 2.67 , each vary independently over the -year monitoring period (from 30 to 2 mmag at 5.18 ), on timescales of hundreds of days. Signals at 7.19 and 5.18 have persisted (or recurred) for around two decades. Supplementary spectroscopic observations show an H emission episode in 2006; this coincided with small increases in amplitudes of the three strongest photometric signals.
keywords:
Asteroseismology, techniques: photometric, stars: oscillations, stars: emission line, Be, stars: activity, stars:individual: Oph1 Introduction
Oph111HD 149757 is the nearest O-type star, and one of the brightest ( mas, van Leeuwen 2007; O9.5 Vnn, , Sota et al. 2011). Detailed spectroscopic investigations of velocity-resolved absorption-line structure have been facilitated by its brightness and exceptionally rapid rotation ( ; Howarth & Smith 2001, Villamariz & Herrero 2005); periodic line-profile variability, discovered by Walker et al. (1979), has subsequently been widely interpreted in terms of non-radial pulsations (NRP; Vogt & Penrod 1983, Reid et al. 1993, Kambe et al. 1997). H emission episodes lasting, typically, several weeks have been observed to occur every few years (e.g., Ebbets 1981; Kambe et al. 1993); the inferred circumstellar decretion disk is probably causally associated with rapid rotation, and possibly with NRP (Cranmer, 2009), though the latter remains a open issue.
Spectroscopic line-profile variability associated with NRP is primarily sensitive to sectoral pulsation modes (since tesseral modes readily lead to cancellation in velocity space). Moreover, the requirements of high signal-to-noise ratio and high resolution typically limit spectroscopic time series to only a few nights, resulting in further detection biases, towards short periods and large amplitudes. These observational constraints contrast with satellite-based photometry, which can yield precise measurements over an extended time period, thereby affording the opportunity to investigate pulsation characteristics in a parameter space inaccessible to spectroscopic study. For Oph, this opportunity was exploited by Walker et al. (2005), who found a number of periodic signals in 24 days of high-cadence, near-continuous photometry from the Microvariability and Oscillations of STars (MOST) satellite. Here we report new results from the Solar Mass Ejection Imager (SMEI) and Wide-field InfraRed Explorer (WIRE) missions; for completeness, we also include our independent re-analysis of the MOST data.
2 Observations
An overview of the time sampling is provided by Table 1 and Fig. 1, while the data quality is illustrated in Fig. 2. Although of somewhat lower cadence and accuracy than the other datasets, the SMEI observations are noteworthy in that they span six years, with approximately eight months’ almost continuous coverage annually, allowing us to examine the long-term behaviour of periodic signals, presumed to arise from pulsations.
| Satellite | Observation Period | Satellite | Observation Period | ||
|---|---|---|---|---|---|
| SMEI | 2003 Feb 10 – Sept 25 | 1467 | WIRE | 2004 Feb 18 – Feb 27 | 6663 |
| SMEI | 2004 Feb 7 – Sept 25 | 2473 | WIRE | 2005 Aug 28 – Sept 30 | 40739 |
| SMEI | 2005 Feb 6 – Sept 25 | 2255 | WIRE | 2006 Aug 8 – Sept 9 | 28113 |
| SMEI | 2006 Feb 6 – Sept 26 | 2194 | |||
| SMEI | 2007 Feb 7 – Sept 25 | 2340 | MOST | 2004 May 18 – June 11 | 9084 |
| SMEI | 2008 Feb 7 – Aug 1 | 2101 |

2.1 SMEI
SMEI was one of two instruments on the Coriolis satellite, launched on 2003 January 6; data acquisition ceased on 2011 Sept 28. Designed to detect and forecast coronal mass ejections moving towards the Earth, SMEI had three imaging cameras, but camera 3 suffered a relatively high-temperature state, and as a result the quality of its photometric data is relatively poor. Here we only use results from cameras 1 and 2.
SMEI was capable of measuring millimagnitude variability down to . The optical system was unfiltered, so the passband was dominated by the spectral response of the CCDs: the quantum efficiency peaked at 45% at 700 nm, falling to 10% at 460 and 990 nm. The cameras each had a field of view of 60∘ 3∘, and were mounted such that they scanned nearly the entire sky every 101 minutes. The duty cycle for the Oph time series is 46.6%, a typical value for SMEI photometry. Our Oph analysis uses data from six seasons, spanning years (Table 1), after which there is a falloff in data quality.
The SMEI instrument is fully described by Eyles et al. (2003), and a brief description of the data reduction can be found in Spreckley & Stevens (2008); other SMEI-based photometric investigations include studies of Boo, UMi, Dor, Eri, Cepheid variables, and the magnetic CP star CU Vir (Tarrant et al., 2007, 2008a, 2008b; Goss et al., 2011; Berdnikov & Stevens, 2010; Pyper et al., 2013).

2.2 WIRE
The WIRE satellite was launched in 1999. Its main infrared camera never came into operation due to loss of coolant soon after launch, but the star tracker was successfully employed from 1999 to 2006 to measure precise light-curves of bright stars, in a passband roughly corresponding to , determined by the CCD response (Bruntt & Buzasi, 2006; Bruntt & Southworth, 2008). WIRE observed Oph in three runs, and we extracted photometry using the WIRE pipeline (Bruntt et al., 2005).
2.3 MOST
3 Time-series Analysis
All SMEI photometry shows long-term variations of instrumental origin (e.g., Goss et al. 2011). These were removed with a ten-day running-mean filter, and a time-series analysis performed on the corrected data using Period04 (Lenz & Breger, 2005). Fig. 3 shows the date-corrected discrete-fourier-transform amplitude spectrum (Ferraz-Mello 1981); although the formal Nyquist frequency imposed by the orbital period is 7.086 , the window function is very clean, and useful information can be extracted at somewhat shorter periods (into the frequency domain explored by spectroscopic investigations). However, it is clear from Fig. 3 (and from other SMEI-based analyses) that the Sun-synchronous orbit of the satellite generates signals at frequencies of 1 d-1 and multiples thereof. Any astrophysical signals which occur at these frequencies cannot be reliably identified in the SMEI data alone.
3.1 Summary of frequencies
‘Significant’ astrophysical signals (those with S/N4 in the full SMEI dataset) are summarised in Table 2, where the tabulated errors on the frequencies and amplitudes have been calculated from Monte-Carlo simulations. The 7.19 signal identified spectroscopically by Reid et al. (1993) and Kambe et al. (1997), from observations obtained in 1989 and 1993, respectively, is present in the photometry (and has therefore persisted for, or recurred over, two decades), but none of the longer-period signals they report is recovered, with upper limits of 0.1–0.2 mmag. Walker et al. (2005) report additional signals at 4.49, 5.18, and 6.72 in their spectroscopy (and MOST photometry); signals at these frequencies are also present in the SMEI results, although the last two are detected at only 2–3 significance.
The WIRE and MOST time series have been analysed in the same way, with results included in Table 2. The frequencies found in all three datasets are generally in good agreement, though not all frequencies are detectable at all epochs. In a few cases there are formally statistically significant differences in frequencies from different datasets, but it is not clear that these are astrophysically significant. For example, the 5.18 frequency in the 2006 WIRE dataset appears to be marginally lower than found in the full SMEI and MOST results, but the 2006 SMEI data alone, although of poorer quality than the WIRE results, support a higher value. Our interpretation of the data is, therefore, that there is no compelling evidence for variations in frequency for a given signal. To support this view, we show the power spectra season by season in Fig. 4. Essentially identical frequencies recur each year, but with large variations in amplitude.

3.2 Amplitude variability
| SMEI 2003–8 | WIRE 2004 | MOST 2004 | WIRE 2005 | WIRE 2006 | |||||
| Frequency | Amplitude | Frequency | Amplitude | Frequency | Amplitude | Frequency | Amplitude | Frequency | Amplitude |
| (d-1) | (mmag) | (d-1) | (mmag) | (d-1) | (mmag) | (d-1) | (mmag) | (d-1) | (mmag) |
| 1.165(2) | 1.77(5) | – | – | – | – | – | – | ||
| – | – | – | – | – | – | 1.2537(2) | 2.82(3) | ||
| – | – | – | – | – | – | 1.3549(3) | 2.02(3) | ||
| – | – | – | – | – | – | 1.4480(2) | 3.40(3) | ||
| – | – | – | – | 2.0385(2) | 1.13(1) | – | – | ||
| – | – | – | – | – | – | 2.3816(4) | 1.54(3) | ||
| – | – | – | – | 2.4334(3) | 0.90(1) | 2.4297(2) | 2.55(3) | ||
| – | – | – | – | – | – | 2.6269(2) | 2.43(3) | ||
| 2.67137(2) | 4.3(3) | 2.648(1) | 2.16(5) | 2.6762(4) | 2.24(4) | 2.6706(1) | 1.86(1) | 2.6800(1) | 4.63(3) |
| – | – | – | – | – | – | 2.7014(1) | 4.31(3) | ||
| – | – | – | – | – | – | 2.8060(2) | 3.51(3) | ||
| 2.96041(2) | 4.0(3) | – | – | 2.953(1) | 0.76(4) | 2.96120(5) | 5.32(1) | 2.9581(3) | 2.31(3) |
| – | – | 3.0153(8) | 1.11(4) | – | – | – | – | ||
| 3.05498(3) | 5.1(3) | 3.085(2) | 1.49(5) | 3.0481(6) | 1.50(4) | 3.0557(3) | 0.90(1) | 3.0578(4) | 1.51(3) |
| – | – | – | – | 3.7588(2) | 1.16(1) | – | – | ||
| 4.49194(5) | 1.3(2) | – | – | 4.4906 (8) | 1.07(4) | – | – | – | – |
| – | – | – | – | 4.7092(5) | 0.53(1) | – | – | ||
| – | – | – | – | 4.8650(5) | 0.53(1) | – | – | ||
| 5.18082(1) | 5.1(3) | 5.1796(5) | 6.68(5) | 5.1805(1) | 7.22(4) | – | – | 5.1760(8) | 1.32(3) |
| 5.371(2) | 0.9(4) | – | – | 5.371(1) | 0.70(4) | – | – | – | – |
| 6.719(8) | 1.0(3) | – | – | 6.7209(7) | 1.28(4) | – | – | – | – |
| 7.19196(5) | 2.0(3) | 7.205(4) | 1.6(1) | 7.196(3) | 0.85(9) | 7.1917(7) | 0.83(3) | 7.20(2) | 0.9(1) |

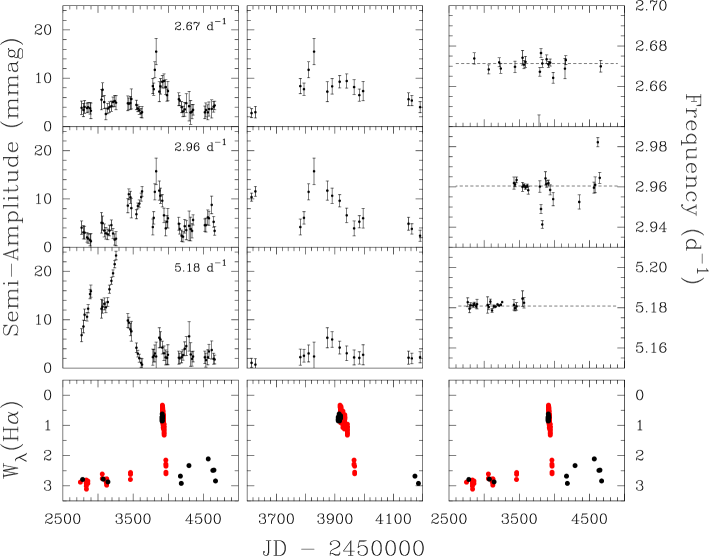
We take advantage of the long, uniform time series obtained by SMEI to examine these changes in amplitude in greater detail. Fig. 5 shows the semi-amplitudes (and periods) determined from 50-d data segments, at 25-d steps, for the strongest signals in the SMEI photometry. As already evident from Fig. 4, variability in signal amplitude on timescales of order hundreds of days is the norm; most clearly, the signal at 5.18 has a large amplitude during 2003 and 2004, but becomes practically undetectable over the course of the 2005 observing season, remaining at a very low level for the remainder of the period under consideration. (These conclusions are not artefacts of the data; the noise level and fill factor of the SMEI data show no important changes over this time interval, and the WIRE results exhibit the same trends, though in less detail.)
In principle, it would be of obvious interest to investigate the phase stability of the signals; in practice, the phasing errors across the extensive timespan studied here are too large to allow firm conclusions in this regard, other than to state that there is no evidence for significant phase drift.
4 Discussion
4.1 Signal duration
The strongest signal found here, at 5.18 (463), was first reported by Balona (1992), whose ground-based Strömgren photometry indicated a semi-amplitude of 001 in 1985. He was unable to recover this period in subsequent, relatively sparse, observations from the 1987–90 seasons, concluding both that there was no periodicity that lasted more than one season, and that the short-period variations were not stable.
The extensive, high-quality satellite photometry now available allows us to revise these conclusions; signal amplitudes are indeed strongly variable, on timescales , but, while undetectable at some epochs, the same periods may be recoverable in datasets separated by two decades. Balona (1992) also found a 2.66 signal (among other tentative identifications) in 1989 observations; this very probably matches the 2.67 signal observed in the SMEI, WIRE and MOST datasets, again emphasizing that at least some signals may be present over decades (cf. 7.19 ; 3.1), though whether they persist continuously, sometimes below detection thresholds, remains moot.
4.2 Emission-line episode
Spectroscopy that is contemporaneous with our photometry is available in the BeSS archive (Neiner et al. 2011; dispersions of 0.1–0.3 Å/pixel) and from Ondřejov Observatory (Harmanec, personal communication; 0.25 Å/pixel); the formal signal-to-noise ratios are typically a few hundred per sample. We have corrected these spectra for absorption in the Earth’s atmosphere by division by a scaled high-resolution reference telluric spectrum before measuring equivalent widths.
The data show that Oph underwent an emission episode in summer 2006, similar to that illustrated by Ebbets (1981, his Fig. 1). Our H equivalent-width measurements are included in Fig. 5. There is a suggestion that the emission-line episode may have been accompanied (or slightly preceded) by simultaneous small increases in the amplitudes of the 2.67, 2.96, and 5.18 signals. Unfortunately, with only one known emission-line episode during the course of our observations, it is not possible to draw firm conclusions from this coincidence; nevertheless, it is suggestive that the two lower frequencies attained the greatest amplitudes recorded in our photometry at that time.
The largest amplitudes, and largest changes in amplitude, are recorded for the higher-frequency 5.18 photometric signal, and there is no clear association between that signal and any emission-line activity. However, Walker et al. (2005) showed that this frequency could very plausibly correspond to a first-overtone radial mode (exciting non-radial modes that give rise to the spectroscopic line-profile variability). The potential pulsation mechanism for producing decretion disks discussed by Cranmer (2009; see also Ando 1986) relies on the injection of angular momentum into the upper atmosphere by non-radial modes. Although there are as yet no mode identifications for the 2.67 and 2.96 signals (which do not have published spectroscopic counterparts), it therefore remains plausible that the emission-line episode could be causally associated with increases in amplitudes of non-radial modes.
5 Conclusion
Data from the SMEI, WIRE, and MOST satellites have been analysed to investigate periodic signals in broad-band optical photometry of the Oe star Oph obtained over a span of almost 6 years. We confirm multiperiodic variability at the 10 mmag level and, for the first time, track systematic changes in signal amplitudes on timescales of order d; some signals, while not continuously detectable, are nevertheless present in observations separated by 20 years. There is tentative evidence of a photometric signature of the 2006 emission-line episode; although no direct correspondence is evident between overall photometric and spectroscopic activity, this may reflect different roles of radial and non-radial modes in the formation of a decretion disk.
Acknowledgements
KJFG, IRS, WJC, and YE acknowledge the support of STFC. IDH is a Jolligoode Fellow. This work has made use of the BeSS database, operated at the Observatoire de Meudon; we thank the contributing observers (C. Buil, J. Guarroflo, C. Neiner, E. Pollmann, and O. Thizy), together with Petr Harmanec, who kindly provided spectra from Ondřejov, and Steve Spreckley, who assisted with the SMEI data reduction. Our anonymous referee’s remarks were constructively stimulating.
References
- Ando (1986) Ando H., 1986, A&A, 163, 97
- Balona (1992) Balona L. A., 1992, MNRAS, 254, 404
- Berdnikov & Stevens (2010) Berdnikov L. N., Stevens I. R., 2010, in C. Sterken, N. Samus, & L. Szabados ed., Variable Stars, the Galactic halo and Galaxy Formation Search for Random Fluctuations in Periods of Short-period Cepheids. p. 207
- Bruntt & Buzasi (2006) Bruntt H., Buzasi D. L., 2006, MemSAI, 77, 278
- Bruntt et al. (2005) Bruntt H., Kjeldsen H., Buzasi D. L., Bedding T. R., 2005, ApJ, 633, 440
- Bruntt & Southworth (2008) Bruntt H., Southworth J., 2008, Journal of Physics Conference Series, 118, 01201
- Cranmer (2009) Cranmer S. R., 2009, ApJ, 701, 396
- Ebbets (1981) Ebbets D., 1981, PASP, 93, 119
- Eyles et al. (2003) Eyles C. J., Simnett G. M., Cooke M. P., Jackson B. V., Buffington A., Hick P. P., Waltham N. R., King J. M., Anderson P. A., Holladay P. E., 2003, Solar Physics, 217, 319
- Ferraz-Mello (1981) Ferraz-Mello S., 1981, AJ, 86, 619
- Goss et al. (2011) Goss K. J. F., Karoff C., Chaplin W. J., Elsworth Y., Stevens I. R., 2011, MNRAS, 411, 162
- Howarth & Smith (2001) Howarth I. D., Smith K. C., 2001, MNRAS, 327, 353
- Kambe et al. (1993) Kambe E., Ando H., Hirata R., 1993, A&A, 273, 435
- Kambe et al. (1997) Kambe E., Hirata R., Ando H., Cuypers J., Katoh M., Kennelly E. J., Walker G. A. H., Stefl S., Tarasov A. E., 1997, ApJ, 481, 406
- Lenz & Breger (2005) Lenz P., Breger M., 2005, Communications in Asteroseismology, 146, 53
- Montgomery & O’Donoghue (1999) Montgomery M. H., O’Donoghue D., 1999, Delta Scuti Star Newsletter, 13, 28
- Neiner et al. (2011) Neiner C., de Batz B., Cochard F., Floquet M., Mekkas A., Desnoux V., 2011, AJ, 142, 149
- Pyper et al. (2013) Pyper D. M., Stevens I. R., Adelman S. J., 2013, MNRAS, 431, 2106
- Reid et al. (1993) Reid A. H. N., Bolton C. T., Crowe R. A., Fieldus M. S., Fullerton A. W., Gies D. R., Howarth I. D., McDavid D., Prinja R. K., Smith K. C., 1993, ApJ, 417, 320
- Sota et al. (2011) Sota A., Maíz Apellániz J., Walborn N. R., Alfaro E. J., Barbá R. H., Morrell N. I., Gamen R. C., Arias J. I., 2011, ApJS, 193, 24
- Spreckley & Stevens (2008) Spreckley S. A., Stevens I. R., 2008, MNRAS, 388, 1239
- Tarrant et al. (2007) Tarrant N. J., Chaplin W. J., Elsworth Y., Spreckley S. A., Stevens I. R., 2007, MNRAS, 382, L48
- Tarrant et al. (2008a) Tarrant N. J., Chaplin W. J., Elsworth Y., Spreckley S. A., Stevens I. R., 2008a, A&A, 483, L43
- Tarrant et al. (2008b) Tarrant N. J., Chaplin W. J., Elsworth Y. P., Spreckley S. A., Stevens I. R., 2008b, A&A, 492, 167
- van Leeuwen (2007) van Leeuwen F., 2007, A&A, 474, 653
- Villamariz & Herrero (2005) Villamariz M. R., Herrero A., 2005, A&A, 442, 263
- Vogt & Penrod (1983) Vogt S. S., Penrod G. D., 1983, ApJ, 275, 661
- Walker et al. (2003) Walker G., Matthews J., Kuschnig R., Johnson R., Rucinski S., Pazder J., Burley G., et al., 2003, PASP, 115, 1023
- Walker et al. (2005) Walker G. A. H., Kuschnig R., Matthews J. M., Reegen P., Kallinger T., Kambe E., et al., 2005, ApJL, 623, L145
- Walker et al. (1979) Walker G. A. H., Yang S., Fahlman G. G., 1979, ApJ, 233, 199