STRUCTURE AND MORPHOLOGY OF X-RAY SELECTED AGN HOSTS AT IN CANDELS-COSMOS FIELD
Abstract
We analyze morphologies of the host galaxies of 35 X-ray selected active galactic nucleus (AGNs) at in the Cosmic Evolution Survey (COSMOS) field using Hubble Space Telescope/WFC3 imaging taken from the Cosmic Assembly Near-infrared Deep Extragalactic Legacy Survey (CANDELS). We build a control sample of 350 galaxies in total, by selecting ten non-active galaxies drawn from the same field with the similar stellar mass and redshift for each AGN host. By performing two dimensional fitting with GALFIT on the surface brightness profile, we find that the distribution of Sérsic index (n) of AGN hosts does not show a statistical difference from that of the control sample. We measure the nonparametric morphological parameters (the asymmetry index A, the Gini coefficient G, the concentration index C and the index) based on point source subtracted images. All the distributions of these morphological parameters of AGN hosts are consistent with those of the control sample. We finally investigate the fraction of distorted morphologies in both samples by visual classification. Only of the AGN hosts have highly distorted morphologies, possibly due to a major merger or interaction. We find there is no significant difference in the distortion fractions between the AGN host sample and control sample. We conclude that the morphologies of X-ray selected AGN hosts are similar to those of nonactive galaxies and most AGN activity is not triggered by major merger.
Subject headings:
galaxies: active — X-rays: galaxies — galaxies: high-redshift — galaxies: structure1. Introduction
There is a long-standing question about what triggers AGN activity. Even up till now, fifty years after quasars (QSOs, i.e. luminous AGNs) have been discovered (Schmidt 1963), there is no convincing answer yet. Major merger is a preferred candidate under the framework of hierarchical structure formation (e.g. Hopkins et al. 2006). Other secular mechanisms, such as minor merger, disk/bar instabilities, colliding clouds, supernova explosions, have also been proposed to fuel black hole accretion and trigger AGN activity (see Kormendy & Kennicutt 2004; Martini 2004; Jogee 2006 for reviews).
One possible approach is to analyze morphologies of AGN host galaxies and compare them with those of non-active galaxies. However, most morphological analysis of AGN hosts can be seriously biased if AGNs contribute significantly the total flux (e.g. Gabor et al. 2009; Pierce et al. 2010; Bhm et al. 2013). A high-resolution image and a careful decomposition of a point-like source and AGN host will be necessary. Until recently, with the advent of Hubble Space Telescope (HST), such morphological analyses for large AGN samples at and in the rest-frame optical have been taken with Advanced Camera for Surveys (ACS) and Wide Field Camera 3 (WFC3), respectively.
Previous studies have found different results. At low redshift (), some works found a significant fraction of AGNs have bulge-dominated morphologies from a non-parametric classification (e.g. Grogin et al. 2005; Pierce et al. 2007), which could be biased by the point-source component which is not removed in these studies. While other works with a careful point-source removal found that AGN hosts show a wide range of morphologies between bulge and disk dominated (Gabor et al. 2009) or over half of them have a significant disk component (Cisternas et al. 2011). In these studies, no enhancement of merger or interaction signatures have been found in AGN hosts by comparing them with control samples. Urrutia et al. (2008), however, found a high merger fraction (11 out of 13 in their luminous red QSOs sample). This may lead to an explanation that merger fraction is dependent on AGN luminosity (Treister et al. 2012, but see also Villforth et al. 2013). At , AGN hosts seem to be disk-dominated with a similar merger fraction as those of nonactive galaxies (Schawinski et al. 2011,2012; Simmons et al. 2012) or have a significant fraction of disk galaxies with bulge component (Kocevski et al. 2012).
In this Letter we take the comprehensive structural and morphological analyses of X-ray selected AGN host galaxies in the CANDELS-COSMOS field using HST/WFC3 H-band imaging at . We try to find whether there is a special morphological type which AGN hosts prefer to belong to. And we examine whether there is a significant difference of morphological properties between AGN hosts and control samples. In section 2, we describe our sample selections of X-ray selected AGN and control samples. In section 3, we describe the methods to measure the morphological parameters. We at first perform two dimensional light profile fitting with GALFIT using a Sérsic model representing host galaxy contribution and a PSF model representing the point source contribution. Then based on the point source subtracted images, we compute the nonparametric morphological parameters. Finally we perform the visual classification based on the H-band image and the residual image. In section 4, we give the main results of our morphological analyses. In section 5, we summarize and discuss our results. Throughout this letter, we assume a concordance CDM cosmology with , , Mpc-1.
2. Sample selection
We use the X-ray selected AGN catalog presented in Bongiorno et al. (2012). They selected AGNs from the XMM-COSMOS catalogue ( Cappelluti et al. 2009) with the optical identifications and multiwavelength properties as discussed by Brusa et al. (2010) and new photometric redshifts from Salvato et al. (2011). More than half of them have available spectroscopic redshifts. Bongiorno et al. (2012) also derived the host galaxy properties, such as colors and stellar masses, based on a two-component model fit of AGN and host galaxy spectral energy distributions (SEDs).
The central region of the COSMOS survey (Scoville et al. 2007) has been imaged with HST/WFC3 as part of CANDELS multi-cycle treasury programme (Grogin et al. 2011; Koekemoer et al. 2011). The HST WFC3/IR images have been prepared by drizzling the individual exposures onto a grid with rescaled pixel sizes of 60 mas (Koekemoer et al. 2011). We use the H-band (HST/WFC3 F160W filter) source catalogue presented in van der Wel et al. (2012) to match the X-ray selected AGN sample. With available spectroscopic or photometric redshifts, we select 37 AGNs with the H-band detections within the redshift range of . Among them, two sources lie on the edge of CANDELS-COSMOS field and therefore have been discarded for further morphological analysis. In total, we have 35 X-ray selected AGNs with H-band images. 13 out of 35 sources have been classified as Type1 (unobscured) AGNs and the rest 22 have been classified as Type 2 (obscured) according to optical spectra, X-ray luminosities and multiwavelength SEDs (Salvato et al. 2011). The high obscured fraction indicates that the light from the AGNs may be not significant at the rest frame optical band where we do the morphological analyses. 28 out of 35 sources have been detected in keV band and the rest has keV band detection. Their rest-frame keV luminosities (without absorption correction) have been derived using , where is the observed keV flux, is the luminosity distance and is the intrinsic AGN spectra index (e.g. Xue et al. 2011). For seven objects with only keV band detection, we derive their observed keV flux from by adopting an observed AGN spectra index (e.g. Xue et al. 2011). The of our sample have a range from erg s-1 to erg s -1 with a median value of erg s -1, about one order of magnitude higher than previous moderate-luminosity sample in the similar redshift range (e.g. Simmons et al. 2012; Kocevski et al. 2012). Stellar masses of host galaxies derived by SED fitting in Bongiorno et al. (2012) show most of them are massive, with an average value of .
To construct the control sample, we randomly select ten non-active galaxies from CANDELS-COSMOS H-band catalogue (van der Wel et al. 2012) for each AGN host. Here we use the photometric redshifts of non-active galaxies derived by Muzzin et al. (2013).We require that the selected non-active galaxies have similar stellar masses and redshift as the matched AGN host. We select those non-active galaxies with stellar masses within a factor of two and with redshift difference less than 0.5 compared to AGN host (i.e. log and ). Finally, 350 non-active galaxies in total meeting the criteria have been selected.
3. Structural and Morphological parameters
3.1. GALFIT analysis
We use the GALFIT package (Peng et al. 2002) to fit the surface brightness profiles of our AGN host and control samples. The fits are performed in the H-band cutouts images111http://www.mpia-hd.mpg.de/homes/vdwel/candels.html. As we did in our previous work (Fan et al. 2013a), we use empirical PSF instead of model PSF. We extract it from 43 stars with in the CANDELS-COSMOS field using PSFEx (Bertin 2011).
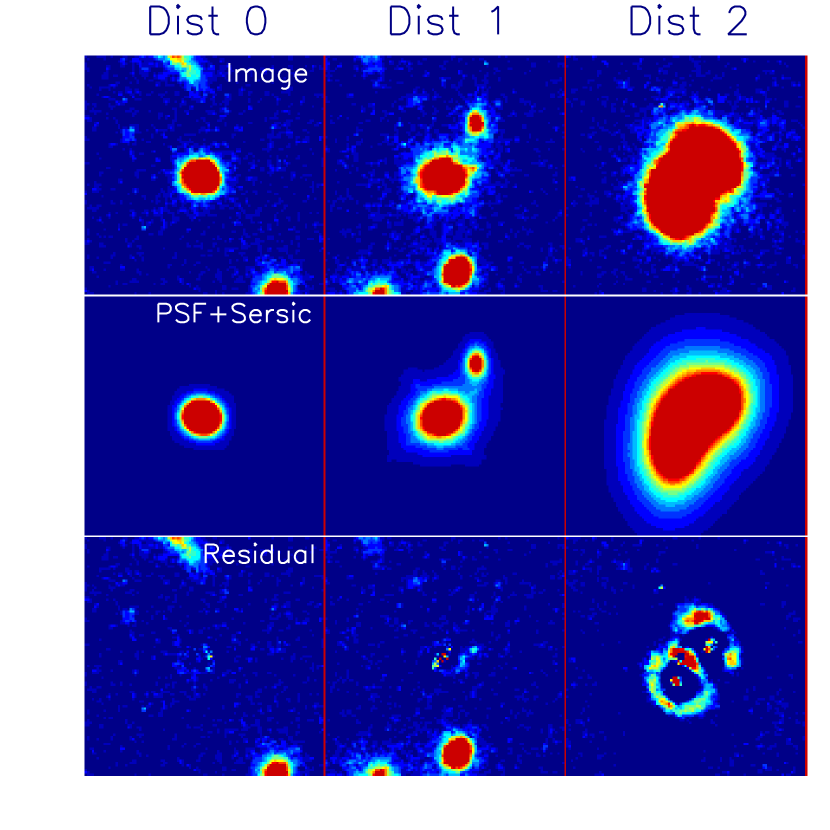
For the AGN host sample, we use a PSF to model the nuclear point source, plus a Sérsic function to model the host galaxy (See Figure 1). We constrain Sérsic index within a proper range (i.e. ). For those objects with nuclear point source dominant (6/35, defined by mag mag), the two-dimensional fitting with a Sérsic +PSF model will become very unreliable. We use a single PSF model instead for these objects. For the control sample, we use the structural parameters from van der Wel et al. (2012) which have been measured with a single Sérsic function.


3.2. Nonparametric Morphological Parameters
For AGN host and control samples, we also measure nonparametric morphological parameters, such as Gini coefficient (the relative distribution of the galaxy pixel flux values), (the second-order moment of the brightest 20% of the galaxy’s flux), concentration index (C) and rotational asymmetry index (A). Compared to Sérsic index, these parameters are model-independent and therefore can be applied to irregulars, as well as standard Hubble-type galaxies ( e.g., Abraham et al. 1996; Conselice 2003; Lotz et al. 2004; Kong et al. 2009, Fang et al. 2009, 2012; Wang et al. 2012).
For non-active galaxies in control sample, we measure these parameters using the original H-band images. While for AGN hosts, the case becomes a bit complicated. The presence of the highly symmetric nuclear point source will strongly bias all the measurements of host morphological parameters (Pierce et al. 2010; Bhm et al. 2013). Therefore we measure these parameters of AGN host galaxies with the same way as Gabor et al.(2009) did. We subtract the best-fit model nuclear point source derived in Section 3.1 from each AGN H-band image. For objects with nuclear point source dominant, we use residual images from our PSF-only-fit subtraction.
3.3. Visual Classification
Besides the structural and morphological parameters measurements of AGN host and control sample, we also investigate the merger or interaction fraction of AGN host and control samples via visual classification. Using the same method presented in Cisternas et al. (2011), all AGN host and non-active galaxies have been visually classified by five human classifiers independently, based on the H-band cutouts and residual images by subtracting the best-fit Sérsic +PSF model presented in Section 3.1. We use the same definition of “distortion class” in Cisternas et al. (2011) to describe the degree of distortion of the galaxy. There are three classes used in total: Dist 0, Dist 1 and Dist 2. Class “Dist 0” represents undisturbed and smooth galaxies, showing no interaction signatures. Class “Dist 1” represents galaxies with mild distortions, possibly due to minor merger or accretion. Class “Dist 2” represents galaxies with strong distortions, potential signs for ongoing or recent mergers. Illustrative examples of distortion classes can be found in Figure 1.
4. Results
In Figure 2, we plot the distributions of Sérsic index (left panel) and the physical effective radii (right panel) of AGN host and non-active galaxies. The objects with a dominant nuclear point source are not included in this plot. We compute the Kolmogorov-Smirnov (KS) test probabilities () which are 0.47 and 0.56 for the distributions of Sérsic indices and effective radii of the AGN host and control samples, respectively. The results are consistent with both Sérsic indices and effective radii of AGN hosts being drawn from the same distributions as the control sample.
The distribution of Sérsic indices of X-ray selected AGN host galaxies indicates a broad range of morphologies, from disk-dominated (), disk with a prominent bulge component (1.5n3.0) to bulge-dominated (). The fractions of disk-dominated, intermediate and bulge-dominated morphologies are 27.6%, 34.5% and 37.9%, respectively, in our AGN host galaxy sample. Disks (with and without a prominent bulge component) are the most common morphology in X-ray selected AGN host galaxies (close to two thirds of the entire sample), while there are also a significant fraction (more than one thirds of the entire sample) dominated by bulge. These fractions are quantitatively consistent with those of X-ray selected AGN host galaxies at redshifts (Gabor et al. 2009). However, some previous findings (e.g., Schawinski et al. 2011, Simmons et al. 2012) showed a higher fraction of X-ray selected AGN host galaxies in disk galaxies at similar redshift . They found that of X-ray selected AGN host galaxies with luminosities of erg s-1 erg s-1 had low Sérsic indices () indicative of disk dominated light profile. Compared to their results, AGN hosts in our sample have a lower fraction of disks and a higher fraction of bulge-dominated morphology. One possible explanation of the difference between our results is that AGN host morphology could vary with X-ray luminosity. The X-ray luminosities of our sample have an average value of erg s-1, about one order of magnitude higher than those in their previous works. Host galaxies of AGNs with higher X-ray luminosities may have a higher fraction of bulge-dominated morphology. This possibility has been tested and confirmed by an independent work of Kocevski et al. (2012) via visual inspection of a moderate-luminosity AGN sample at . They observed a dramatic rising in the bulge-dominated fraction: from 18.4% in the subsample with erg s-1 to 40.6% in the subsample with erg s-1. We notice that the bulge-dominated fraction () in their subsample with erg s-1 agrees well with that value in our result.

In Figure 3, we plot the distributions of four nonparametric morphological parameters (Gini, , concentration and asymmetry ) of AGN host and non-active galaxies. We perform a KS test to determine whether the AGN host and control sample populations are consistent with being drawn from the same underlying distribution. We find that all distributions of these parameters for AGN hosts have no difference to those of non-active galaxies, with KS test probabilities of 0.91,0.85,0.94 and 0.38 for Gini, , concentration and asymmetry, respectively. We notice that the nonparametric morphological parameters measurements of six objects with nuclear point source dominant are very uncertain. However, we find that the inclusion of these six objects or not will not change our main conclusion.
| Distortion Class | ||
|---|---|---|
| Dist-0 | 54.3% 10.1% | 57.1% 6.9% |
| Dist-1 | 30.9% 8.7% | 29.0% 5.3% |
| Dist-2 | 14.8% 2.4% | 13.9% 4.3% |
In Table 1, we summarize the mean fractions of three distortion classes in AGN host and control samples via visual classification. Several main results can be addressed:
-
1.
Over 50% of AGN host galaxies have undisturbed and smooth light profile, showing no evidence for ongoing merger.
-
2.
Visual morphologies of near 50% of AGN host galaxies are distorted to different degrees, showing possible signatures for ongoing minor/major mergers. However, among these distorted AGN host galaxies, most of them have mild morphological distortion. Only of the entire AGN host galaxies show strong distortions, which are potential signs for ongoing or recent major mergers.
-
3.
The fractions of distortion classes of AGN host galaxies are consistent with those of the control galaxies. We find no evidence that AGNs host a higher fraction of distorted morphologies (Dist 1 and Dist 2 classes) than non-active galaxies.
These results are generally consistent with the previous findings of Cisternas et al. (2011) at lower redshift () and of Kocevski et al. (2012) at similar redshift ().
5. Summary and Discussion
In this letter, we analyze the structure and morphology of X-ray selected AGN host galaxies in the CANDELS-COSMOS field using HST/WFC3 imaging in H band at and compare them with those of a mass-matched non-active galaxy sample. Our primary findings are as follows: 1) Near two thirds of X-ray selected AGN host galaxies in our sample at have disk-like morphologies (including disk-dominated and disk with a bulge component morphologies), while a significant fraction (over one thirds) of them are bulge dominated; 2) All structural (Sérsic index n and effective radius ) and morphological (Gini, ,concentration and asymmetry) parameters of AGN host galaxies in our sample have the similar distributions as those of non-active galaxies. We conclude that, from the point of view of structure and morphology, AGN host galaxies and non-active galaxies are indistinguishable. From other point of view of such as color, color gradients and stellar population properties, Rosario et al (2013) also found that X-ray selected AGN host galaxies and non-active galaxies are indistinguishable. 3) Only a small fraction () of X-ray selected AGN host galaxies have major merger signatures according to our visual classification. Compared to the mass-matched non-active galaxy sample, AGN hosts do not show a significant excess of distorted morphologies.
As shown by previous host galaxy simulations (e.g., Simmons & Urry 2008; Gabor et al. 2009; Pierce et al. 2010), the result that AGN host galaxies are disk-dominated characterized by a low fitted Sérsic index n is reliable. While disk contribution cannot be ruled out in bulge-dominated galaxy with a high fitted Sérsic index n. Simmons & Urry (2008) found that bulge-dominated AGN host galaxies with may have a significant disk contribution (up to 45% of their total host galaxy light). The disk fraction () of AGN host galaxies in our sample should be taken as a lower limit. This value is a bit lower than the disk fraction in Simmons et al. (2012), and is much lower than the disk fraction in Schawinski et al. (2011). The relatively lower disk fraction in our sample could be the result of different sample selections. The X-ray luminosities of AGNs in our sample are on average one order of magnitude higher than those in Schawinski et al. (2011).
Complemented with several previous findings at (e.g., Gabor et al. 2009, Cisternas et al. 2011, Schawinski et al. 2011, Simmons et al. 2012, Kocevski et al. 2012), some consistent results can be summarized for X-ray selected AGNs with erg s-1 erg s-1 up to : disk morphologies ; no enhanced distorted morphologies and similar structure and morphology as non-active galaxies. These indicate that major mergers are not necessary for triggering AGN activities in the galaxies of the X-ray selected sample. Secular internal processes, such as gravitational instabilities and dynamical friction, should play a crucial role in triggering X-ray selected AGN activities and black hole-host galaxy co-evolution. However, our findings do not conflict with supermassive black hole (SMBHs)-host galaxy co-evolution scenarios in which major mergers are responsible for triggering both star formation and luminous QSO activities (e.g., Hopkins et al. 2006). Unlike X-ray selected AGNs, luminous QSOs commonly have very high fraction (up to ) in major merger and are specifically in dust-shrouded, merger-induced starbursts (e.g., Urrutia et al. 2008; Treister et al. 2012). Thus two different modes of BH triggering and growth have been indicated: the BH growth by secular evolution of disk galaxies is important for low-luminosity AGNs, while major mergers may feed luminous quasars (e.g., Kormendy & Ho 2013).
References
- Abraham et al. (1996) Abraham, R. G., Tanvir, N. R., Santiago, B. X., et al. 1996, MNRAS, 279, L47
- Bertin (2011) Bertin, E. 2011,Astronomical Data Analysis Software and Systems XX, 442, 435
- Böhm et al. (2013) Böhm, A., Wisotzki, L., Bell, E. F., et al. 2013, A&A, 549, A46
- Bongiorno et al. (2012) Bongiorno, A., Merloni, A., Brusa, M., et al. 2012, MNRAS, 427, 3103
- Brusa et al. (2010) Brusa, M., Civano, F., Comastri, A., et al. 2010, ApJ, 716, 348
- Cappelluti et al. (2009) Cappelluti, N., Brusa, M., Hasinger, G., et al. 2009, A&A, 497, 635
- Cisternas et al. (2011) Cisternas, M., Jahnke, K., Inskip, K. J., et al. 2011, ApJ, 726, 57
- Conselice (2003) Conselice, C. J. 2003, ApJS, 147, 1
- Fan et al. (2013a) Fan, L., Chen, Y., Er, X., et al. 2013, MNRAS, 431, L15
- Fang et al. (2009) Fang, G.-W., Kong, X., & Wang, M. 2009, Research in Astronomy and Astrophysics, 9, 59
- Fang et al. (2012) Fang, G., Kong, X., Chen, Y., & Lin, X. 2012, ApJ, 751, 109
- Gabor et al. (2009) Gabor, J. M., Impey, C. D., Jahnke, K., et al. 2009, ApJ, 691, 705
- Grogin et al. (2005) Grogin, N. A., Conselice, C. J., Chatzichristou, E., et al. 2005, ApJ, 627, L97
- Grogin et al. (2011) Grogin, N. A., Kocevski, D. D., Faber, S. M., et al. 2011, ApJS, 197, 35
- Hopkins et al. (2006) Hopkins, P. F., Hernquist, L., Cox, T. J., et al. 2006, ApJS, 163, 1
- Jogee (2006) Jogee, S. 2006, Physics of Active Galactic Nuclei at all Scales, 693, 143
- Kocevski et al. (2012) Kocevski, D. D., Faber, S. M., Mozena, M., et al. 2012, ApJ, 744, 148
- Kong et al. (2009) Kong, X., Fang, G., Arimoto, N., & Wang, M. 2009, ApJ, 702, 1458
- Kormendy & Ho (2013) Kormendy, J., & Ho, L. C. 2013, ARA&A, 51, 511
- Kormendy & Kennicutt (2004) Kormendy, J., & Kennicutt, R. C., Jr. 2004, ARA&A, 42, 603
- Koekemoer et al. (2011) Koekemoer, A., Faber, S., Ferguson, H., et al. 2011, ApJS, 197, 36
- Lotz et al. (2004) Lotz, J. M., Primack, J., & Madau, P. 2004, AJ, 128, 163
- Martini (2004) Martini, P. 2004, Coevolution of Black Holes and Galaxies, 169
- Muzzin et al. (2013) Muzzin, A., Marchesini, D., Stefanon, M., et al. 2013, ApJS, 206, 8
- (25) Peng, C., Ho, L., Impey, C., et al. 2002, AJ, 124, 266
- Pierce et al. (2007) Pierce, C. M., Lotz, J. M., Laird, E. S., et al. 2007, ApJ, 660, L19
- Pierce et al. (2010) Pierce, C. M., Lotz, J. M., Salim, S., et al. 2010, MNRAS, 408, 139
- Rosario et al. (2013) Rosario, D., Mozena, M., Wuyts, S., et al. 2013, ApJ, 763, 59
- Salvato et al. (2011) Salvato, M., Ilbert, O., Hasinger, G., et al. 2011, ApJ, 742, 61
- Schawinski et al. (2011) Schawinski, K., Treister, E., Urry, C. M., et al. 2011, ApJ, 727, L31
- Schawinski et al. (2012) Schawinski, K., Simmons, B. D., Urry, C. M., et al. 2012, MNRAS, 425, L61
- Schmidt (1963) Schmidt, M. 1963, Nature, 197, 1040
- Scoville et al. (2007) Scoville, N., Aussel, H., Brusa, M., et al. 2007, ApJS, 172, 1
- Simmons & Urry (2008) Simmons, B. D., & Urry, C. M. 2008, ApJ, 683, 644
- Simmons et al. (2012) Simmons, B. D., Urry, C. M., Schawinski, K.,et al. 2012, ApJ, 761, 75
- Treister et al. (2012) Treister, E., Schawinski, K., Urry, C. M., et al. 2012, ApJ, 758, L39
- Urrutia et al. (2008) Urrutia, T., Lacy, M., & Becker, R. H. 2008, ApJ, 674, 80
- van der Wel et al. (2012) van der Wel, A., Bell, E. F., Häussler, B., et al. 2012, ApJS, 203, 24
- Villforth et al. (2013) Villforth, C., Hamann, F., Koekemoer, A., et al. 2013, arXiv:1303.1874
- Wang et al. (2012) Wang, T., Huang, J.-S., Faber, S. M., et al. 2012, ApJ, 752, 134
- Xue et al. (2011) Xue, Y. Q., Luo, B., Brandt, W. N., et al. 2011, ApJS, 195, 10