Gamma rays: stars — pulsars: general — pulsars: individual (PSR J19070602)
Searching for -Ray Pulsars among Fermi Unassociated Sources: 2FGL J1906.5+0720
Abstract
We report the results from our analysis of the Fermi Large Area Telescope data of the Fermi unassociated source 2FGL J1906.50720, which is a high-ranked candidate pulsar. In order to better study our target, we first update the ephemeris for PSR J19070602, which is used to help remove any possible contamination due to strong emission from this nearby pulsar. From our analysis, 2FGL J1906.50720 is confirmed to have a significant low energy cutoff at 1 GeV in its emission (14–18 significance), consistent with those seen in young pulsars. We search for pulsations but no spin frequency signals are found in a frequency range of 0.5–32 Hz. No single model can fully describe the source’s overall Fermi -ray spectrum, and the reason for this is the excess emission detected at energies of 4 GeV. The high-energy component possibly indicates emission from a pulsar wind nebula, when considering 2FGL J1906.50720 as a young pulsar. We conclude that 2FGL J1906.50720 is likely a pulsar based on the emission properties we have obtained, and observations at other energies are needed in order to confirm its pulsar nature.
1 Introduction
Since the Fermi Gamma-ray Space Telescope was launched in June 2008, the main instrument on-board—the Large Area Telescope (LAT) has been continuously scanning the whole sky every three hours in the energy range from 20 MeV to 300 GeV, discovering and monitoring -ray sources with much improved spatial resolution and sensitivity comparing to former -ray telescopes (Atwood et al., 2009). In 2012 resulting from Fermi/LAT data of the first two-year survey, a catalog of 1873 -ray sources was released by Nolan et al. (2012) as the Fermi/LAT second source catalog. Among the -ray sources, approximately 800 and 250 were found to be respectively associated with blazars and active galaxies of uncertain types, and more than 100 were associated with pulsars in our Galaxy. The three types thus account for the majority of the -ray sources detected by Fermi. In addition, 575 sources in the catalog have not been associated with any known astrophysical objects (Nolan et al., 2012). For the purpose of identifying the nature of these unassociated sources, many follow-up studies, such as classifying their -ray characteristics (Ackermann et al., 2012), searching for radio pulsars (Ray et al., 2012), and observing at multi-wavelengths (Takahashi et al., 2012; Acero et al., 2013), have been carried out.
Because of the relative lack of sources at low Galactic latitudes in many extragalactic source catalogs and the emission contamination by the Galaxy, the Galactic distribution of the Fermi unassociated sources were found to concentrate towards the Galactic plane (Nolan et al., 2012). More than half of the unassociated sources are located at low latitudes with 10° (Nolan et al., 2012), possibly suggesting Galactic origins for most of them. Taking under consideration the types of identified and associated Galactic -ray sources in the catalog, these low-latitude unassociated sources are most likely pulsars, pulsar wind nebulae, supernova remnants, globular clusters, or high-mass binaries. Additionally since identified and associated AGNs or blazars have a nearly isotropic distribution, AGN/blazar origins for these sources can not be excluded. In any case, the low-latitude Fermi unassociated sources are the best young pulsar candidates on the basis of currently known Galactic -ray populations, as 50% of the identified or associated Galactic Fermi sources are pulsars (Nolan et al., 2012) and the Fermi-detected millisecond pulsars are nearly isotropic (see Figure 2 in Abdo et al. (2013)). With high rotational energy loss rates (so-called spin-down luminosities), young pulsars are clustered close to the Galactic plane and can be detected to large distances.
Aiming to search for new pulsars among the unassociated sources, we selected the pulsar candidates from the Fermi second source catalog by requiring 10° and variability indices (Variability_Index parameter in the catalog) lower than 41. The variability indices were reported to measure the variability levels of sources, and a value larger than 41.64 indicates % chance of being a steady source (Nolan et al., 2012). We further ranked the candidates by their Signif_Curve parameters reported in the catalog, which represent the significance of the fit improvement between curved spectra and power-law spectra, as -ray pulsars typically have curved spectra with a form of exponentially cutoff power law. The first ten sources from our selection are listed in Table 1. The first source listed is 2FGL J1704.94618, which has the highest Signif_Curve value of 9.97 but the lowest detection significance value (9; Signif_Avg parameter in the catalog). For a comparison, the second source in our list 2FGL J1906.50720 has both high Signif_Curve (9.85) and Signif_Avg values (24), and is ranked the first among candidate pulsars by Lee et al. (2012), who applied a Gaussian-mixture model for the ranking. Among the bright -ray sources (20 detection significance), this source is clearly located in the pulsar region in the plane of the curvature significance versus variability index (Romani, 2012). We thus carried out detailed study of 2FGL J1906.50720 by analyzing Fermi/LAT data of the source region, and report our results in this paper.
In addition, 2FGL J1906.50720 is located close to a very bright -ray pulsar J19070602 (Signif_Avg 55; Abdo et al. (2013)). The angular distance between them is approximately 1.3 degrees (see Figure 1). The pulsar was discovered in the first 4 month LAT data, revealed with a spin frequency of 9.378 Hz and a spin-down luminosity of 2.81036 erg s-1 (Abdo et al., 2009). The pulsar is radio faint, making very difficult to study its timing behavior at radio frequencies (Abdo et al., 2010). In order to better study our targeted Fermi source by removing possible contamination from PSR J19070602, we performed timing analysis to the LAT data of the pulsar and include our timing results in this paper.
2 Observations
LAT is the main instrument on-board the Fermi Gamma-ray Space Telescope. It is a -ray imaging instrument which carries out an all-sky survey in the energy range from 20 MeV to 300 GeV (Atwood et al., 2009). In our analysis we selected LAT events inside a 20° 20° region centered at the position of 2FGL J1906.50720 during a nearly five-year time period from 2008-08-04 15:43:36 to 2013-07-23 20:53:17 (UTC) from the Fermi Pass 7 database. Following recommendations of the LAT team, events included were required to have event zenith angles fewer than 100 deg, preventing contamination from the Earth’s limb, and to be during good time intervals when the quality of the data was not affected by the spacecraft events.
3 Analysis and Results
3.1 Timing Analysis of PSR J19070602
After the Fermi discovery of PSR J19070602 (Abdo et al., 2009), its timing solution was updated by Abdo et al. (2010) and Ray et al. (2011) using the LAT data during MJD 54647–55074 and MJD 54682–55211, respectively. In 2013 the Fermi/LAT team released the second Fermi catalog of -ray pulsars (Abdo et al., 2013), in which the timing solution for PSR J19070602 was updated again using the data during MJD 54691–55817. A glitch at MJD 55422 was detected with of 4.6 10-6 and of 1 10-2.
In order to study 2FGL J1906.50720 by being able to remove photons from the nearby pulsar, we performed phase-connected timing analysis to the LAT data of J19070602 during the nearly five-year time period of MJD 54683–56497. We selected LAT events within 0\fdg7 centered at the pulsar’s position given in the catalog in the energy range from 50 MeV to 300 GeV, which was suggested by Ray et al. (2011). Pulse phases for photons before MJD 55400 were assigned according to the known ephemeris using the Fermi plugin of TEMPO2 (Edwards et al., 2006; Hobbs et al., 2006). We extracted an ‘empirical Fourier’ template profile, with which we generated the time-of-arrivals (TOAs) of 128 evenly divided observations of the time period. Both the template and TOAs were obtained using the maximum likelihood method described in Ray et al. (2011). From the pre-fit residuals we found that the timing model given in the second Fermi catalog of -ray pulsars could not fully describe the TOAs after MJD 55800, suggesting the requirement of an updated timing model. We then iteratively fitted the TOAs to the timing model using TEMPO2. For the glitch because of its relative large amplitude and long interval between the last pre-glitch and the first post-glitch observations, we could not obtain a unique solution to accurately determine its epoch by requiring continuous pulse phase. Instead, we adopted one of the solutions according to the ephemeris we obtained as the glitch epoch, which is closest to that reported in the second Fermi catalog of -ray pulsars. The updated ephemeris is given in Table 2, the post-fit timing residuals are shown in Figure 2, and the folded pulse profile and the two-dimensional phaseogram of this pulsar are plotted in Figure 3.
3.2 Maximum Likelihood Analysis
3.2.1 Full data
We selected LAT events in an energy range from 100 MeV to 300 GeV for the likelihood analysis, and included all sources within 15 degrees centered at the position of 2FGL J1906.50720 in the Fermi 2-year catalog to make the source model. The spectral function forms of the sources are given in the catalog. The spectral normalization parameters for the sources within 4 degrees from 2FGL J1906.50720 were left free, and all the other parameters were fixed to their catalog values. In addition we included the spectrum model gal_2yearp7v6_v0.fits and the spectrum file iso_p7v6source.txt in the source model to consider the Galactic and the extragalactic diffuse emission, respectively. The normalizations of the diffuse components were left free.
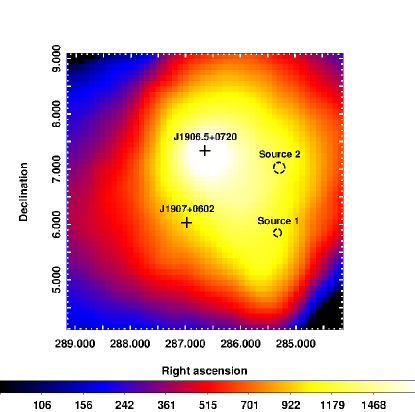
In the Fermi 2-year catalog, the -ray emission from 2FGL J1906.50720 is modeled by a log parabola expressed by (Nolan et al., 2012). We fixed the break energy to the catalog value of 1 GeV, and let the indices and free. We also tested two other models for the source: an exponentially cutoff power law expressed by , where is the spectral index, is the cutoff energy, and represents the sharpness of the cutoff, and a simple power law expressed by . For the exponentially cutoff power law we note that all pulsars in the second Fermi -ray pulsar catalog with values different from 1 (usually smaller than 1 and indicating a sub-exponential cutoff) have higher than 2 GeV (Abdo et al., 2013). Considering the values we obtained for this source are lower than 2 GeV, especially when the possible contamination from nearby sources is excluded (see Section 3.2.2, Section 3.4, and Table 3), we only used the simple exponentially cutoff shape with in our analysis. We performed standard binned likelihood analysis with the LAT science tool software package v9r31p1. The obtained spectral results and Test Statistic (TS) values are given in Table 3, and the TS map of a region around 2FGL J1906.50720 is displayed in the left panel of Figure 1. PSR J19070602 is kept in the figure to show the proximity of the two sources.
From the analysis, we found that the log parabola and the exponentially cutoff power law better fit the LAT data of 2FGL J1906.50720 than the simple power law, indicating a significant cutoff in the -ray spectrum of 2FGL J1906.50720 at the low energy of 1 GeV (Table 3). The significance of the break (approximately described by ) of the log parabola is 16, and the significance of the cutoff (approximately described by ) of the exponentially cutoff power law is 14.
3.2.2 Offpulse phase intervals of PSR J19070602
Considering no offpulse -ray emission from PSR J19070602 was detected by Fermi (Ackermann et al., 2011), we repeated binned likelihood analysis described above by including LAT events only during the offpulse phase intervals to prevent possible contamination from the pulsar. The phase intervals are defined in Section 3.1. Since the emission from the pulsar was removed, we excluded this source from the source model. The likelihood fitting results for the different -ray spectral models for 2FGL J1906.50720 are given in Table 3, and the TS map of a region around 2FGL J1906.50720 is shown in the right panel of Figure 1. The TS values are significantly increased comparing to those when the full data were used, having doubled the detection significance of 2FGL J1906.50720. In addition, a low-energy break or cutoff at 1 GeV in the source’s emission is similarly favored as that in the analysis of the full data.
3.3 Spectral Analysis
To obtain a spectrum for 2FGL J1906.50720, we evenly divided 20 energy ranges in logarithm from 100 MeV to 300 GeV, and used a simple power law to model the emission in each divided energy range. The index of the power law was fixed to the value we obtained before (Table 3). This method is less model-dependent and provides a good description for the -ray emission of a source. The spectra from both the full data and the offpulse phase interval data were obtained, which are displayed in Figure 4. Only spectral points with TS greater than 4 (corresponding to the detection significance of 2) were kept.
We plotted the obtained exponentially cutoff power-law fits and log-parabolic fits from the above likelihood analysis in Figure 4. As can be seen, the first model does not provide a good fit to the LAT spectrum. At energies of greater than several GeV, the fit deviates from the spectrum for both the full data and the offpulse phase interval data of PSR J19070602. The log parabola better describes the spectra, which is also indicated by the larger TS values obtained with it (Table 3), although a small degree of deviations from the spectra can still be seen. These may suggest an additional spectral component at the high energy range.
We fit the spectral data points below 2 GeV with exponentially cutoff power laws and obtained of 1.40.2 and of 1.00.2 GeV from the full data, and of 1.60.1 and of 0.70.1 GeV from the offpulse phase interval data. The cutoff energy values are within the range of young -ray pulsars (0.4 5.9; see Table 9 in Abdo et al. (2013)) but lower than that of millisecond -ray pulsars (1.1 5.4; see Table 9 in Abdo et al. (2013)). The fitting again shows that an additional spectral component is needed.
3.4 Spatial Distribution Analysis
In the residual TS maps both from the full data and the offpulse phase interval data after removing all sources (Figure 1), two -ray emission excesses exist. They are located at R.A.=285\fdg326 and Decl.= 5\fdg855 (equinox J2000.0), with 1 error circle of 0\fdg07, and R.A.=285\fdg293 and Decl.= 7\fdg030 (equinox J2000.0), with 1 error circle of 0\fdg1 (marked by circles in Figure 1), which were obtained from running ‘gtfindsrc’ in LAT science tools software package. In addition, there is also a tail-like structure in the southeast direction of 2FGL J1906.50720, which can be clearly seen in the TS map during offpulse intervals. In order to determine whether this tail structure is associated with 2FGL J1906.50720 or caused by the two nearby sources, we further performed maximum likelihood analysis by including the two sources in the source model. The emission of the two putative sources were modeled by a simple power law. We found that the tail structure was completely removed (see the left panel of Figure 5), indicating that it is likely caused by the two nearby sources.
A -ray spectrum of 2FGL J1906.50720 was obtained again for the offpulse phase interval data, with the two nearby sources considered. The three spectral models given in Section 3.2 were used. The results are given in Table 3. The spectral parameter values are similar to those obtained above. We also fit the obtained spectral data points below 2 GeV with an exponentially cutoff power law (cf. Section 3.3). Nearly the same results were obtained (Table 3).
These analyses confirm the existence of a high-energy component in the emission of 2FGL J1906.50720, which is likely not to be caused by contamination from the nearby sources. By constructing TS maps with photons greater than 2 or 5 GeV, we searched for extended emission (e.g., a pulsar wind nebula) at the position of 2FGL J1906.50720. However, the source profile was always consistent with being a point source. There was no indication for the presence of an additional source responsible for the high-energy component.
3.5 Timing analysis of 2FGL J1906.50720
Timing analysis was performed to the LAT data of 2FGL J1906.50720 to search for -ray pulsation signals. We included events in the energy range from 50 MeV to 300 GeV within 1 degree centered at the position of 2FGL J1906.50720, which is R.A.= 286\fdg647, Decl.= 7\fdg34256, equinox J2000.0 (the catalog position; Nolan et al. (2012)). The time period for the event selection was 300-day from 2012-09-26 20:53:17 to 2013-07-23 20:53:17 (UTC). The time-differencing blind search technique described in Atwood et al. (2006) was applied. The range of frequency derivative over frequency we considered was – , which is characteristic of pulsars such as the Crab pulsar. A step of was used in the search. The frequency range we considered was from 0.5 Hz to 32 Hz with a Fourier resolution of Hz. We did not include the parameter ranges characteristic of millisecond pulsars. The source 2FGL J1906.50720 is located in the Galactic plane and would be possibly a young pulsar such as PSR J19070602. No significant -ray pulsations from 2FGL J1906.50720 were detected. We also applied the blind search to the Fermi/LAT data of 2FGL J1906.50720 only during the offpulse phase intervals of PSR J19070602. No -ray pulsations except the spin frequency signal of PSR J19070602 were found.
In addition, we also searched for any long-period modulations from the source, the detection of which would be indicative of a binary system (see discussion in Section 4). We constructed power spectra during offpulse phase intervals of PSR J19070602 in the three energy bands of 0.2–1 GeV, 1–300 GeV, and 5–300 GeV. Light curves of nearly five-year length in the three energy bands were extracted from performing Fermi/LAT aperture photometry analysis. The aperture radius was 1 degree, and the time resolution of the light curves was 1000 seconds. The exposures were calculated assuming power law spectra with photon indices obtained by maximum likelihood analysis (Table 3), which were used to determine the flux in each time bin. No long-period modulations in the energy bands were found.
4 Discussion
By carrying out phase-connected timing analysis of the nearly 5-year Fermi -ray data of PSR J19070602, we have obtained the timing parameters and updated the -ray ephemeris for this pulsar. The obtained timing parameters are similar to those given in the second Fermi catalog of -ray pulsars (Abdo et al., 2013). However the glitch decay time constant is 99 days, larger than 33 days given in the catalog. This difference is likely due to the longer time span of the data we analyzed (2-year data was analyzed in the second Fermi catalog of -ray pulsars; Abdo et al. (2013)) and the unstable timing parameters caused by the timing noise. PSR J19070602 is quite young with a characteristic age of 19.5 kyr (Abdo et al., 2010). The post-fit rms timing residual was 2.1 ms, resulting from our timing analysis (Table 2).
We performed different analyses of the Fermi/LAT data for the unassociated source 2FGL J1906.50720. Through likelihood analysis with different spectral models, we confirmed that a curved spectrum with a low-energy break or cutoff at 1 GeV is clearly preferred to a simple power law. The significances of the curvature () are approximately 14–16 and 16–18 for the full data and the offpulse phase interval data, respectively. This feature is characteristic of -ray pulsars detected by Fermi. On the basis of the Fermi second pulsar catalog, young -ray pulsars have 0.6 2 and 0.4 GeV 5.9 GeV, and millisecond -ray pulsars have 0.4 2 and 1.1 GeV 5.4 GeV (Abdo et al. (2013)). If 2FGL J1906.50720 is a pulsar, its Galactic location and spectral feature suggest that it is probably a young pulsar (see, e.g., Abdo et al. (2013)). It should be noted that a log parabola, which better fits the spectra of 2FGL J1906.50720, is usually used to model the spectra of -ray binaries (Nolan et al., 2012). However, considering the non-detection of any long-period modulations and the low variability of 2FGL J1906.50720, a -ray binary is not likely the case for the source.
From our spectral analysis, a high-energy component was found to exist at 4 GeV in the emission of 2FGL J1906.50720. Considering it as a young pulsar, the component likely originates from its pulsar wind nebula (PWN; e.g., Gaensler & Slane (2006)). A pulsar wind generates a termination shock by the interaction of high-energy particles contained in it with the ambient medium, at which particles are re-distributed and can radiate ultra-relativistic emission. In the -ray energy range, the Fermi second source catalog used 69 known PWNe for the automatic source association, and found that nearly all of them (except three) are associated with young pulsars (Nolan et al., 2012). However since -ray emission from a pulsar often dominates over that from its PWN, the number of PWNe that have been confirmedly detected by Fermi is limited (Ackermann et al., 2011). For 2FGL J1906.50720, our spatial distribution analysis has confirmed the existence of the high-energy component in its spectrum, but the putative PWN would be too small or too faint to be resolved by Fermi. Further X-ray imaging of the source field is needed in order to detect the PWN and thus help verify the pulsar nature for 2FGL J1906.50720.
We have not been able to find any pulsed emission signals from the Fermi data of 2FGL J1906.50720, which is required to verify the source’s pulsar nature. We note that the LAT blind search sensitivity depends on many parameters, such as the accurate position of the source, the source region used for pulsation search, contamination from background diffuse emission and from nearby sources (given that our target is located at the Galactic plane with several identifiable sources nearby). Using the sensitivity estimation method for the blind searches provided by Dormody et al. (2011), the pulsed fraction of 2FGL J1906.50720 should be 0.57 for a detection probability of 68% (the 1-year detection significance is 20 for the source). Dormody et al. (2011) also extracted an all-sky detectability flux map to describe the minimum 0.3 – 20 GeV photon flux required for the detection of pulsars with pulsed fractions. In the inner Galactic plane the detectability flux should be higher than 10-7 ph cm-2 s-1. The 0.3 – 20 GeV photon flux we obtained for 2FGL J1906.50720 is 10-7.1 ph cm-2 s-1 (derived from spectral parameters listed in Table 3), suggesting the difficulty of detecting pulsed emission from the source through blind searches. Considering the radio pulsations from the source have been searched several times but with no detection (Ray et al., 2012), in order to verify its pulsar nature, X-ray observations are needed.
We thank the referee for valuable suggestions. This research was supported by Shanghai Natural Science Foundation for Youth (13ZR1464400), National Natural Science Foundation of China (11373055), and the Strategic Priority Research Program “The Emergence of Cosmological Structures” of the Chinese Academy of Sciences (Grant No. XDB09000000). ZW is a Research Fellow of the One-Hundred-Talents project of Chinese Academy of Sciences.
| Source | Signif_Curve () | (°) | Variability_Index | Signif_Avg () |
|---|---|---|---|---|
| 2FGL J1704.94618 | 10.0 | 3.111 | 21.3 | 9.3 |
| 2FGL J1906.50720 | 9.8 | 0.002 | 30.9 | 24.0 |
| 2FGL J1819.31523 | 9.2 | 0.072 | 30.0 | 19.3 |
| 2FGL J1847.20236 | 8.5 | 0.257 | 31.3 | 13.8 |
| 2FGL J1856.20450c | 8.4 | 1.139 | 18.8 | 12.3 |
| 2FGL J1619.04650 | 8.3 | 2.457 | 22.2 | 10.6 |
| 2FGL J2033.63927 | 8.3 | 0.382 | 33.8 | 13.0 |
| 2FGL J1045.05941 | 8.3 | 0.639 | 21.5 | 36.1 |
| 2FGL J0858.34333 | 8.1 | 1.428 | 16.5 | 14.1 |
| 2FGL J1739.62726 | 8.1 | 1.906 | 27.6 | 15.2 |
| Parameter | Value* |
|---|---|
| R.A., (J2000.0) | 19:07:54.7343205 |
| Decl., (J2000.0) | 06:02:16.97850 |
| Pulse frequency (s-1) | 9.3776609432(10) |
| Frequency first derivative (s-2) | 7.62737(7) 10-12 |
| Frequency second derivative (s-3) | 1.95(2) 10-22 |
| Epoch of frequency (MJD) | 55422.275976 |
| Dispersion measure (cm-3 pc) | 82.1 |
| 1st glitch epoch (MJD) | 55422.155 |
| 1st glitch permanent frequency increment (s-1) | 4.3466(3) 10-5 |
| 1st glitch frequency deriv increment (s-2) | 7.72(2) 10-14 |
| 1st glitch frequency increment (s-1) | 2.10(5) 10-7 |
| 1st glitch decay time (Days) | 99(4) |
| rms timing residual (ms) | 2.1 |
| Time system | TDB |
| Emin | 50 MeV |
| Valid range (MJD) | 54683–56497 |
-
*
Parameters with no uncertainty reported are fixed to the values given in the second Fermi catalog of -ray pulsar (Abdo et al., 2013) except the glitch epoch.
| Spectral model | Parameters | Full data | Offpulse phase interval data | Offpulse phase interval data |
|---|---|---|---|---|
| (‘tail’ removed) | ||||
| PowerLaw | 2.31 0.02 | 2.42 0.02 | 2.31 0.02 | |
| (10-11 erg cm-2 s-1) | 15 0.5 | 13 0.4 | 11 0.4 | |
| TSPL | 1101 | 2437 | 1595 | |
| LogParabola | 2.52 0.05 | 2.82 0.05 | 2.73 0.07 | |
| 0.35 0.03 | 0.37 0.03 | 0.51 0.04 | ||
| * (GeV) | 1 | 1 | 1 | |
| (10-11 erg cm-2 s-1) | 13 0.5 | 12 0.4 | 9 0.3 | |
| TSLP | 1388 | 2795 | 1966 | |
| PLSuperExpCutoff | 1.7 0.2 | 1.7 0.1 | 1.2 0.1 | |
| (GeV) | 1.7 0.8 | 1.2 0.2 | 0.8 0.1 | |
| (10-11 erg cm-2 s-1) | 13 5 | 12 2 | 9 1 | |
| TSPL+cutoff | 1297 | 2694 | 1853 | |
| PLSuperExpCutoff | 1.4 0.3 | 1.4 0.1 | 1.4 0.2 | |
| obtained by fitting | (GeV) | 1.0 0.3 | 0.5 0.1 | 0.6 0.1 |
-
*
The break energies are fixed at 1 GeV.


References
- Abdo et al. (2009) Abdo, A. A., Ackermann, M., Ajello, M., et al. 2009, Science, 325, 840
- Abdo et al. (2010) —. 2010, ApJ, 711, 64
- Abdo et al. (2011) —. 2011, ApJ, 736, L11
- Abdo et al. (2013) Abdo, A. A., Ajello, M., Allafort, A., et al. 2013, ApJS, 208, 17
- Acero et al. (2013) Acero, F., Donato, D., Ojha, R., et al. 2013, ApJ, 779, 133
- Ackermann et al. (2011) Ackermann, M., Ajello, M., Baldini, L., et al. 2011, ApJ, 726, 35
- Ackermann et al. (2012) Ackermann, M., Ajello, M., Allafort, A., et al. 2012, ApJ, 753, 83
- Aharonian et al. (2009) Aharonian, F., Akhperjanian, A. G., Anton, G., et al. 2009, A&A, 507, 389
- Aharonian et al. (2012) Aharonian, F. A., Bogovalov, S. V., & Khangulyan, D. 2012, Nature, 482, 507
- Atwood et al. (2006) Atwood, W. B., Ziegler, M., Johnson, R. P., & Baughman, B. M. 2006, ApJ, 652, L49
- Atwood et al. (2009) Atwood, W. B., Abdo, A. A., Ackermann, M., et al. 2009, ApJ, 697, 1071
- Barr et al. (2013) Barr, E. D., Guillemot, L., Champion, D. J., et al. 2013, MNRAS, 429, 1633
- Cheng et al. (1986) Cheng, K. S., Ho, C., & Ruderman, M. 1986, ApJ, 300, 500
- Cheng et al. (2004) Cheng, K. S., Taam, R. E., & Wang, W. 2004, ApJ, 617, 480
- Dormody et al. (2011) Dormody, M., Johnson, R. P., Atwood, W. B., et al. 2011, ApJ, 742, 126
- Edwards et al. (2006) Edwards, R. T., Hobbs, G. B., & Manchester, R. N. 2006, MNRAS, 372, 1549
- Gaensler & Slane (2006) Gaensler, B. M., & Slane, P. O. 2006, ARA&A, 44, 17
- Hadasch et al. (2012) Hadasch, D., Torres, D. F., Tanaka, T., et al. 2012, ApJ, 749, 54
- Hobbs et al. (2006) Hobbs, G. B., Edwards, R. T., & Manchester, R. N. 2006, MNRAS, 369, 655
- Khangulyan et al. (2012) Khangulyan, D., Aharonian, F. A., Bogovalov, S. V., & Ribó, M. 2012, ApJ, 752, L17
- Komissarov & Lyubarsky (2004) Komissarov, S. S., & Lyubarsky, Y. E. 2004, MNRAS, 349, 779
- Kong et al. (2012) Kong, A. K. H., Huang, R. H. H., Cheng, K. S., et al. 2012, ApJ, 747, L3
- Lee et al. (2012) Lee, K. J., Guillemot, L., Yue, Y. L., Kramer, M., & Champion, D. J. 2012, MNRAS, 424, 2832
- Malyshev et al. (2013) Malyshev, D., Zdziarski, A. A., & Chernyakova, M. 2013, MNRAS, 434, 2380
- Nolan et al. (2012) Nolan, P. L., Abdo, A. A., Ackermann, M., et al. 2012, ApJS, 199, 31
- Pletsch et al. (2012a) Pletsch, H. J., Guillemot, L., Fehrmann, H., et al. 2012a, Science, 338, 1314
- Pletsch et al. (2012b) Pletsch, H. J., Guillemot, L., Allen, B., et al. 2012b, ApJ, 744, 105
- Ransom et al. (2011) Ransom, S. M., Ray, P. S., Camilo, F., et al. 2011, ApJ, 727, L16
- Ray et al. (2011) Ray, P. S., Kerr, M., Parent, D., et al. 2011, ApJS, 194, 17
- Ray et al. (2012) Ray, P. S., Abdo, A. A., Parent, D., et al. 2012, arXiv:1205.3089
- Romani & Shaw (2011) Romani, R. W., & Shaw, M. S. 2011, ApJ, 743, L26
- Romani (2012) Romani, R. W. 2012, ApJ, 754, L25
- Saz Parkinson et al. (2010) Saz Parkinson, P. M., Dormody, M., Ziegler, M., et al. 2010, ApJ, 725, 571
- Takahashi et al. (2012) Takahashi, Y. and Kataoka, J. and Nakamori, T., et al. 2012, ApJ, 747, 64
- Takata et al. (2006) Takata, J., Shibata, S., Hirotani, K., & Chang, H.-K. 2006, MNRAS, 366, 1310
- Wu et al. (2012) Wu, E. M. H., Takata, J., Cheng, K. S., et al. 2012, ApJ, 761, 181
- Yu et al. (2013) Yu, M., Manchester, R. N., Hobbs, G., et al. 2013, MNRAS, 429, 688