A review of type Ia supernova spectra
Abstract
SN 2011fe was the nearest and best-observed type Ia supernova in a generation, and brought previous incomplete datasets into sharp contrast with the detailed new data. In retrospect, documenting spectroscopic behaviors of type Ia supernovae has been more often limited by sparse and incomplete temporal sampling than by consequences of signal-to-noise ratios, telluric features, or small sample sizes. As a result, type Ia supernovae have been primarily studied insofar as parameters discretized by relative epochs and incomplete temporal snapshots near maximum light. Here we discuss a necessary next step toward consistently modeling and directly measuring spectroscopic observables of type Ia supernova spectra. In addition, we analyze current spectroscopic data in the parameter space defined by empirical metrics, which will be relevant even after progenitors are observed and detailed models are refined.
Keywords supernovae : type Ia - general - observational - white dwarfs, techniques: spectroscopic
1 Introduction
The transient nature of extragalactic type Ia supernovae (SN Ia) prevent studies from conclusively singling out unobserved progenitor configurations (Roelofs et al., 2008; Li et al., 2011b; Kilic et al., 2013). It remains fairly certain that the progenitor system of SN Ia comprises at least one compact CO white dwarf (Chandrasekhar, 1957; Nugent et al., 2011; Bloom et al., 2012). However, how the state of this primary star reaches a critical point of disruption continues to elude astronomers. This is particularly so given that less than 15% of locally observed white dwarfs have a mass a few 0.1M⊙ greater than a solar mass; very few systems near the formal Chandrasekhar-mass limit555By “formal” we are referring to the mass limit that omits stellar rotation (see Appendix of Jeffery et al. 2006)., MCh 1.38 M⊙ (Vennes, 1999; Liebert et al., 2005; Napiwotzki et al., 2005; Parthasarathy et al., 2007; Napiwotzki et al., 2007).
Thus far observational constraints of SN Ia have been inconclusive in distinguishing between the following three separate theoretical considerations about possible progenitor scenarios. Along side perturbations in the critical mass limit or masses of the progenitors, e.g., from rotational support (Mueller & Eriguchi, 1985; Yoon & Langer, 2005; Chen & Li, 2009; Hachisu et al., 2012; Tornambé & Piersanti, 2013) or variances of white dwarf (WD) populations (van Kerkwijk et al., 2010; Dan et al., 2013), the primary WD may reach the critical point by accretion of material from a low-mass, radially-confined secondary star (Whelan & Iben, 1973; Nomoto & Sugimoto, 1977; Hayden et al., 2010a; Bianco et al., 2011; Bloom et al., 2012; Hachisu et al., 2012; Wheeler, 2012; Mazzali et al., 2013; Chen et al., 2013), and/or through one of several white dwarf merger scenarios with a close binary companion (Webbink, 1984; Iben & Tutukov, 1984; Paczynski, 1985; Thompson, 2011; Wang et al., 2013a; Pakmor et al., 2013). In addition, the presence (or absence) of circumstellar material may not solely rule out particular progenitor systems as now both single- and double-degenerate systems are consistent with having polluted environments prior to the explosion (Shen et al., 2013; Phillips et al., 2013).
Meanwhile, and within the context of a well-observed spectroscopically normal SN 2011fe, recent detailed models and spectrum synthesis along with SN Ia rates studies, a strong case for merging binaries as the progenitors of normal SN Ia has surfaced (c.f., van Kerkwijk et al. 2010; Li et al. 2011c; Blondin et al. 2012; Chomiuk 2013; Dan et al. 2013; Moll et al. 2013; Maoz et al. 2013; Johansson et al. 2014). However, because no progenitor system has ever been connected to any SN Ia, most observational constraints and trends are difficult to robustly impose on a standard model picture for even a single progenitor channel; the SN Ia problem is yet to be confined for each SN Ia subtype.
As for restricting SN Ia subtypes to candidate progenitor systems: (i) observed “jumps” between mean properties of SN Ia subtypes signify potential differences of progenitors and/or explosion mechanisms, (ii) the dispersions of individual subtypes are thought to arise from various abundance, density, metallicity, and/or temperature enhancements of the original progenitor system’s post-explosion ejecta tomography, and (iii) “transitional-type” SN Ia complicate the already similar overlap of observed SN Ia properties (Nugent et al., 1995; Lentz et al., 2000; Benetti et al., 2005; Branch et al., 2009; Höflich et al., 2010; Wang et al., 2012, 2013c; Dessart et al., 2013a). Moreover, our physical understanding of all observed SN Ia subclasses remains based entirely on interpretations of idealized explosion models that are so far constrained and evaluated by “goodness of fit” comparisons to incomplete observations, particularly for SN Ia spectra at all epochs.
By default, spectra have been a limiting factor of supernova studies due to associated observational consequences, e.g., impromptu transient targets, variable intrinsic peak luminosities, a sparsity of complete datasets in wavelength and time, insufficient signal-to-noise ratios, and the ever-present obstacle of spectroscopic line blending (Payne-Gaposchkin & Whipple, 1940). Subsequently, two frequently relied upon empirical quantifiers of SN Ia spectroscopic diversity have been the rate at which rest-frame 6100 Å absorption minima shift redward vis-à-vis projected Doppler velocities of the absorbing Si-rich material (Benetti et al., 2005; Wang et al., 2009a) and absorption strength measurements (a.k.a. pseudo equivalent widths; pEWs) of several lines of interest (see Branch et al. 2006; Hachinger et al. 2006; Silverman et al. 2012b; Blondin et al. 2012). Together these classification schemes more-or-less describe the same events by two interconnected parameter spaces (i.e. flux and expansion velocities, Branch et al. 2009; Foley & Kasen 2011; Blondin et al. 2012) that are dependent on a multi-dimensional array of physical properties. Naturally, the necessary next step for supernova studies alike is the development of prescriptions for the physical diagnosis of spectroscopic behaviors (see §2.2 and Kerzendorf & Sim 2014).
For those supernova events that have revealed the observed patterns of SN Ia properties, the majority are termed “Branch-normal” (Branch et al., 1993; Li et al., 2011c), while others further away from the norm are historically said to be “peculiar” (e.g., SN 1991T, 1991bg; see Filippenko 1997 and references therein). Although, many non-standard events have since obscured the boundaries between both normal and peculiar varieties of SN Ia, such as SN 1999aa (Garavini et al., 2004), 2000cx (Chornock et al., 2000; Li et al., 2001; Rudy et al., 2002), 2001ay (Krisciunas et al., 2011), 2002cx (Li et al., 2003), 2003fg (Howell et al., 2006; Jeffery et al., 2006), 2003hv (Leloudas et al., 2009; Mazzali et al., 2011), 2004dt (Wang et al., 2006; Altavilla et al., 2007), 2004eo (Pastorello et al., 2007a), 2005gj (Prieto et al., 2007), 2006bt (Foley et al., 2010b), 2007ax (Kasliwal et al., 2008), 2008ha (Foley et al., 2009, 2010a), 2009ig (Foley et al., 2012c; Marion et al., 2013), PTF10ops (Maguire et al., 2011), PTF11kx (Dilday et al., 2012; Silverman et al., 2013b), and 2012fr (Maund et al., 2013; Childress et al., 2013c).
The fact that certain subsets of normal SN Ia constitute a near homogenous group of intrinsically bright events has led to their use as standardizable distance indicators (Kowal, 1968; Elias et al., 1985a; Branch & Tammann, 1992; Riess et al., 1999; Perlmutter et al., 1999; Schmidt, 2004; Mandel et al., 2011; Maeda et al., 2011; Sullivan et al., 2011a; Hicken et al., 2012). However, this same attribute of homogeneity remains the greatest challenge in the individual study of SN Ia given that the time-evolving spectrum of a supernova is unique unto itself from the earliest to the latest epochs.
Because SN Ia are invaluable tools for both cosmology and understanding progenitor populations, a multitude of large scale surveys, searches, and observing campaigns666e.g., The Automated Survey for SuperNovae (Assassin), The Backyard Observatory Supernova Search (BOSS), The Brazilian Supernova Search (BRASS), The Carnegie Supernova Project (CSP), The Catalina Real-Time Transient Survey (CRTS), The CHilean Automatic Supernovas sEarch (CHASE), The Dark Energy Survey (DES), The Equation of State: SupErNovae trace Cosmic Expansion (ESSENCE) Supernova Survey, The La Silla-QUEST Variability Survey (LSQ), Las Cumbres Observatory Global Telescope Network (LCOGT), The Lick Observatory Supernova Search (LOSS), The Mobile Astronomical System of the Telescope-Robots Supernova Search (MASTER), The Nearby Supernova Factory (SNfactory), The Optical Gravitational Lensing Experiment (OGLE-IV), The Palomar Transient Factory (PTF), The Panoramic Survey Telescope and Rapid Response System (Pan-STARRS), The Plaskett Spectroscopic Supernova Survey (PSSS), Public ESO Spectroscopic Survey of Transient Objects (PESSTO), The Puckett Observatory World Supernova Search, The ROTSE Supernova Verification Project (RSVP), The SDSS Supernova Survey, The Canada-France-Hawaii Telescope Legacy Survey Supernova Program (SNLS), The Southern inTermediate Redshift ESO Supernova Search (STRESS), The Texas Supernova Search (TSS); for more, see http://www.rochesterastronomy.org/snimages/snlinks.html. are continually being carried out with regularly improved precision. Subsequently, this build-up of competing resources has also resulted in an ever growing number of new and important discoveries, with less than complete information for each. In fact, with so many papers published each year on various aspects of SN Ia, it can be difficult to keep track of new results and important developments, including the validity of past and present theoretical explosion simulations and their related observational interpretations (see Maoz et al. 2013 for the latest).
Here we compile some of the discussions on spectroscopic properties of SN Ia from the past decade of published works. In §2 we overview the most common means for studying SN Ia: light curves (§2.1), spectra (§2.2), and detailed explosion models (§2.3). In particular, we overview how far the well-observed SN 2011fe has progressed the degree of confidence associated with reading highly blended SN Ia spectra. Issues of SN Ia diversity are discussed in §3. Next, in §4 we recall several SN Ia that have made up the bulk of recent advances in uncovering the extent of their properties and peculiarities (see also the Appendix for a guide of some recent events). Finally, in §5 we summarize and conclude with some observational lessons of SN 2011fe.
2 Common Subfields of Utility
2.1 Light curves
The interaction between the radiation field and the ejecta can be interpreted to zeroth order with the bolometric light curve. For SN Ia, the rise and fall of the light curve is said to be “powered” by 56Ni produced in the explosion (Colgate & McKee, 1969; Arnett, 1982; Khokhlov et al., 1993; Mazzali et al., 1998; Pinto & Eastman, 2000a; Stritzinger & Leibundgut, 2005). Additional sources are expected to contribute to the overall luminosity behavior at various epochs777Just a few examples include: CO layer metallicity (Lentz et al., 2000; Timmes et al., 2003; Meng et al., 2011), interaction with circumstellar material (CSM, see Quimby et al. 2006b; Patat et al. 2007; Simon et al. 2007; Kasen 2010; Hayden et al. 2010a; Sternberg et al. 2011; Foley et al. 2012a; Förster et al. 2012; Shen et al. 2013; Silverman et al. 2013d; Raskin & Kasen 2013) or an enshrouding CO envelope (Scalzo et al., 2012; Taubenberger et al., 2013), differences in total progenitor system masses (Hachisu et al., 2012; Pakmor et al., 2013; Chen et al., 2013), and directional dependent aspects of binary configurations (e.g., Blondin et al. 2011; Moll et al. 2013)..
For example, Nomoto et al. (2003) has suggested that the variation of the carbon mass fraction in the C+O WD (C/O), or the variation of the initial WD mass, causes the diversity of SN Ia brightnesses (see Höflich et al. 2010). Similarly, Meng et al. (2011) argue that C/O and progenitor metallicity, Z, are intimately related for a fixed WD mass, and particularly for high metallicities given that it results in lower 3 burning rates plus an increased reduction of carbon via 12C(,)16O. For Z Z⊙ (0.02), Meng et al. (2011) find that both C/O and Z have an approximately equal influence on 56Ni production since, for a given WD mass, high progenitor metallicities (a greater abundance of species heavier than oxygen) and low C/O abundances (low carbon-rich fuel assuming a single-degenerate scenario) result in a low 56Ni yield and subsequently dimmer SN Ia. For near solar metallicities or less, the carbon mass fraction plays a dominant role in 56Ni production (Timmes et al., 2003). This then suggests that the average C/O ratio in the final state of the progenitor is an important physical cause, in addition to metallicity, for the observed width-luminosity relationship (WLR888A WLR is followed when a SN Ia has a proportionately broader light curve for its intrinsic brightness at maximum light (Phillips, 1993). Phillips et al. (1999) later extended this correlation by incorporating measurement of the extinction via late time B V color measurements and B V and V I measurements at maximum light (see also Germany et al. 2004; Prieto et al. 2006b). Because lights curves of faint SN Ia evolve promptly before 15 days post-maximum light, light curve shape measurements are better suited for evaluating the light curve “stretch” (Conley et al., 2008).) of normal SN Ia light curves (Umeda et al., 1999a; Timmes et al., 2003; Nomoto et al., 2003; Bravo et al., 2010; Meng et al., 2011).
At the same time, the observed characteristics of SN Ia light curves and spectra can be fairly matched by adopting radial and/or axial shifts in the distribution of 56Ni, possibly due to a delayed- and/or pulsational-detonation-like explosion mechanism (see Khokhlov 1991b; Hoflich et al. 1995; Baron et al. 2008; Bravo et al. 2009; Maeda et al. 2010b; Baron et al. 2012; Dessart et al. 2013a) or a merger scenario (e.g., Dan et al. 2013; Moll et al. 2013). Central ignition densities are also expected to play a secondary role in the form of the WLR since they are dependent upon the accretion rate of H and/or He-rich material and cooling time (Röpke et al., 2005; Höflich et al., 2010; Meng et al., 2010; Krueger et al., 2010; Sim et al., 2013), in addition to the spin-down timescales for differentially rotating WDs (Hachisu et al., 2012; Tornambé & Piersanti, 2013). Generally, discerning which of these factors dominate the spectrophotometric variation from one SN Ia to another remains a challenging task (Wang et al., 2012). As a result, astronomers are still mapping a broad range of SN Ia characteristics and trends (§3).
Meanwhile, cosmological parameters determined by SN Ia light curves depend on an accurate comparison of nearby and distant events999Most SN Ia distance determination methods rely on correlating a distance dependent parameter and one or more distance independent parameters. Subsequently, a number of methods have been developed to calibrate SN Ia by multi-color light curve shapes (e.g., Hamuy et al. 1996; Nugent et al. 2002; Knop et al. 2003; Nobili et al. 2005; Prieto et al. 2006b; Jha et al. 2007; Conley et al. 2008; Rodney & Tonry 2009; Burns et al. 2011).. For distant and therefore redshifted SN Ia, a “K-correction” converts an observed magnitude to that which would be observed in the rest frame in another bandpass filter, allowing for the comparison of SN Ia brightnesses at various redshifts (Hogg et al., 2002). Consequently, K-corrections require the spectral energy distribution (SED) of the SN Ia and depend on SN Ia broad-band colors and the diversity of spectroscopic features (Nugent et al., 2002). While some light curve fitters take a K-correction-less approach (e.g., Guy et al. 2005, 2007; Conley et al. 2008), an SED is still required. A spectral template time series dataset is usually used since there exists remarkable homogeneity in the observed optical spectra of “normal” SN Ia (e.g., Hsiao et al. 2007).
Unfortunately there do remain poorly understood differences regarding spectroscopic feature strengths and inferred expansion velocities for these and other types of thermonuclear supernovae (see §2.2 and §3). At best, the spectroscopic diversity of SN Ia has been determined to be multidimensional (Hatano et al., 2000; Benetti et al., 2005; Branch et al., 2009; Wang et al., 2009a). Verily, SN Ia diversity studies require numerous large spectroscopic datasets in order to subvert many complex challenges faced when interpreting the data and extracting both projected Doppler velocities and “feature strength” measurements. However, studies that seek to primarily utilize SN Ia broad band luminosities need only collect a handful of sporadically sampled spectra in order to type the supernova event as a bona fide SN Ia. We note that interests in precision cosmology conflict at this point with the study of SN Ia. This is primarily because obtaining UBVRI photometry for hundreds of events is cheaper than collecting complete spectroscopy for a lesser number of SN Ia at various redshifts.
Nevertheless, the brightness decline rate in the B-band during the first 15 rest-frame days post-maximum light, m15(B), has proven useful for all SN Ia surveys. Phillips (1993) noted that m15(B) is well correlated with the intrinsic luminosity, a.k.a. the width-luminosity relationship. Previously, Khokhlov et al. (1993) did predict the existence of a WLR given that the light curve shape is sensitive to the time-dependent state of the ejected material.
Kasen & Woosley (2007) recently utilized multi-dimensional time-dependent Monte Carlo radiative transfer calculations of Chandrasekhar-mass SN Ia models to access the physical relationship between the luminosity and light curve decline rate. They found that the WLR is largely a consequence of the radiative transfer inherent to SN Ia atmospheres, whereby the ionization evolution of iron redirects flux red ward and is hastened for dimmer and/or cooler SN Ia. Woosley et al. (2007) later explored the diversity of SN Ia light curves using a grid of 130 one-dimensional models. They concluded that a WLR is satisfied when SN Ia burn 1.1 M⊙ of material, with iron-group elements extending out to 8000 km s-1.
Broadly speaking, the shape of the WLR is fundamentally influenced by the ionization evolution of iron group elements (Kasen & Woosley, 2007). However, since broad band luminosities are the sum of a supernova SED per wavelength interval, details of SN Ia diversity risk being “blurred out” for large samples of SN Ia. Therefore, decoding the spectra of all SN Ia subtypes, in addition to indirectly constraining detailed explosion models by the WLR, is of vital importance since variable signatures of iron-peak elements (IPEs) blend themselves within an SED typically populated by relatively strong features of overlapping signatures of intermediate-mass elements (IMEs).
2.2 Spectra
Supernova spectra detail information about the explosion and its local environment. To isolate and extract physical details (and determine their order of influence), several groups have invested greatly in advancing the computation of synthetic spectra for SN Ia, particularly during the early phases of homologous expansion (e.g., Mazzali & Lucy 1993; Hauschildt & Baron 1999; Kasen et al. 2002; Thomas et al. 2002; Höflich et al. 2002; Branch 2004; Sauer et al. 2006; Kasen et al. 2006; Jeffery & Mazzali 2007; Sim et al. 2010a; Thomas et al. 2011a; Hillier & Dessart 2012; Hoffmann et al. 2013; Pauldrach et al. 2013; Kerzendorf & Sim 2014). Although, even the basic facets of the supernova radiation environment serve as obstacles for timely computations of physically accurate, statistically representative, and robustly certain synthetic spectra (e.g., consequences of expansion).
It is the time-dependent interaction of the radiation field with the expanding material that complicates drawing conclusions about the explosion physics from the observations101010There is general consensus that the observed spectroscopic diversity of most SN Ia are influenced by: different configurations of 56Ni produced in the events (Colgate & McKee, 1969; Arnett, 1982; Khokhlov et al., 1993; Baron et al., 2012), their effective temperatures (Nugent et al., 1995), density profiles and the amount of IPEs present within the outermost layers of ejecta (Hatano et al., 1999a; Baron et al., 2006; Hachinger et al., 2012), global symmetries of Si-rich material (Thomas et al., 2002), departures from spherical symmetry for Ca and Si-rich material at high velocities (Wang et al., 2007; Kasen et al., 2009; Maeda et al., 2010a; Maund et al., 2013; Moll et al., 2013; Dessart et al., 2013a), efficiencies of flux redistribution (Kasen et al., 2006; Jack et al., 2012), the radial extent of stratified material resulting from a detonation phase (Woosley et al., 2007), host galaxy dust (Tripp & Branch, 1999; Childress et al., 2013a), and the metallicity of the progenitors (Höflich et al., 1998; Lentz et al., 2000; Timmes et al., 2003; Howell et al., 2009; Bravo et al., 2010; Jackson et al., 2010; Wang et al., 2013c).. In a sense, there are two stages during which direct (and accessible) information about the progenitor system is driven away from being easily discernible within the post-explosion spectra: explosive nucleosynthesis and radiation transport111111Some relevant obstacles include: a high radiation energy density in a low matter density environment, radiative versus local collisional processes (non-LTE conditions) and effects (Baron et al., 1996), time-dependent effects and the dominance of line over continuum opacity (Pinto & Eastman, 2000a, b), and relativistic flows as well as GR effects on line profiles (Chen et al., 2007; Knop et al., 2009). In addition, the entire light emission is powered by decay-chain -rays, interactions with CSM, and is influenced by positrons, fast electrons, and Auger electrons in later phases (Kozma & Fransson, 1992; Seitenzahl et al., 2009).. That is to say, the ability to reproduce both the observed light curve and spectra, as well as the range of observed characteristics among SN Ia, is essential towards validating and/or restricting any explosion model for a given subtype.
Moreover, this assumes the sources of observed spectroscopic signatures in all varieties of SN Ia are known a priori, which is not necessarily the case given the immense volume of actively contributing atomic line transitions and continuum processes (Baron et al., 1995, 1996; Kasen et al., 2008; Bongard et al., 2008; Sauer et al., 2008). In fact, several features throughout the spectra have been either tentatively associated with a particular blend of atomic lines or identified with a multiple of conflicting suggestions (e.g., forbidden versus permitted lines at late or “nebular” transitional phases, see Bowers et al. 1997; Branch et al. 2005; Friesen et al. 2012; Dessart et al. 2013b). Meanwhile others are simply misidentified or unresolved due to the inherent high degeneracy of solutions and warrant improvements to the models for further study (e.g., Na I versus [Co III]; Dessart et al. 2013b).
For example, the debate over whether or not hydrogen and/or helium are detected in some early Ibc spectra has been difficult to navigate on account of the wavelength separation of observed weak features and the number of plausible interpretations (Deng et al., 2000; Branch et al., 2002b; Anupama et al., 2005a; Elmhamdi et al., 2006; Parrent et al., 2007; Ketchum et al., 2008; Soderberg et al., 2008; James & Baron, 2010; Benetti et al., 2011; Chornock et al., 2011; Dessart et al., 2012; Milisavljevic et al., 2013a, b; Takaki et al., 2013). Historically, the term “conspicuous” has defined whether or not a supernova belongs to a particular spectroscopic class. By way of illustration, photographic spectrograms of type II events reveal conspicuous emission bands of hydrogen while type I events do not (Minkowski, 1941). With the advent of CCD cameras in modern astronomy, it has been determined that 6300 Å absorption features (however weak) in the early spectra of some type Ibc supernovae are often no less conspicuous than 6100 Å Si II 6355 absorption features in SN Ia spectra, where some 6300 Å features produced by SN Ibc may be due to Si II and/or higher velocity H (Filippenko, 1988; Filippenko et al., 1990; Filippenko, 1992). That is, while SN Ibc are of the type I class, they do not necessarily lack hydrogen and/or helium within their outer-most layers of ejecta, hence the conservative definition of type I supernovae as “hydrogen/helium-poor” events.
This conundrum of which ion signatures construct each observed spectral feature rests proportionately on the signal-to-noise ratio (S/N) of the data. However, resolving this spectroscopic dilemma is primarily dependent on the wavelength and temporal coverage of the observations and traces back to the pioneering work of McLaughlin (1963) who studied spectra of the type Ib supernova, SN 1954A, in NGC 4214 (Wellmann, 1955; Branch, 1972; Blaylock et al., 2000; Casebeer et al., 2000). Contrary to previous interpretations that supernova spectra were the result of broad, overlapping emission features (Gaposchkin, 1936; Humason, 1936; Baade, 1936; Walter & Strohmeier, 1937; Minkowski, 1939; Payne-Gaposchkin & Whipple, 1940; Zwicky, 1942; Baade et al., 1956), it was D. B. McLaughlin who first began to repeatedly entertain the idea that “absorption-like” features were present121212Admittedly Minkowski (1941) had previously mentioned “absorptions and broad emission bands are developed [in the spectra of supernovae].” Although, this was primarily within the context of early epoch observations that revealed a featureless, blue continuum: “Neither absorptions nor emission bands can be definitely seen but some emission is suspected in the region of H” (Minkowski, 1940). in regions that “lacked emission” (McLaughlin, 1959, 1960, 1963).
The inherent difficulties in reading supernova spectra and the history of uncertain line identifications for both conspicuous and concealed absorption signatures are almost as old as the supernova field itself (Payne-Gaposchkin & Whipple, 1940; Dessart et al., 2013b). Still, spectroscopic intuitions can only evolve as far as the data allow. Therefore it is both appropriate and informative to recall the progression of early discussions on the spectra of supernovae, during which spectroscopic designations of type I and type II were first introduced:
There appears to be a general opinion that the evidence concerning the spectrum of the most luminous nova of modern times was so contradictory that conclusions as to its spectra nature are impossible. This view is expressed, for example, by Miss Cannon: “With the testimony apparently so conflicting, it is difficult to form any conception of the class of this spectrum” (Gaposchkin, 1936).
It also seems ill advised to conclude anything regarding the distribution of temperature in super-novae from the character of their visible spectra as long as a satisfactory explanation of some of the most important features of these spectra is completely lacking (Zwicky, 1936).
The spectrum is not easy to interpret, as true boundaries of the wide emission lines are difficult to determine (Humason, 1936).
Those [emission] bands with distinct maxima and a fairly sharp redward or violetward edge, excepting edges due to a drop in plate spectral sensitivity, may give an indication of expansion velocity (Popper, 1937).
Instead of the typical pattern of broad, diffuse emissions dominated by a band about 4600 Å, it appeared like a continuum with a few deep and several shallow absorption-like minima. Two of the strongest “absorption lines,” when provisionally interpreted as 4026, 4472 He I, give velocities near 5000 km s-1 […] The author is grateful to N. U. Mayall and R. Minkowski for the use of spectrograms, and for helpful discussions. However, this does not imply agreement with the author’s interpretations (McLaughlin, 1959).
It is hardly necessary to emphasize in detail the difficulties of establishing the correct interpretation of a spectrum which may reflect unusual chemical composition, whose features may represent emission, absorption, or both mixed, and whose details are too ill-defined to admit precise measures of wavelengths (Minkowski, 1963).
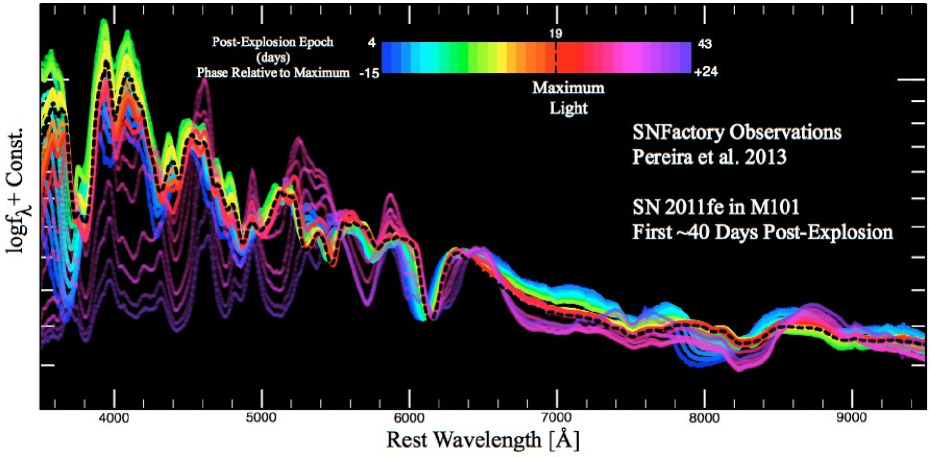
Given that our general understanding of blended spectral lines remains in a continual state of improvement, the frequently recurrent part of “the supernova problem” is pairing observed features with select elements of the periodic table (Hummer, 1976; Axelrod, 1980; Jeffery & Branch, 1990; Hatano et al., 1999b; Branch et al., 2000). In fact, it was not until nearly a half-century after Minkowski (1963), with the discovery and prompt spectroscopic follow-up of SN 2011fe (Figure 1 and §4.1) that the loose self-similarity of SN Ia time series spectra from the perceived beginning of the event to near maximum light was roundly confirmed (Nugent et al. 2011, see also Garavini et al. 2005; Foley et al. 2012c; Silverman et al. 2012d; Childress et al. 2013c; Zheng et al. 2013).
While SN 2011fe may not have revealed a direct confirmation on its progenitor system (Li et al., 2011b), daily spectroscopic records at optical wavelengths were finally achieved, establishing the most efficient approach for observing ill-defined features over time (Pereira et al., 2013). This is important given that UV to NIR line identifications of all observed complexes are highly time-dependent, are sensitive to most physically relevant effects, continuously vary between subtypes, and rely on minimal constraint for all observed events131313See Foley et al. (2012b) for “The First Maximum-light Ultraviolet through Near-infrared Spectrum of a Type Ia Supernova.”.
Even so, this rarely attainable observing strategy does not necessarily illuminate nor eliminate all degeneracies in spectral feature interpretations. However the advantage of complimentary high frequency follow-up observations is that the spectrum solution associated with any proposed explosion scenario can at least be consistently tested and constrained by the observed rapid changes over time (“abundance tomography” goals, e.g., Hauschildt & Baron 1999; Stehle et al. 2005; Sauer et al. 2006; Kasen et al. 2006; Hillier & Dessart 2012; Pauldrach et al. 2013). It then follows that hundreds of well-observed spectrophotometric datasets serve to carve out the characteristic information, , for each SN Ia between subtypes, in addition to establishing the perceived boundaries of the SN Ia diversity problem (see Fig. 11 of Blondin et al. 2012 for this concept at maximum light).
For supernovae in general, Figure 1 also serves as a reminder that all relative strengths evolve continuously over time, where entire features are always red-shifting across wavelength (line velocity space) during the rise and fall in brightness. A corollary of this situation is that prescriptions for taking measurements of spectroscopic behaviors (whereby interpretations rely on a subjective “goodness of fit”) and robustly associating with any number of physical causes do not exist. Instead there are two primary means for interpreting SN Ia spectra and taking measurements of features for the purposes of extracting physical properties.
Indirect analysis assumes a detailed explosion model and is primarily tasked with assessing the accuracy and flaws of the model. Direct analysis seeks to manually measure via spectrum synthesis where one can either assume an initial post-explosion ejecta composition or give up abundance information altogether to assess the associated uncertainties and consequences of supernova line blending via purposeful high parameterizations. For the latter of these direct inference methods, the conclusions about spectroscopic interpretationswhich are supported by remnants of inconsistencies throughout the literatureare summarized as follows.
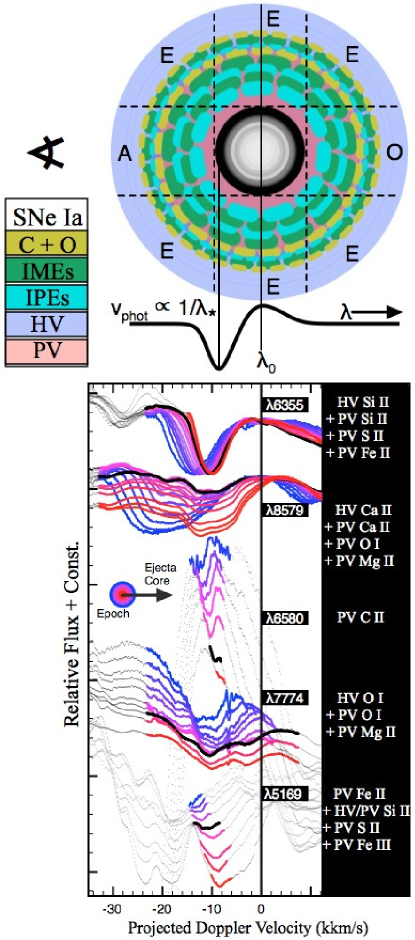
For the most part, particularly at early epochs and as far as anyone can tell with current limiting datasets, the features in SN Ia spectra are due to IMEs and IPEs formed by resonance scattering of continuum and decay-chain photons, and have P Cygni-type profiles overall (Pskovskii 1969; Mustel 1971; Branch & Patchett 1973; Kirshner et al. 1973a; see Figure 2). Emission components peak at or near the rest wavelength and absorption components are blue-shifted according to the opacity profile of matter at and above the photospheric line forming region. The combination of these effects can often lead to “trumped” emission features (Jeffery & Branch, 1990), giving SN Ia spectra their familiar shapes.
Essentially all relevant atomic species (isotope plus ionization state) are present somewhere within the ejecta, each with its own 3-dimensional abundance profile. At optical wavelengths, conditions and abundance tomographies of the ejecta maintain the dominance of select singlytriply ionized subsets of CO, IMEs, and IPEs (Hatano et al., 1999b). From shortly after the onset of the explosion to around the time of maximum light, the opticalNIR spectrum of a normal SN Ia consists of a continuum level with superimposed features that are primarily consistent with strong permitted lines of ions such as O I, Mg II, Si II, Si III, S II, Ca II, Fe II, Fe III, and trace signatures of C I and C II (Branch et al., 2006; Thomas et al., 2007; Bongard et al., 2008; Nugent et al., 2011; Parrent et al., 2012; Hsiao et al., 2013; Mazzali et al., 2013; Dessart et al., 2013a). After the pre-maximum light phase, blends of Fe II (in addition to other IPEs) begin to dominate or influence the temporal behavior of many opticalNIR features over timescales from weeks to months (see Branch et al. 2008 and references therein).
With the above mentioned approximated view of line formation in mind (Figure 2), the real truth is that the time-dependent state of the ejecta and radiation field at all locations dictates how the material presence within the line forming regions will be imparted onto the spectral continuum, i.e. the radiation field and the matter are said to be “coupled.” With the additional condition of near-relativistic expansion velocities (0.1), line identifications themselves can also be thought of as coupled to the abundance tomography of ejected material, which includes the projected Doppler velocities spanned by the recipe of absorbing material. Subsequently, while spectra can be used for constraining limits of some model parameters, it comes with a cost of certainty on account of natural uncertainties imparted by the large expansion velocities and associated expansion opacities.
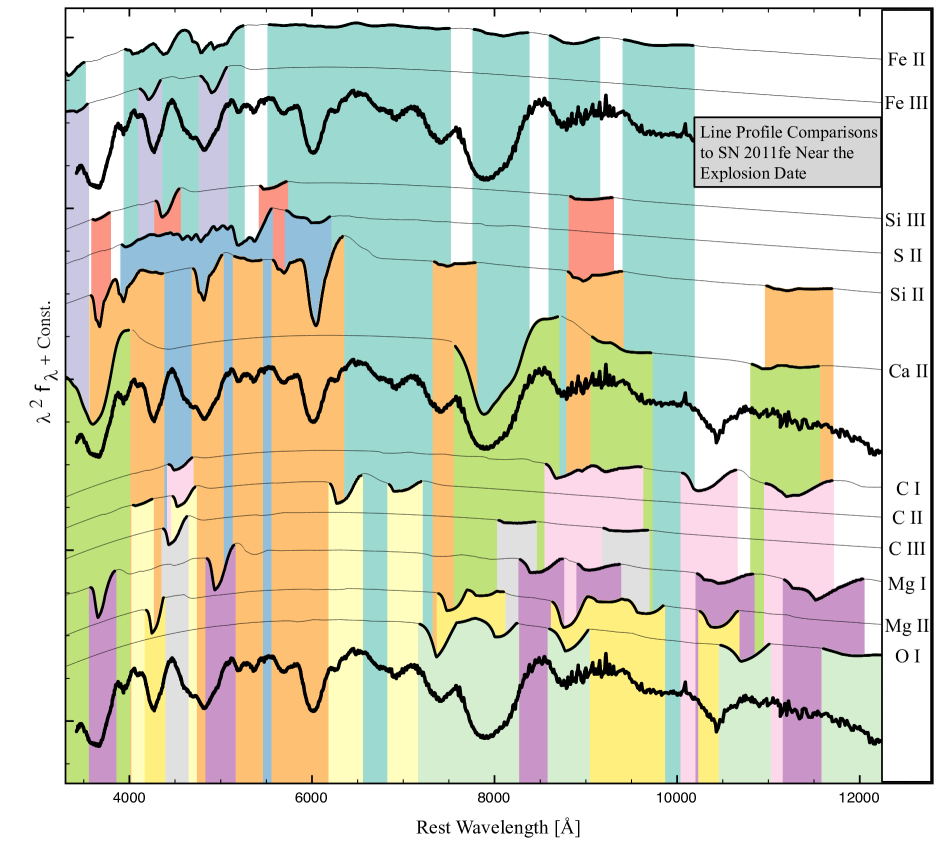
As an exercise in this point, in Figure 3 we have constructed an early epoch set of toy model line profiles that are representative of normal SN Ia line identification procedures (e.g., Branch et al. 2005; Parrent et al. 2011) and over-plot them with an early opticalNIR spectrum (the observed outermost layers, sans UV) of SN 2011fe. We summarize the take away points of Figure 3 as follows.
-
•
Even without considering weak contributions, at no place along the (UV) opticalNIR spectrum is any observed feature removed from being due to less than 2 sources (more precisely, see also Bongard et al. 2008). That is, under the basic assumptions of pure resonance line scattering and homologous expansion (Figure 2), all features are complex blends of at least 2 ions and are universally influenced by multiple regions of emitting and/or absorbing material (e.g., “high[-er] velocity” and “photospheric velocity” intervals of material, see also Marion et al. 2013).
-
•
For supernovae, the components of the spectrum are most easily constrained via spectrum synthesis, and subsequently measurable (not the converse), when the bounds of wavelength coverage, a and b, are between 20003500 and 12000 Å, respectively. If b 75009500 Å, then the velocities and relative strengths of several physically relevant ions (e.g., C I, O I, Mg II, and Ca II) are said to be devoid of useful constraint and provide a null (or uncertain) measurement for every other overlapping spectral line signature (i.e. all features). That is, in order to viably “identify” and measure a single feature, the entire spectrum must be reproduced. While empirical measurements of certain absorption features are extremely useful for identifying trends in the observed behavior of SN Ia, these methods do not suffice to measure the truest underlying atomic recipe and its time-dependent behavior, much less the “strength” of contributing lines (e.g., multiple velocity components of Si II in SN 2012fr, §4.2.2). Specifically, empirical feature strength measurements at least require a proper modeling of the non-blackbody, IPE-dominated pseudo continuum level (Bongard et al., 2008) or the use of standardized relative strength parameters (e.g., Childress et al. 2013b).
-
•
Therefore, as in Figure 2, employing stacked Doppler velocity scaled time series spectra provides useful and timely first-order comparative estimates for when (epoch) and where (projected Doppler velocity) contributing ions appear, disappear, and span as the photospheric region recedes inward over time.
We speak on this only to point out that even simple questionsparticularly for homogeneous SN Iaare awash in detection/non-detection ambiguities. However, it should be noted that a powerful exercise in testing uncertain line identifications and resolving complex blends can be done, in part, without the use of additional synthetic spectrum calculations. That is, by comparing a single observed spectrum to that of other well-observed SN Ia, where the analysis of the latter offers a greater context for interpretation than the single spectrum itself, one can deduce whether or not a “mystery” absorption feature is common to most SN Ia in general. On the other hand, if a matching absorption feature is not found, then one can infer the presence of either a newly identified, compositionally consistent ion or the unblended line of an already accounted for species (resulting from forbidden line emission, non-LTE effects, and/or when line strengths or expansion velocities differ between subtypes). Given also the intrinsic dispersion of expansion opacities between SN Ia, it is likely that an “unidentified” feature is that of a previously known ion at higher and/or lower velocities. It is this interplay between expansion opacities and blended absorption features that keep normal and some peculiar SN Ia within the description of a homogenous set of objects, however different they may appear.
In fact, when one compares the time series spectra of a broad sample of SN Ia subtypes, however blended, there is little room for degeneracy among plausible ion assignments (sans IPEs, e.g., Fe II versus Cr II during post-maximum phases). In other words, there exists a unique set of ions, common to most SN Ia atmospheres, that make up the resulting spectrum, where differences in subtype are associated with differences in temperature and/or the abundance tomography of the outermost layers (Tanaka et al., 2008). The atomic species listed in Figure 3 do not so much represent a complete account of the composition, or the “correct” answer, as they are consistent with the subsequent time evolution of the spectrum toward maximum light, and therefore serve to construct characteristic standards for direct comparative diversity assessments.
Said another way, it is the full time series dataset that enables the best initial spectrum solution hypothesis, which can be further tested and refined for the approximate measurement of SN Ia features (Branch et al., 2007a). Therefore, this idea of a unique set of ions remains open sincewith current limiting datasetsspecies with minimal constraint and competing line transfer processes can be ambiguously present141414See Fig. 9 of Stritzinger et al. (2013) to see clear detections of permitted Co II lines in the NIR spectra of the peculiar and faint SN 2010ae., even for data with an infinite S/N (i.e. sources with few strong lines, or lines predominately found blue ward of 6100 Å, e.g., C III, O III, Si IV, Fe I, Co II, Ni II). One can still circumvent these uncertainties of direct analysis by either using dense time series observations (e.g., Parrent et al. 2012) or by ruling out spurious inferred detections by including adjacent wavelength regions into the spectroscopic analysis (UVopticalNIR; see Foley et al. 2012b; Hsiao et al. 2013; Mazzali et al. 2013).
2.3 Models
A detailed account of SN Ia models is beyond the scope of our general review of SN Ia spectra (for the latest discussions, see Wang & Han 2012; Nomoto et al. 2013; Hillebrandt et al. 2013; Calder et al. 2013; Maoz et al. 2013). However, in order to understand the context by which observations are taken and synthetic comparisons made, here we only mention the surface layer of matters relating to observed spectra. For some additional recent modeling work, see Fryer & Diehl (2008), Bravo et al. (2009), Jordan et al. (2009), Kromer et al. (2010), Blondin et al. (2011), Hachisu et al. (2012), Jordan et al. (2012), Pakmor et al. (2013), Seitenzahl et al. (2013), Dan et al. (2013), Kromer et al. (2013b), Moll et al. (2013), and Raskin et al. (2013).
Realistic models are not yet fully ready because of the complicated physical conditions in the binary stellar evolution that leads up to an expanding SN Ia atmosphere. For instance, the explosive conditions of the SN Ia problem take place over a large dynamic range of relevant length-scales (RWD 1R⊕ and flame-thicknesses of 0.1 cm; Timmes & Woosley 1992; Gamezo et al. 1999), involve turbulent flames that are fundamentally multi-dimensional (Khokhlov, 1995, 2000; Reinecke et al., 2002a, b; Gamezo et al., 2003, 2005; Seitenzahl et al., 2013), and consist of uncertainties in both the detonation velocity (Domínguez & Khokhlov, 2011) and certain nuclear reaction rates, especially 12C12C (Bravo et al. 2011, however see also Bravo & Martínez-Pinedo 2012; Chen et al. 2013).
Most synthetic spectra are angle-averaged representations of higher-dimensional detailed models. Overall, the observed spectra of normal SN Ia have differed less amongst themselves than that of some detailed models compared to the data of normal SN Ia. This is not from a lack of efforts, but is simply telling of the inherent difficulty of the problem and limiting assumptions and interests of various calculations. Kasen et al. (2008) reviewed previous work done of N-dimensional SN Ia models and presented the first high-resolution 3D calculation of a SN Ia spectrum at maximum light. Their results are still in a state of infancy, however they represent the first step toward the ultimate goal of SN Ia modeling, i.e. to trace observed SN Ia properties and infer the details of the progenitor and its subsequent disruption by comparing 3D model spectra and light curves of 3D explosion simulations with the best observed temporal datasets.
Still, progress has been made in understanding general observed properties of SN Ia and their relation to predictions of simulated explosion models. For example, one-dimensional (1D) numerical models of SN Ia have been used in the past to test the possible explosion mechanisms such as subsonic flame or supersonic detonation models, as well as conjoined delayed-detonations (e.g., Arnett 1968; Nomoto et al. 1984; Lentz et al. 2001a). The one-dimensional models disfavor the route of a pure thermonuclear detonation as the mechanism to explain most SN Ia events (Hansen & Wheeler, 1969; Arnett, 1969; Axelrod, 1980). Such a mechanism produces mostly 56Ni and almost none of the IMEs observed in the spectra of all SN Ia (e.g., Branch et al. 1982; Filippenko 1997; Gamezo et al. 1999; Pastorello et al. 2007a).
However, one-dimensional models have shown that a detonation can produce intermediate mass elements if it propagates through a Chandrasekhar-mass WD that has pre-expanded during an initial deflagration stage (Khokhlov, 1991a; Yamaoka et al., 1992; Khokhlov et al., 1993; Arnett & Livne, 1994a, b; Wheeler et al., 1995; Hoflich et al., 1995; Khokhlov et al., 1997). To their advantage, these deflagration-to-detonation transition (DDT) and pulsating delayed-detonation (PDD) models are able to reproduce the observed characteristics of SN Ia, however not without the use of an artificially-set transition density between stages of burning (Khokhlov, 1991b; Hoflich et al., 1995; Lentz et al., 2001a, b; Baron et al., 2008; Bravo et al., 2009; Dessart et al., 2013a). Subsequently, a bulk of the efforts within the modeling community has been the pursuit of conditions or mechanisms which cause the burning front to naturally transition from a sub-sonic deflagration to a super-sonic detonation, e.g., gravitationally confined detonations (Jordan et al., 2009), prompt detonations of merging WDs, a.k.a. “peri-mergers” (Moll et al., 2013).
With the additional possibility that the effectively burned portion of the progenitor is enclosed or obscured by some body of circumstellar or envelope/disk of material (see Sternberg et al. 2011; Foley et al. 2012a; Förster et al. 2012; Scalzo et al. 2012; Raskin & Kasen 2013; Silverman et al. 2013d; Dan et al. 2013; Dessart et al. 2013a; Moll et al. 2013), the intrinsically multi-dimensional nature of the explosion itself is also expected to manifest signatures of asymmetric plumes of burned material and pockets of unburned material within a spheroidal debris field of flexible asymmetries (see Khokhlov 1995; Niemeyer & Hillebrandt 1995; Gamezo et al. 2004; Wang & Wheeler 2008; Patat et al. 2009; Kasen et al. 2009). Add to this the degeneracy of SN Ia flux behaviors, i.e. colors are sensitive to dust/CSM extinction and intrinsic dispersions in the same direction (Tripp & Branch, 1999), whether large or small redshift-color dependencies (Saha et al., 1999; Jha et al., 1999; Parodi et al., 2000; Wang et al., 2008a; Goobar, 2008; Wang et al., 2009a; Foley & Kasen, 2011; Mohlabeng & Ralston, 2013), and we find the true difficulty in constraining SN Ia models.
Blondin et al. (2013) recently presented and discussed the photometric and spectroscopic properties at maximum light of a sequence of 1D DDT explosion models, with ranges of synthesized 56Ni masses between 0.18 and 0.81 M⊙. In addition to showing broad consistencies with the diverse array of observed SN Ia properties, the synthetic spectra of Blondin et al. (2013) predict weaker absorption features of unburned oxygen (O I 7774) at maximum light, in proportion to the amount of 56Ni produced. This is to be expected (Hoflich et al., 1995), however constraints on the remaining amount of unburned material, in addition to its temporal behavior, are more readily seen during the earliest epochs (within the outermost layers of ejecta) via C II 6580 and O I 7774 (Thomas et al., 2007; Parrent et al., 2011; Nugent et al., 2011). Consequently, temporal spectrum calculations of detailed explosion models are needed for the purposes of understanding why the properties of SN Ia are most divergent well before maximum light (Branch et al., 2006; Dessart et al., 2013a).
Nucleosynthesis in two-dimensional (2D) delayed detonation models of SN Ia were explored by Maeda et al. (2010a). In particular, they focused on the distribution of species in an off-center DDT model and found the abundance tomography to be stratified, with an inner region of 56Ni surrounded by an off-center shell of electron-capture elements (e.g., Fe54, Ni58). Later, Maeda et al. (2010b) investigated the late time emission profiles associated with this off-center inner-shell of material within several observed SN Ia and found a correlation between possible nebular-line Doppler shifts along the line-of-sight and the rate-of-decline of Si II velocities at earlier epochs. Their interpretation is to suggest that some SN Ia subtypes may represent two different hemispheres of the “same” SN Ia (LVG vs. HVG subtypes; see §3.2). Moreover, the findings of Maeda et al. (2010b) and Maund et al. (2010b) remain largely consistent with the additional early and late time observations of the well-observed SN 2011fe (Smith et al., 2011; McClelland et al., 2013) and those of larger SN Ia samples (Blondin et al., 2012; Silverman et al., 2013a). However, even the results of Maeda et al. (2010b) and others that rely on spectroscopic measurements at all epochs are not without reservation given that late time emission profiles are subject to more than line-shifts due to Doppler velocities and ionization balance (Bongard et al., 2008; Friesen et al., 2012).
Seitenzahl et al. (2013) presented 14 3-dimensional (3D) high resolution Chandrasekhar-mass delayed-detonations that produce a range of 56Ni (depending on the location of ignition points) between 0.3 and 1.1 M⊙. For this set of models, unburned carbon extends down to 4000 km s-1 while oxygen is not present below 10,000 km s-1. Seitenzahl et al. (2013) conclude that if delayed-detonations are to viably produce normal SN Ia brightnesses, the region of ignition cannot be far off-center so as to avoid the over-production of 56Ni. As noted by Seitenzahl et al. (2013), these models warrant tests via spectrum synthesis given their 3D nature and possible predictive relations to the WLR, spectropolarimetry, and CO “footprints” (Howell et al., 2001; Baron et al., 2003; Thomas et al., 2007; Wang & Wheeler, 2008).
Dessart et al. (2013a) recently compared synthetic light curves and spectra of a suite of DDT and PDD models. Based on comparisons to SN 2002bo and SN 2011fe, two SN Ia of different spectroscopic subtypes, and based on poor to moderate agreement between recent DDT models and observed SN Ia diversity (Blondin et al., 2011), Dessart et al. (2013a) convincingly argue that these two SN Ia varieties (LVG vs. HVG, as above) are dissimilar enough to be explained by different explosion scenarios and/or progenitor systems (Wang et al., 2013c). For SN Ia in general, delineating spectroscopic diversity has been a difficult issue (Benetti et al., 2005; Branch et al., 2009), and has only recently been made clear with the belated release of decades-worth of unpublished data (Blondin et al., 2012; Silverman et al., 2012c).
3 Spectroscopic Diversity of SN Ia
Observationally and particularly at optical wavelengths, SN Ia increase in brightness over 13 to 23 days before reaching maximum light ( = 17.38 0.17; Hayden et al. 2010b). However, it is not until 1 year later that the period of observation is said to be “complete.” From the time of the explosion our perspective as outside observers begins at the outermost layers if the SN Ia is caught early enough. In the approximate sense, this is because the line-forming region (the “photosphere”) recedes as the ejecta expand outward, which in turn means that the characteristic information for each explosion mechanism and progenitor channel is specified by the temporal spectrophotometric attributes of the “inner” and “outer” layers of freshly synthesized and remaining primordial material. In addition, because the expanding material cools as it expands, the net flux of photons samples different layers (of different states and distributions) over time. And since the density profile of the material roughly declines from the center outward, significant changes within the spectra for an individual SN Ia take place daily before or near maximum light, and weekly to monthly thereafter.
Documenting the breadth of temporal spectroscopic properties for each SN Ia is not only useful for theoretical purposes, but is also necessary for efficiently typing and estimating the epoch of newly found possible supernova candidates before they reach maximum light. Several supernova identification tools have been made that allow for fair estimates of both subtype and epoch (e.g., SNID; Blondin & Tonry 2007, Gelato; Harutyunyan et al. 2008, Superfit; Howell et al. 2005). In addition, the spectroscopic goodness-of-fit methods of Jeffery et al. (2007) allow one to find the “nearest neighbors” of any particular SN Ia within a sample of objects, enabling the study of so called “transitional subtype” SN Ia (those attributed with contrasting characteristics of two or more subtypes).
3.1 Data
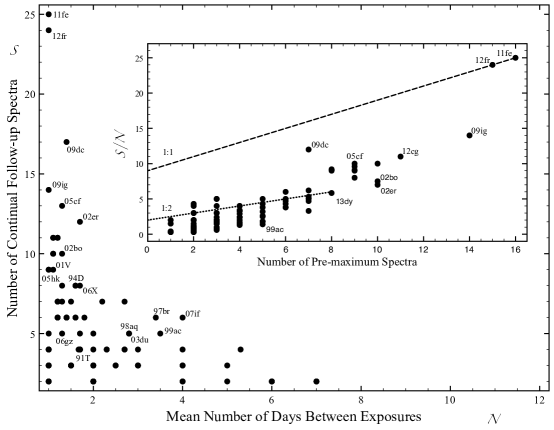
One of the major limitations of spectroscopic studies has been data quality. For example, the signal-to-noise ratio, S/N, of a spectrum signifies the quality across wavelength and is usually moderate to high for high-z events. Similarly, and at least for low-z SN Ia, there should exist a quantity that specifies the density of spectra within a time series dataset. We suggest /() the number of continual follow-up spectra / the mean number of nights passed between exposures (total number of spectra prior to maximum light). In Figure 4 we apply this quantity to literature data.
An ideal dataset consisting of 25 spectra during the first 25 days post-explosion would yield /() = 25 (16) (e.g., SN 2011fe), whereas a dataset of spectra at days 12, 10, 7, 4, 0, 3, 8, 21, 48, 119 (a common occurrence) would be said to have /() = 3.3 (4) plus follow-up at days 21, 48, and 119. By including the total number of spectra prior to maximum light in parentheses, we are anticipating those cases where / = 1, but with = 3, e.g., a dataset with days 12, 9, and 6 observed. It may serve a purpose to also add second and third terms to this quantity that take into account the number of post-maximum light and late time spectra.
Regardless of moniker and definition, a quantity that specifies the density of spectra observed during the earliest epochs would aid in determining, quantitatively, which datasets are most valuable for various SN Ia diversity studies. Clearly such a high follow-up rate for slow-evolving events (e.g., SN 2009dc) or events caught at maximum light are not as imperative. However, when SN Ia are found and typed early, a high / ensures no loss of highly time sensitive information, e.g., when high velocity features and CO signatures dissipate. Since most datasets are less than ideal for detailed temporal inspections of many events (by default), astronomers have instead relied upon comparative studies (§3.2); those that maximize sample sizes by prioritizing the most commonly available spectroscopic observables, e.g., line velocities of 6100 Å absorption minima near maximum light.
Another limitation of spectroscopic studies has been the localized release of all published data. The Online Supernova Spectrum Archive (SuSpect151515http://suspect.nhn.ou.edu/~suspect/; Richardson et al. 2001) carried the weight of addressing data foraging during the past decade, collecting a total of 867 SN Ia spectra (1741 SN spectra in all). Many of these were either at the request of or donation to SuSpect, while some other spectra were digitized from original publications in addition to original photographic plates (Casebeer et al., 1998, 2000). Prior to and concurrent with SuSpect, D. Jeffery managed a collection of SUpernova spectra PENDing further analysis (SUSPEND161616http://nhn.nhn.ou.edu/~jeffery/astro/sne/spectra/spectra.html).
With the growing need for a manageable influx of data, the Weizmann Interactive Supernova Data Repository (WISeREP171717www.weizmann.ac.il/astrophysics/wiserep/; Yaron & Gal-Yam 2012) has since served as a replacement and ideal central data hub, and has increased the number of SN Ia spectra to 7661 (with 7933 publicly available SN spectra out of 13,334 in all). We encourage all groups to upload published data to WISeREP, whether or not made available elsewhere.
3.1.1 Samples
By far the largest data releases occurred during the past five years, and are available on WISeREP and their affiliated archives. Matheson et al. (2008) and Blondin et al. (2012) presented 2603 optical spectra (37007500 Å on average) of 462 nearby SN Ia ( = 0.02; 85 Mpc) obtained by the Center for Astrophysics (CfA) SN group with the F. L. Whipple Observatory from 1993 to 2008. They note that, of the SN Ia with more than two spectra, 313 SN Ia have eight spectra on average. Silverman et al. (2012a) and the Berkeley SuperNova Ia Program (BSNIP) presented 1298 optical spectra (330010,400 Å on average) of 582 low-redshift SN Ia (z 0.2; 800 Mpc) observed from 1989 to 2008. Their dataset includes spectra of nearly 90 spectroscopically peculiar SN Ia. Folatelli et al. (2013) released 569 optical spectra of 93 low-redshift SN Ia ( 0.04; 170 Mpc) obtained by the Carnegie Supernova Project (CSP) between 2004 and 2009. Notably, 72 CSP SN Ia have spectra earlier than 5 days prior to maximum light, however only three SN Ia have spectra as early as day 12.
These samples provide a substantial improvement and crux by which to explore particular issues of SN Ia diversity. However, the remaining limitation is that our routine data collection efforts continue to yield several thousand SN Ia with few to several spectra by which to dissect and compare SN Ia atmospheres.
3.1.2 Comparisons of “Well-Observed” SN Ia
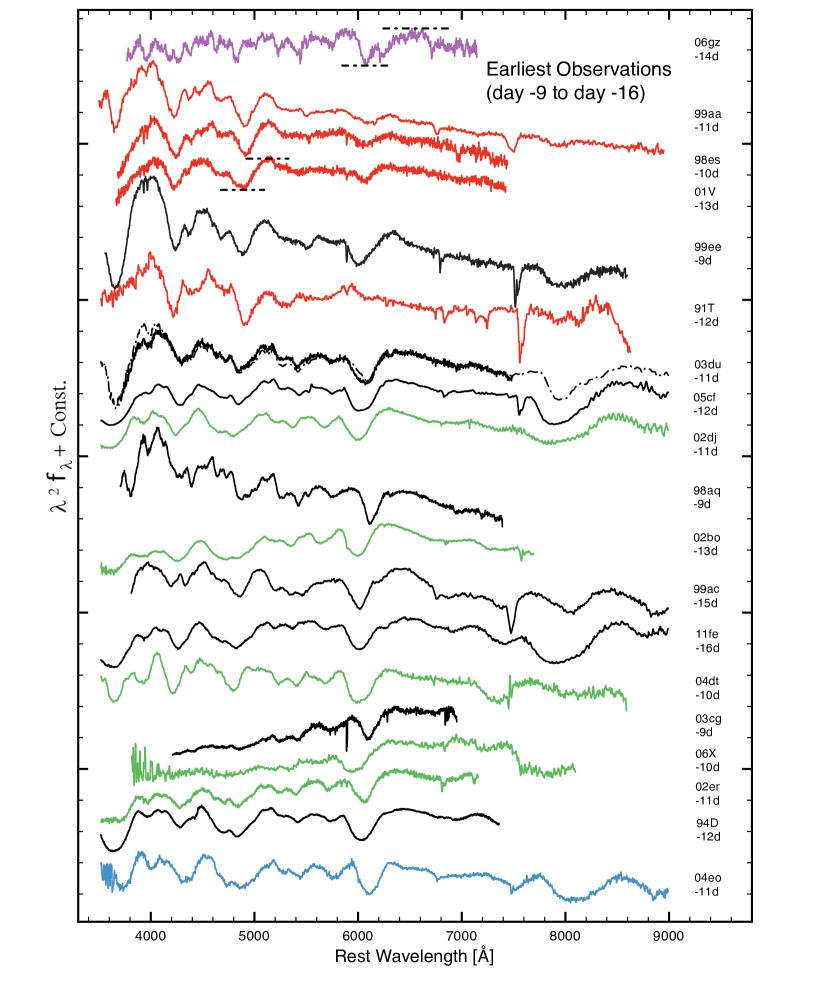
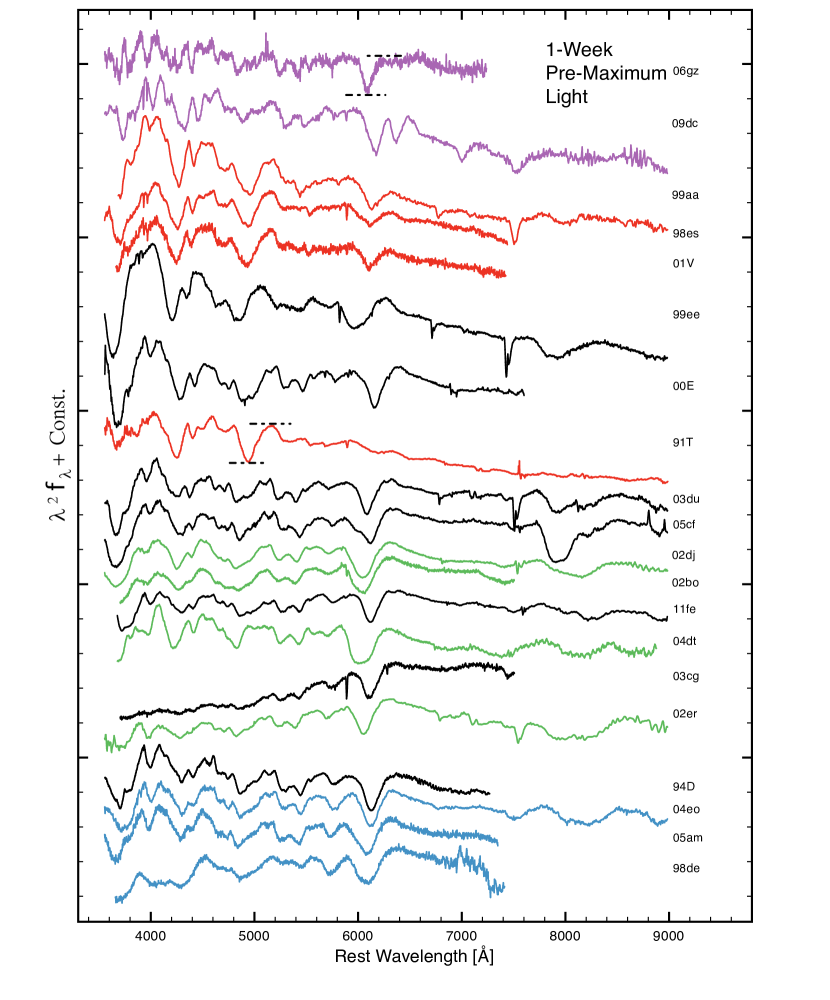
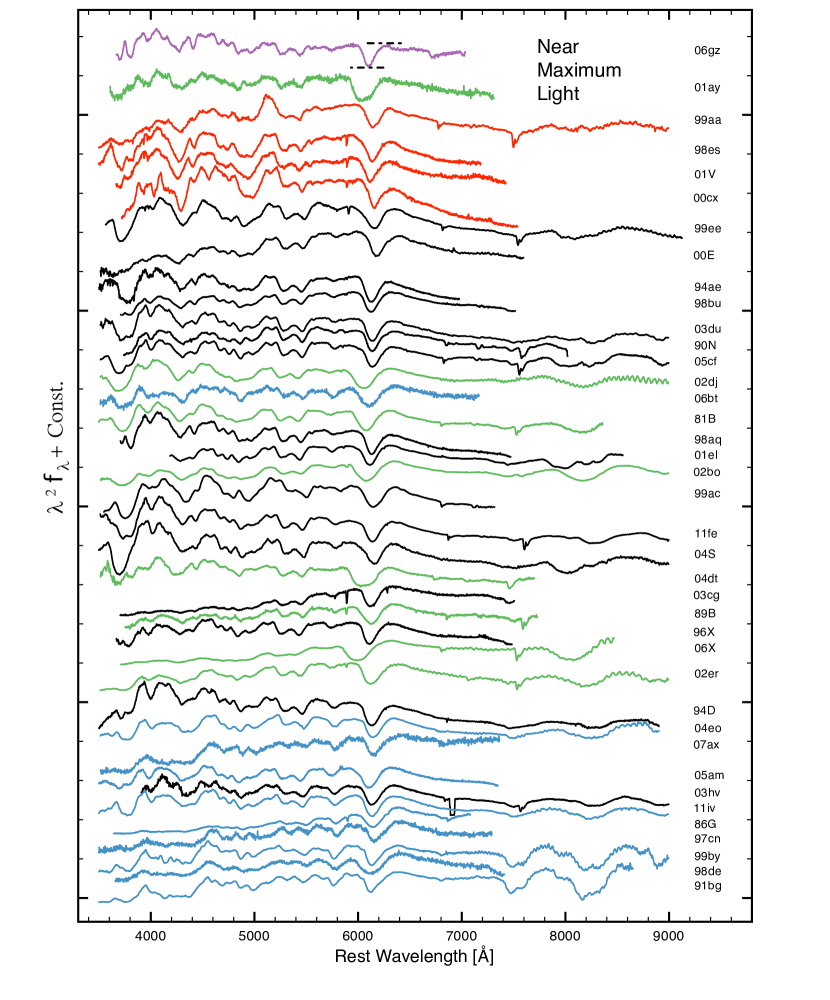
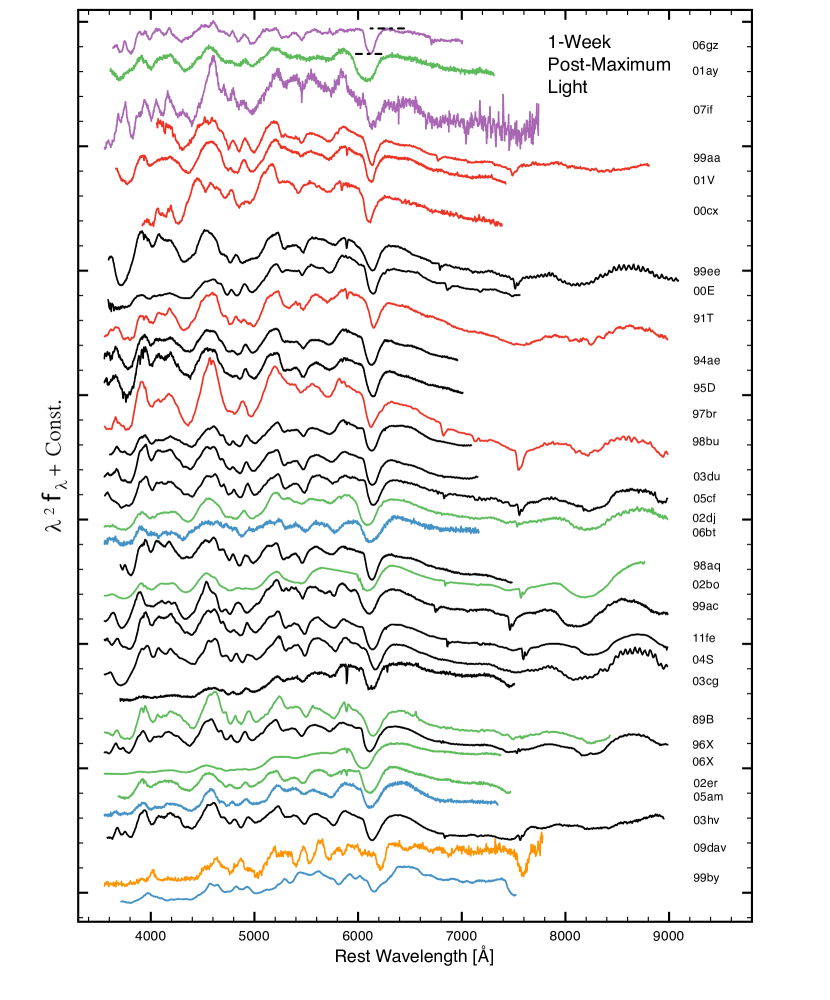
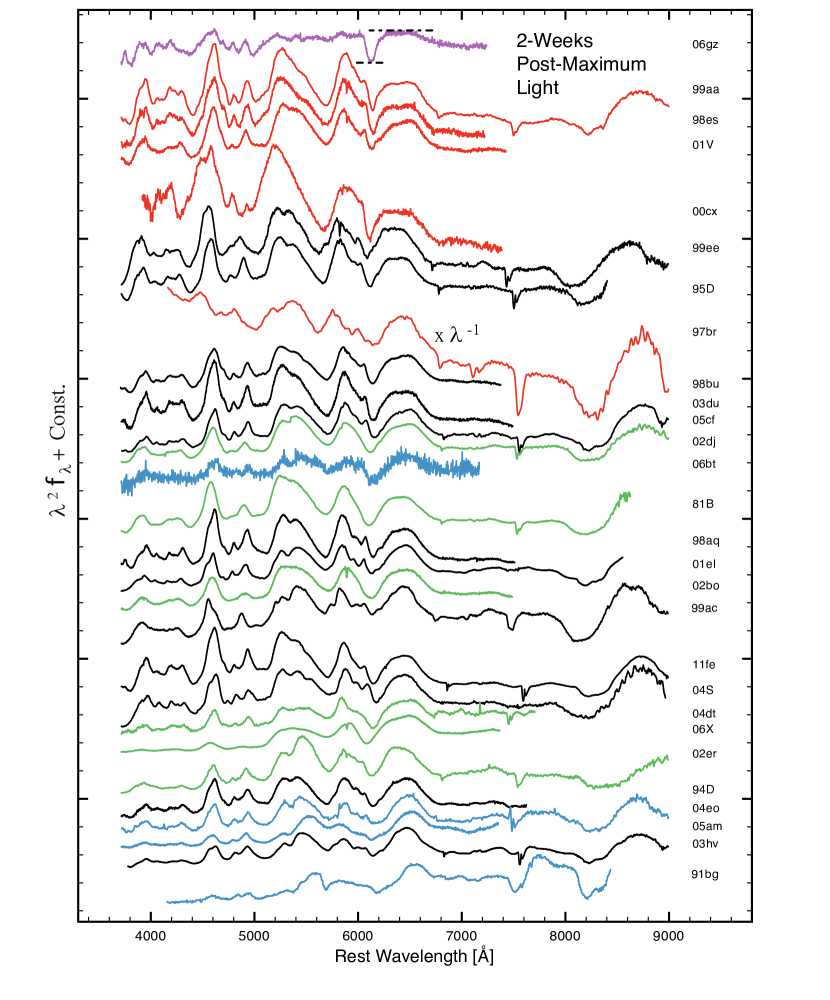
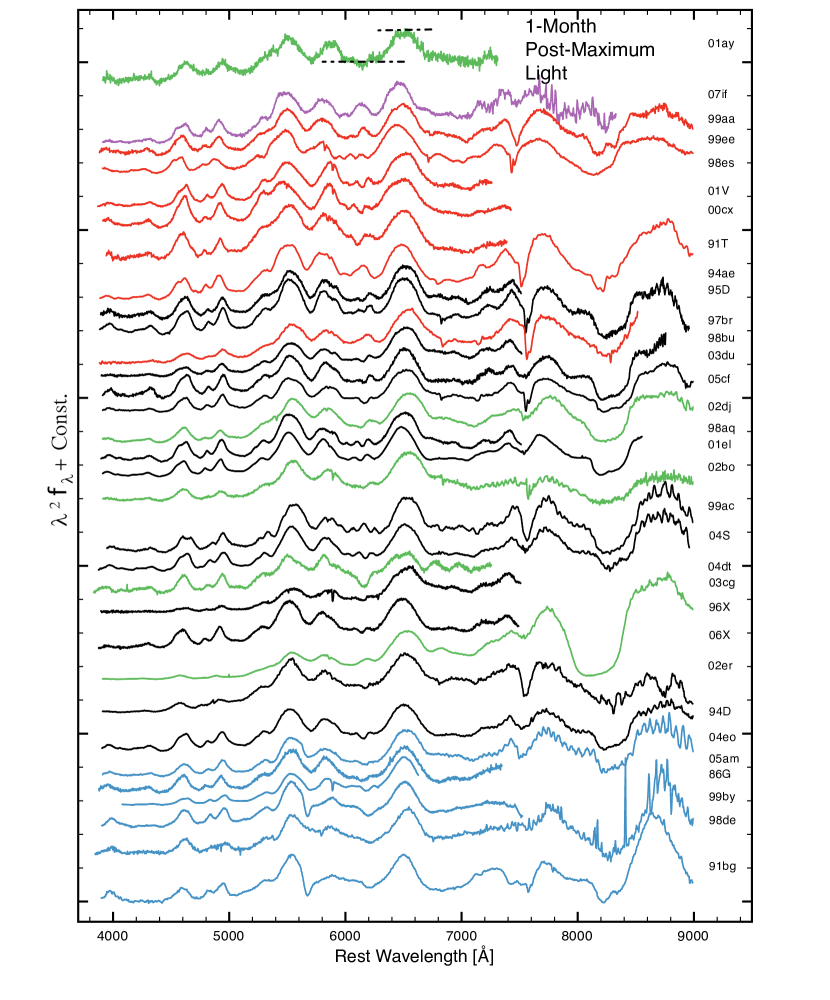
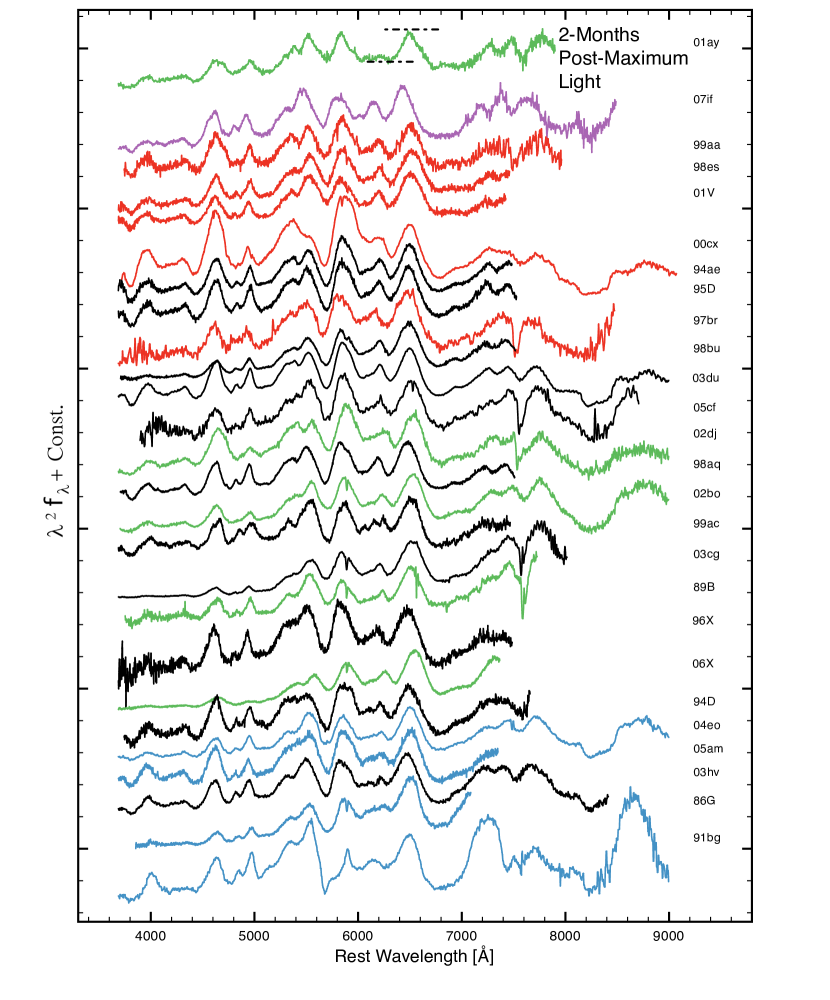
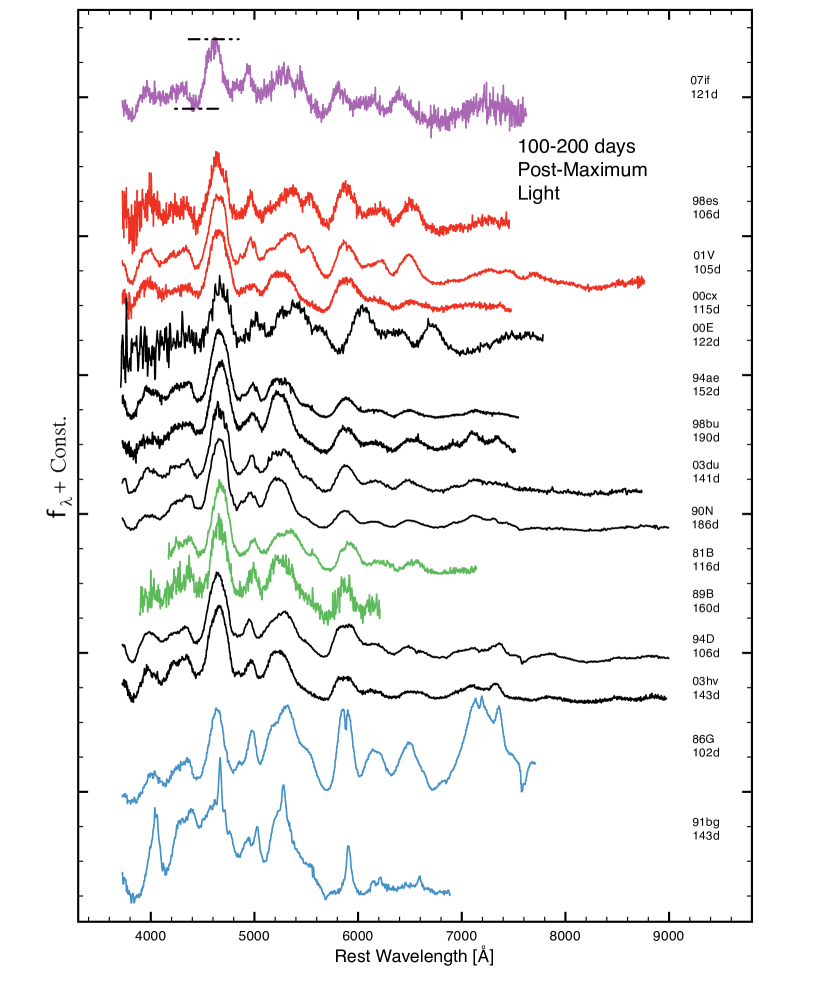
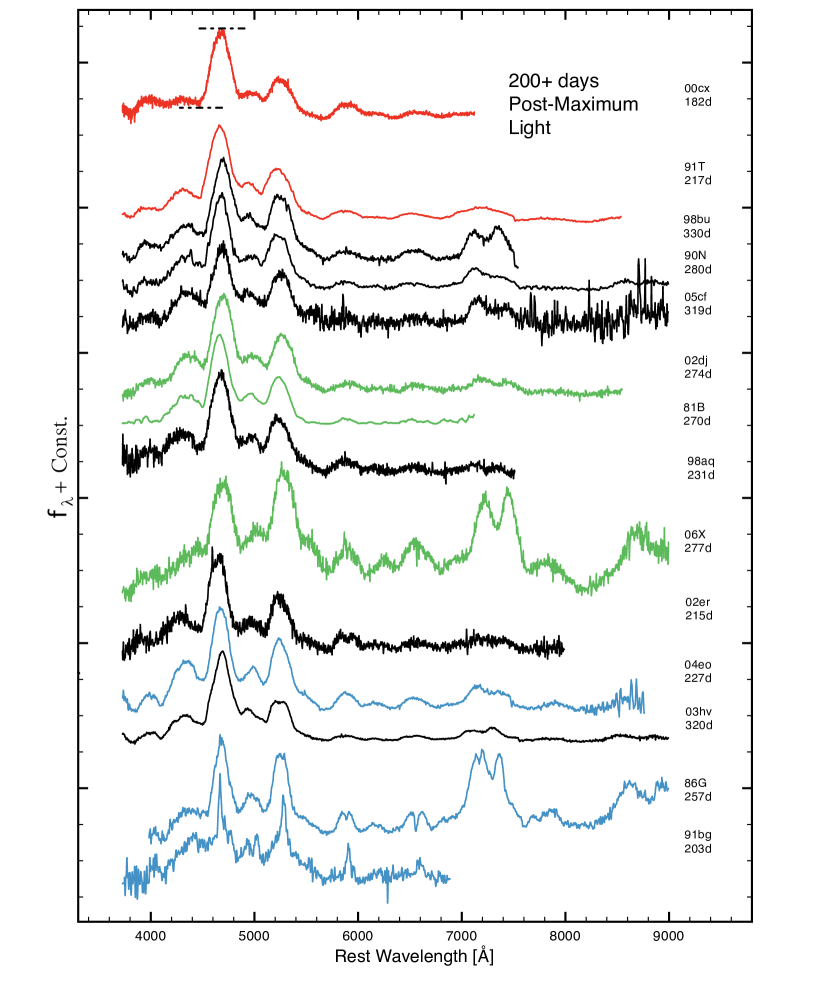
Given that both quantitative and qualitative spectrum comparisons are at the heart of SN Ia diversity studies, in Figure 5 - Figure 13 we plot spectroscopic temporal snapshots for as many “well-observed” SN Ia as are currently available on WISeREP (Tables 1 and 2). Because the decline parameter, m15(B), remains a useful parameter for probing differences of synthesized 56Ni mass, properties of the ejecta, limits of CSM interaction, etc., we have loosely ordered the spectra with increasing m15(B) (top-down) based on average values found throughout the literature (Tables 36) and M(peak) considerations for cases that are reported as having the same m15(B). The spectra have been normalized with respect to 6100 Å line profiles in order to amplify relative strengths of the remaining features (see caption of Figure 5). We also denote the spectroscopic subtype for each object in color in order to show the overlap of these properties between particular SN Ia subclasses (see §3.2 and Blondin et al. 2012).
By inspection, the collected spectra show how altogether different and similar SN Ia (both odd and normal varieties) have come to be since nearly 32 years ago. With regard to the recent modeling of Blondin et al. (2013) and their accompanying synthetic spectra, we plot the spectra in Figure 5 - Figure 11 in the flux-representation of Fλ for ease of future comparisons. These juxtapositions should reveal the severity of the SN Ia diversity problem as well as the future of promising studies and work that lie ahead.
3.2 Deciphering 21st Century SN Ia Subtypes
Observationally, the whole of SN Ia are hetero-, homogeneous events (Oke & Searle, 1974; Filippenko, 1997); some of the observed differences in their spectra are clear, while other suspected differences are small enough to fall below associable certainty. Because of this, observational studies have concentrated on quantitatively organizing a mapping between the most peculiar and normal events. In this section our aim is to review SN Ia subtypes. In all, three observational classification schemes will be discussed (Benetti et al., 2005; Branch et al., 2006; Wang et al., 2009a), as well as the recent additions of so-called over- and sub-luminous events (see Scalzo et al. 2012, Foley et al. 2013, Silverman et al. 2013d and references therein). For other relatively new and truly peculiar subclasses of supernova transients, we refer the reader to Shen et al. (2010), Kasliwal et al. (2012) and references therein.
3.2.1 Benetti et al. (2005) Classification
Understanding the origin of the WLR is a key issue for understanding the diversity of SN Ia light curves and spectra, as well as their use as cosmological distance indicators. Brighter SN Ia with broader light curves tend to occur in late-type spiral galaxies, while dimmer, faster declining SN Ia are preferentially located in an older stellar population and thus the age and/or metallicity of the progenitor system may be relevant factors affecting SN Ia properties (Hamuy et al. 1995; Howell 2001; Pan et al. 2013, see also Hicken et al. (2009a)).
With this in mind, Benetti et al. (2005) studied the observational properties of 26 well-observed SN Ia (e.g., SN 1984A, 1991T, 1991bg, 1994D) with the intent of exploring SN Ia diversity. Based on the observed projected Doppler velocity evolution from the spectra181818The velocity gradientthe mean velocity decline rate v/tof a particular absorption minimum (e.g., v̇) has been redefined to be measured over a fixed phase range [t0, t1] (Blondin et al., 2012)., in conjunction with characteristics of the light curve (MB, m15), Benetti et al. (2005) considered three different groups of SN Ia: (1) “FAINT” SN 1991bg-likes, (2) “low velocity gradient” (LVG) SN 1991T/1994D-likes, and (3) “high velocity gradient” (HVG) SN 1984A-like events. The velocity gradient here is based on the time-evolution of 6100 (“6150”) Å absorption minima as inferred from Si II 6355 line velocities. Overall, HVG SN Ia have higher mean expansion velocities than FAINT and LVG SN Ia, while LVG SN Ia are brighter than FAINT and HVG SN Ia on average (Silverman et al., 2012b; Blondin et al., 2012). Given an apparent separation of SN Ia subgroups from this sample of 26 objects, Benetti et al. (2005) considered it as evidence that LVG, HVG, and FAINT classifications signify three distinct kinds of SN Ia.
3.2.2 Branch et al. (2006) Classification
Branch et al. (2005, 2006, 2007b, 2008, 2009) published a series of papers based on systematic, comprehensive, and comparative direct analysis of normal and peculiar SN Ia spectra at various epochs with the parameterized supernova synthetic spectrum code, SYNOW191919SYNOW is a simplified spectrum synthesis code used for the timely determination and measurement of all absorption features complexes. SYNOW has been updated (SYN++) and can be used as an automated spectrum fitter (SYNAPPS; see Thomas et al. 2011a and https://c3.lbl.gov/es/). (Fisher, 2000; Branch et al., 2007a). From the systematic analysis of 26 spectra of SN 1994D, Branch et al. (2005) infer a compositional structure that is radially stratified, overall. In addition, several features are consistent with being due to permitted lines well into the late post-maximum phases (120 days, see Branch et al. 2008; Friesen et al. 2012). Another highlight of this work is that, barring the usual short comings of the model, SYNOW is shown to provide a necessary consistency in the direct quantification of spectroscopic diversity (Branch et al., 2007a). Consequently, the SYNOW model has been useful for assessing the basic limits of a spectroscopic “goodness of fit” (Figure 3), with room for clear and obvious improvements (Friesen et al., 2012).
In their second paper of the series on comparative direct analysis of SN Ia spectra, Branch et al. (2006) studied the spectra of 24 SN Ia close to maximum light. Based on empirical pEW measurements of 5750, 6100 Å absorption features, in addition to spectroscopic modeling with SYNOW, Branch et al. (2006) organized SN Ia diversity by four spectroscopic patterns: (1) “Core-Normal” (CN) SN 1994D-likes, (2) “Broad-line” (BL), where one of the most extreme cases is SN 1984A, (3) “Cool” (CL) SN 1991bg-likes, and (4) “Shallow-Silicon” (SS) SN 1991T-likes. In this manner, a particular SN Ia is defined by its spectroscopic similarity to one or more SN Ia prototype via 5750, 6100 Å features. These spectroscopic subclasses also materialized from analysis of pre-maximum light spectra (Branch et al., 2007b).
The overlap between both Benetti et al. (2005) and Branch et al. (2006) classifications schemes comes by comparing Table 1 in Benetti et al. (2005) to Table 1 of Branch et al. (2006), and it reveals the following SN Ia descriptors: HVGBL, LVGCN, LVGSS, and FAINTCL. This holds true throughout the subsequent literature (Branch et al., 2009; Folatelli et al., 2012; Blondin et al., 2012; Silverman et al., 2012b).
In contrast with Benetti et al. (2005) who interpreted FAINT, LVG, and HVG to correspond to the “discrete grouping” of distinctly separate SN Ia origins among these subtypes, Branch et al. (2006) found a continuous distribution of properties between the four subclasses defined above. We should point out that this classification scheme of Branch et al. (2006) is primarily tied to the notion that SN Ia spectroscopic diversity is related to the temperature sequence found by Nugent et al. 1995. That is, despite the contrast with Benetti et al. (2005) (continuous versus discrete subgrouping of SN Ia), so far these classifications say more about the state of the ejecta than the various number of possible progenitor systems and/or explosion mechanisms (see also Dessart et al. 2013a). Furthermore, the existence of “transitional” subtype events support this notion (e.g., SN 2004eo, 2006bt, 2009ig, 2001ay, and PTF10ops; see appendix).
Branch et al. (2009) later analyzed a larger sample of SN Ia spectra. They found that SN 1991bg-likes are not a physically distinct subgroup (Doull & Baron, 2011), and that there are probably many SN 1999aa-like events (A.5) that similarly may not constitute a physically distinct variety of SN Ia.
With regard to the fainter variety of SN Ia, Doull & Baron (2011) made detailed comparative analysis of spectra of peculiar SN 1991bg-likes. They also studied the intermediates, such as SN 2004eo (A.23), and discussed the spectroscopic subgroup distribution of SN Ia. The CL SN Ia are dim, undergo a rapid decline in luminosity, and produce significantly less 56Ni than normal SN Ia. They also have an unusually deep and wide trough in their spectra around 4200 Å suspected as due to Ti II (Filippenko et al., 1992b), in addition to a relatively strong 5750 Å absorption (due to more than Si II 5972; see Bongard et al. 2008). Doull & Baron (2011) analyzed the spectra of SN 1991bg, 1997cn, 1999by, and 2005bl using SYNOW, and found this group of SN Ia to be fairly homogeneous, with many of the blue spectral features well fit by Fe II.
3.2.3 Wang et al. (2009a) Classification
Based on the maximum light expansion velocities inferred from Si II 6355 absorption minimum line velocities, Wang et al. (2009a) studied 158 SN Ia, separating them into two groups called “high velocity” (HV) and “normal velocity” (NV). This classification scheme is similar to those previous of Benetti et al. (2005) and Branch et al. (2006), where NV and HV SN Ia are akin to LVGCN and HVGBL SN Ia, respectively. That is, while the subtype notations differ among authors, memberships between these classification schemes are roughly equivalent (apart from outliers such as the HV-CN SN 2009ig, see Blondin et al. 2012).
Explicitly, Benetti et al. (2005) and Wang et al. (2009a) subclassifications are based on empirically estimated mean expansion velocities near maximum light (4 days; 500 2000 km s-1) of 6100 Å features produced by an assumed single broad component of Si II. The notion of a single photospheric layer, much less a single-epoch snapshot, does not realistically account for the multilayered nature of spectrum formation (Bongard et al., 2008), its subsequent evolution post-maximum light (Patat et al., 1996; Scalzo et al., 2012), and potential relations to line-of-sight considerations (Maeda et al., 2010b; Blondin et al., 2011; Moll et al., 2013). In the strictest sense of SN Ia sub-classification, “normal” refers to both of these subtypes since they differ foremost by a continuum of inferred mean expansion velocities and the extent of expansion opacities, simultaneously.
Furthermore, note from a sample of 13 LVG and 8 HVG SN Ia that Benetti et al. (2005) found 10 v̇ (km s-1 day-1) 67 (7) and 75 v̇ 125 (20) for each, respectively. Similarly, and from a sample of 14 LVG and 29 HVG SN Ia, Silverman et al. (2012b) report that 10 v̇ 445 (50) and 15 v̇ 290 (140) for LVG and HVG events, respectively. Additionally, the pEW measurements of 5750, 6100 Å absorption features (among others) are seen to share a common convergence in observed values (Branch et al., 2006; Hachinger et al., 2006; Blondin et al., 2012; Silverman et al., 2012b). The continually consistent overlap between the measured properties for these two SN Ia “subtypes” implies that the notion of a characteristic separation value for v̇ 70 km s-1 day-1 (including the inferred maximum light separation velocity, v0 12,000 km s-1) is still devoid of any physical significance beyond overlapping bimodal distributions of LVGCN and HVGBL SN Ia properties (see §5.3 of Silverman et al. 2012b, §5.2 of Blondin et al. 2012, and Silverman et al. 2012a). Rather, a continuum of empirically measured properties exists between the extremities of these two particular historically-based SN Ia classes (e.g., SN 1984A and 1994D). Given also the natural likelihood for a physical continuum between NV and HV subgroups, considerable care needs to be taken when concluding on underlying connections to progenitor systems from under-observed, early epoch snapshots of blended 6100 Å absorption minima.
Hence, the primary obstacle within SN Ia diversity studies has been that it is not yet clear if the expanse of all observed characteristics of each subtype has been fully charted. For the observed properties of normal SN Ia, it is at least true that v̇ resides between 10445 km s-1 day-1, with a median value of 60120 km s-1 day-1 (Benetti et al., 2005; Blondin et al., 2012; Silverman et al., 2012a), while the rise to peak B-band brightness ranges from 16.3 to 19 days (Ganeshalingam et al., 2011; Mazzali et al., 2013).
Recently, Wang et al. (2013c) applied this NV and HV subgrouping to 123 “Branch normal” SN Ia with known positions within their host galaxies and report that HV SN Ia more often inhabit the central and brighter regions of their hosts than NV SN Ia. This appears to suggest that a supernova with “higher velocities at maximum light” is primarily a consequence of a progenitor with larger than solar metallicities, or that PDD/HVG SN Ia are primarily found within the galactic distribution of DDT/LVG SN Ia (c.f. Blondin et al. 2011, 2012; Dessart et al. 2013a). This is seemingly in contrast to interpretations of Maeda et al. (2010b) who propose, based on both early epoch and late time considerations, that LVG and HVG SN Ia are possibly one in the same event where the LVG-to-HVG transition is ascribed to an off-center ignition.
While it is true that increasing the CO layer metallicity can affect the blueshift of the 6100 Å absorption featurein addition to lower temperatures and increased UV line-blockingthis is not primarily responsible for the shift in 6100 Å absorption minima (Lentz et al., 2001a, b), where the dependence of this effect is not easily decoupled from changes in the temperature structure (Lentz et al., 2000). However, it is also worthwhile to point out that, while the early epoch spectra of SN 2011fe (a NV event) are consistent with a DDT-like composition with a sub-solar CO layer metallicity (“W7+,” Mazzali et al. 2013) and a PDD-like composition (Dessart et al., 2013a), the outermost layers of SN 2010jn (a HV event; A.41) are practically void of unburned material and subsequently already overabundant in synthesized metals for progenitor metallicity to be well determined (Hachinger et al., 2013). Therefore, discrepancies between NV and HV SN Ia must still be largely dependent on more than a single parameter, e.g. differences in explosion mechanisms (Dessart et al., 2013a; Moll et al., 2013), where progenitor metallicity is likely to be only one of several factors influencing the dispersions of each subgroup (Lentz et al., 2000; Höflich et al., 2010; Wang et al., 2012).
It should be acknowledged again that metallicity-dependent aspects of stellar evolution are expected to contribute, in part, to the underlying variance of holistic SN Ia characteristics. However thus far, the seen discrepancies from metallicities share similarly uncertain degrees of influence as for asymmetry and line-of-sight considerations of ejecta-CSM interactions for a wide variety of SN Ia (Lentz et al., 2000; Kasen et al., 2003; Leloudas et al., 2013). Similar to this route of interpretation for SN Ia subtypes are active galactic nuclei and the significance of the broad absorption line quasi-stellar objects (BALQSOs, see de Kool & Begelman 1995; Becker et al. 1997; Elvis 2000; Branch et al. 2002a; Hamann & Sabra 2004; Casebeer et al. 2008; Leighly et al. 2009; Elvis 2012).
3.2.4 Additional Peculiar SN Ia Subtypes
Spectroscopically akin to some luminous SS SN Ia are a growing group of events thought to be “twice as massive,” aka super-Chandrasekhar candidates (SCC, Howell et al. 2006; Jeffery et al. 2006; Hillebrandt et al. 2007; Hicken et al. 2007; Maeda et al. 2009; Chen & Li 2009; Yamanaka et al. 2009a; Scalzo et al. 2010; Tanaka et al. 2010; Yuan et al. 2010; Silverman et al. 2011; Taubenberger et al. 2011; Kamiya et al. 2012; Scalzo et al. 2012; Hachinger et al. 2012; Yamanaka et al. 2013). Little is known about this particular class of over-luminous events, which is partly due to there having been only a handful of events studied. Thus far, SCC SN Ia are associated with metal-poor environments (Childress et al., 2011; Khan et al., 2011a). Spectroscopically, the differences that set these events apart from normal SN Ia are fairly weak Si II/Ca II signatures and strong C II absorption features relative to the strength of Si II lines. Most other features are comparable in relative strengths to those of normal SN Ia, if not muted by either top-lighting or effects of CSM interaction (Branch et al., 2000; Leloudas et al., 2013), and are less blended overall due to lower mean expansion velocities. In addition, there is little evidence to suggest that SCC SN Ia spectra consist of contributions from physically separate high velocity regions of material ( 4000 km s-1 above photospheric). This range of low expansion velocities (500018,000 km s-1), in conjunction with larger than normal C II absorption signatures, are difficult to explain with some MCh explosion models (Scalzo et al. 2012; Kamiya et al. 2012, however see also Hachisu et al. 2012; Dessart et al. 2013a; Moll et al. 2013 for related discussions).
Silverman et al. (2013d) recently searched the BSNIP and PTF datasets, in addition to the literature sample, and compiled a list of 16 strongly CSM interacting SN Ia (referred to as “Ia-CSM” events). These supernovae obtain their name from a conspicuous signature of narrow hydrogen emission atop a weaker hydrogen P Cygni profile that together are superimposed on a loosely identifiable SS-like SN Ia spectrum (Aldering et al., 2006; Prieto et al., 2007; Leloudas et al., 2013). Apart from exhibiting similar properties to the recent PTF11kx (§4.5.1) and SN 2005gj (§4.5.3), Silverman et al. (2013d) find that SN Ia-CSM have a range of peak absolute magnitudes (21.3 M 19), are a spectroscopically homogenous class, and all reside in late-type spiral and irregular host-galaxies.
As for peculiar sub-luminous events, Narayan et al. (2011) and Foley et al. (2013) discussed the heterogeneity of the SN 2002cx-like subclass of SN Ia. Consisting of around 25 members spectroscopically similar to SN 2002cx (Li et al., 2003), these new events generally have lower maximum light velocities spanning from 2000 to 8000 km s-1 and a range of peak luminosities that are typically lower than those of FAINT SN Ia (14.2 to 18.9). In addition, this class of objects have “hot” temperature structures andin contrast to SN Ia that follow the WLRhave low luminosities for their light curve shape. This suggests a distinct origin, such as a failed deflagration of a CO white dwarf (Foley et al., 2009; Jordan et al., 2012; Kromer et al., 2013a) or double detonations of a sub-Chandrasekhar mass white dwarf with non-degenerate helium star companion (Fink et al., 2010; Sim et al., 2012; Wang et al., 2013a). It is estimated that for every 100 SN Ia, there are 31\ce^17_13 peculiar SN 2002cx-like objects in a given volume (Foley et al., 2013).
3.2.5 SN Ia Subtype Summary
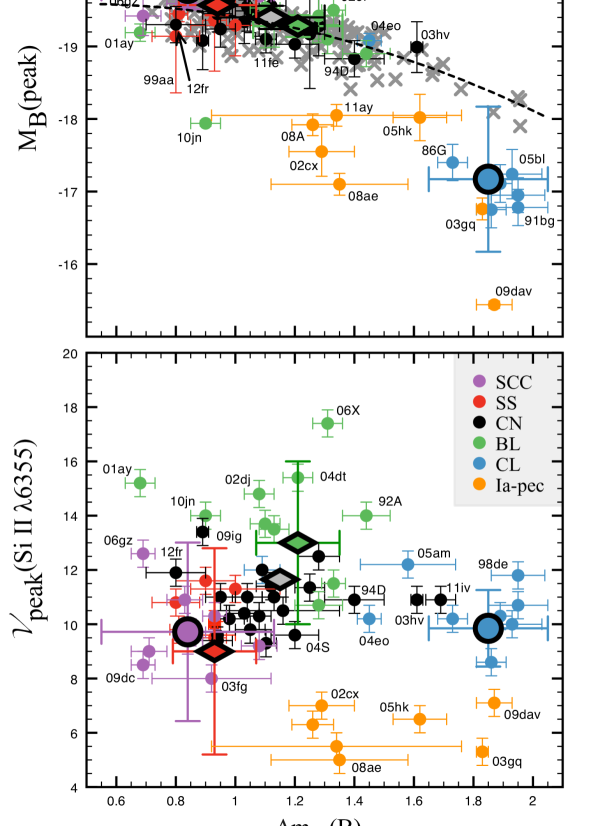
In Figure 14 we plot average literature values of M(peak), m15(B), and peak(Si II 6355) versus one another for all known SN Ia subtypes. For M(peak) versus m15(B), the WLR is apparent. We have included the brightest SN 2002cx-likes (Foley et al., 2013) for reference, as these events are suspected as having separate origins from the bulk of normal SN Ia (Hillebrandt et al., 2013). We have not included Ia-CSM events given that estimates of expansion velocities and luminosities, without detailed modeling, are obscured by CSM interaction. However, it suffices to say for Figure 14 that Ia-CSM are nearest to SS and SCC SN Ia in both projected Doppler velocities and peak M brightness (Silverman et al., 2013d). At a separate end of these SN Ia diversity plane(s), peak(Si II 6355) versus m15(B) further separates FAINTCL SN Ia and peculiar events away from the pattern between SCC/SN 1991T-like over-luminous SN Ia and normal subtypes, where the former tend to be slow-decliners (i.e. typically brighter) with slower average velocities.
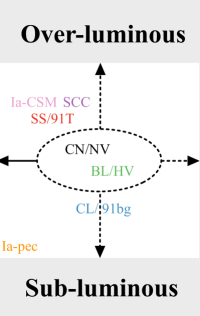
To summarize the full extent of SN Ia subtypes in terms of the qualitative luminosity and expansion velocity patterns, in Figure 15 we have outlined how SN Ia relate to one another thus far (for quantitative assessments, see Blondin et al. 2012; Silverman et al. 2012b; Folatelli et al. 2013). Broadly speaking, the red ward evolution of SN Ia features span low to high rates of decline for a large range of luminosities. Shallow Silicon and Super-Chandrasekhar Candidate SN Ia are by far the brightest, while Ia-CSM SN exhibit bright H emission features. These “brightest” SN Ia also show low to moderate expansion velocities and v̇. From BL to CN to SS/SSC SN Ia, mean peak absolute brightnesses scale up with an overall decrease in maximum light line velocities. Meanwhile, CL SN Ia fall between low velocity and high velocity gradients, but lean toward HVG SN Ia in terms of their photospheric velocity evolution. Comparatively, peculiar SN 2002cx-like and other sub-luminous events are by far the largest group of thermonuclear outliers.
Obtaining observations of SN Ia that lie outside the statistical norm is important for gauging the largest degree by which SN Ia properties diverge in nature. However, just as imperative for the cause remains filling the gaps of observed SN Ia properties (e.g., v̇, vneb, vC(t), vCa(t), M(peak), m15(B-band), trise, color evolution) with well-observed SN Ia. This is especially true for those SN Ia most similar to one another, aka “nearest neighbors” (Jeffery et al., 2007), and transitional-type SN Ia.
3.3 Signatures of CO Progenitor Material
If the primary star of most SN Ia is a CO WD, and if the observed range of SN Ia properties is primarily due to variances in the ejected mass or abundances of material synthesized in the explosion (e.g., 56Ni), then this should also be reflected in the remaining amount of carbon and oxygen if MCh is a constant parameter (see Maeda et al. 2010a; Blondin et al. 2013; Dessart et al. 2013a). On the other hand, if one assumes that the progenitor system is the merger of two stars (Webbink, 1984; Iben & Tutukov, 1984; Pakmor et al., 2013; Moll et al., 2013) or a rapidly rotating WD (Hachisu et al., 2012)both of which are effectively obscured by an amorphous region and/or disk of CO materialthen the properties of C and O absorption features will be sensitive to the interplay between ejecta and the remaining unburned envelope (see Livio & Pringle 2011).
Oxygen absorption features (unburned plus burned ejecta) are often present as O I 7774 in the pre-maximum spectra of SN Ia (Figure 5). They may exhibit similar behavior to those seen in SN 2011fe (§4.1), however current datasets lack the proper temporal coverage of a large sample of events that would be necessary to confirm such claims. Still, comparisons of the blue-most wing in the earliest spectra of many SN Ia to that of SN 2009ig (§4.2.1), 2010jn (A.41), 2011fe (§4.1), 2012cg (A.43), and 2012fr (§4.2.2) may reveal some indication of HV O I if present and if caught early enough (e.g., SN 1994D; Branch et al. 2005).
Spectroscopic detections of carbon-rich material have been documented since the discovery of SN 1990N (see Leibundgut et al. 1991; Jeffery et al. 1992; Branch et al. 2007b; Tanaka et al. 2008) and have been primarily detected as singly ionized in the optical spectra of LVGCN SN Ia (Parrent et al., 2011). However, NIR spectra of some SN Ia subtypes have been suspected of harboring C I absorption features (Höflich et al. 2002; Hsiao et al. 2013, see also Marion et al. 2006, 2009a), while C III has been tentatively identified in “hotter” SS/SN 1991T-like SN Ia (Hatano et al., 2002; Garavini et al., 2004; Chornock et al., 2006).
Observations of the over-luminous SCC SN 2003fg suggested the presence of a larger than normal C II 6580 absorption signature (Howell et al., 2006). Later in 2006, with the detection of a conspicuous C II 6580 absorption “notch” in the early epoch observations of the normal SN Ia, SN 2006D, Thomas et al. (2007) reconsidered the question of whether or not spectroscopic signatures of carbon were a ubiquitous property of all or at least some SN Ia subtypes.
As follow-up investigations, Parrent et al. (2011) and Folatelli et al. (2012) presented studies of carbon features in SN Ia spectra, particularly those of C II 6580, 7234 (which are easier to confirm than 4267, 4745). However weak, conspicuous 6300 Å absorption features were reported in several SN Ia spectra obtained during the pre-maximum phase. It was shown that most of the objects that exhibit clear signatures are of the LVGCN SN Ia subtype, while HVGBL SN Ia may either be void of conspicuous signatures due to severe line blending, or lack carbon altogether, the latter of which is consistent with DDT models (e.g., Hachinger et al. 2013) and could also be partially due to increased progenitor metallicities (Lentz et al., 2000; Meng et al., 2011; Milne et al., 2013). This requires further study and spectrum synthesis from detailed models.
Thomas et al. (2011b) presented additional evidence of unburned carbon at photospheric velocities from observations of 5 SN Ia obtained by the Nearby Supernova Factory. Detections were based on the presence of relatively strong C II 6300 Å absorption signatures in multiple spectra of each SN, supported by automated fitting with the SYNAPPS code (Thomas et al., 2011a). They estimated that at least 22\ce^+10_-6% of SN Ia exhibit spectroscopic C II signatures as late as day 5, i.e. carbon features, whether or not present in all SN Ia, are not often seen even as early as day 5.
Folatelli et al. (2012) later searched through the Carnegie Supernova Project (CSP) sample and found at least 30% of the objects show an absorption feature that can be attributed to C II 6580. Silverman & Filippenko (2012) searched for carbon in the BSNIP sample and found that 11% of the SN Ia studied show carbon absorption features, while 25% show some indication of weak 6300 Å absorption. From their sample, they find that if the spectra of SN Ia are obtained before day 5, then the detection percentage is higher than 30%. Recently it has also been confirmed that “carbon-positive” SN Ia tend to have bluer near-UV colors than those without conspicuous C II 6580 signatures (Thomas et al., 2011b; Silverman & Filippenko, 2012; Milne et al., 2013).
Silverman & Filippenko (2012) estimate the range of carbon masses in normal SN Ia ejecta to be (2 30) x 10-3 M⊙. For SN 2006D, Thomas et al. 2007 estimated 0.007 M⊙ of carbon between 10,000 and 14,000 km s-1 as a lower limit. Thomas et al. 2007 also note that the most vigorous model of Röpke et al. (2006) left behind 0.085 M⊙ of carbon in the same velocity interval. However, we are not aware of any subsequent spectrum synthesis for this particular model that details the state of an associated 6300 Å signature.
In the recent detailed study on SN Ia spectroscopic diversity, Blondin et al. (2012) searched for signatures of C II 6580 in a sample of 2603 spectra of 462 nearby SN Ia and found 23 additional “carbon-positive” SN Ia. Given that seven of the nine CN SN Ia reported by Blondin et al. (2012) with spectra prior to day 10 clearly exhibit signatures of C II, and that 3040% of the SN Ia within their sample are of the CN subtype, it is likely that at least 3040% of all SN Ia leave behind some amount of carbon-rich material, spanning velocities between 8000 18,000 km s-1 (Parrent et al., 2011; Pereira et al., 2013; Cartier et al., 2013).
Considering the volume-limited percentage of Branch normal SN Ia estimated by Li et al. (2011c), roughly 50% or more are expected to contain detectable carbon-rich material in the outermost layers. If this is true, then it implies that explosion scenarios that do not naturally leave behind at least a detectable amount (pEWs 525 Å) of unprocessed carbon can only explain half of all SN Ia or less (sans considerations of Ia-CSM progenitors, subtype-ejecta hemisphere dualities, and effects of varying metallicities; see below).
Historically, time-evolving signatures of C II 6580, 7234 from the computed spectra of some detailed models have not revealed themselves to be consistent with the current interpretations of the observations. This could be due to an inadequate lower-extent of carbon within the models (Thomas et al., 2007; Parrent et al., 2011; Blondin et al., 2012) or the limits of the resolution for the computed spectra (Blondin et al., 2011).
It should be noted that 6300 Å features are present in the non-LTE pre-maximum light spectra of Lentz et al. (2000) who assessed metallicity effects on the spectrum for a pure deflagration model (see their Fig. 7). Overall, Lentz et al. (2000) find that an increase in CO layer metallicities results in a decreased flux (primarily UV) in addition to a blue ward shift of absorption minima (primarily the Si II 6100 Å feature). While Lentz et al. (2000) did not discuss whether or not the weak 6300 Å absorption signatures are due to C II 6580, it is likely the case given that an increase in CO layer metallicities is responsible for the seen decrease in the strength of the 6300 Å feature. However, it should be emphasized that the “strength” of this supposed C II 6580 feature appears to be a consequence of how Lentz et al. (2000) renormalized abundances for metallicity enhancements in the CO layer. In other words, even though the preponderance of normal SN Ia with detectable C II 6580 notches are of the NV subgroup, the fact that HV SN Ia are thus far void of 6300 Å notches does not imply robust consistency with the idea that nearest neighbor HV SN Ia properties are solely the result of a progenitor with relatively higher metallicities (Lentz et al., 2001b). Such a claim would need to be verified by exploring a grid of models with accompanying synthetic spectra.
Additionally, carbon absorption features could signify an origin that is separate from explosion nucleosynthesis if most SN Ia are the result of a merger. For example, Moll et al. (2013) recently presented angle-averaged synthetic spectra for a few “peri-merger” detonation scenarios. In particular, they find a causal connection between “normal” C II 6580 signatures and the secondary star for both sub- and super-Chandrasekhar mass cases (c.f. Hicken et al. 2007; Zheng et al. 2013; Dessart et al. 2013a). With constraints from UV spectra (Milne et al., 2013) and high velocity features (§3.4), peri-megers can be used to explore the expanse of their spectroscopic influence within the broader picture of SN Ia diversity.
Coincident with understanding the relevance of remaining carbon-rich material is the additional goal of grasping the spectroscopic role of species that arise from carbon-burning below the outermost layers, e.g., magnesium (Wheeler et al., 1998). While signatures of Mg II 4481, 7890 are frequently observed at optical wavelengths during the earliest phases prior to maximum light, these wavelength regions undergo severe line-blending compared to the NIR signatures of Mg II. Consequently, Mg II 10927 has served as a better investment for measuring the lower regional extent and conditions during which a DDT is thought to have taken place (e.g., Rudy et al. 2002; Marion et al. 2003, 2006, 2009a; Hsiao et al. 2013, however see our §4.1).
3.4 High Velocity (16,000 km s-1) Features
The spectra of many SN Ia have shown evidence for high-velocity absorption lines of the Ca II NIR triplet (IR3) in addition to an often concurrent signature of high-velocity Si II 6355 (Mazzali et al., 2005a, b). Most recently, high velocity features (HVFs) have also been seen in SN 2009ig (Foley et al., 2012c), SN 2012fr (Childress et al., 2013c), and the SN 2000cx-like SN 2013bh (Silverman et al., 2013c). Overall, HVFs are more common before maximum light, display a rich diversity of behaviors (Childress et al., 2013b), tend to be concurrent with polarization signatures (Leonard et al., 2005; Tanaka et al., 2010), and may be due to an intrinsically clumpy distribution of material (Howell et al., 2001; Kasen et al., 2003; Thomas et al., 2004; Tanaka et al., 2006; Hole et al., 2010).
Maund et al. (2010b) showed that the Si II 6355 line velocity decline rate, v̇, is correlated with the polarization of the same line at day 5, p, and is consistent with an asymmetric distribution of IMEs. This interpretation is also complimentary with a previous finding that v̇ is correlated with vneb, the apparent Doppler line shift of [Fe II] 7155 emitted from the “core” during late times (Maeda et al., 2010b; Silverman et al., 2013a). For the recent SN 2012fr, high velocity features of Ca II IR3 and Si II 6355 at day 11 show concurrent polarization signatures that decline in strength during post-maximum light phases (Maund et al., 2013).
As for the origin of HVFs, they may be the result of abundance and/or density enhancements due to the presence of a circumstellar medium (Gerardy et al., 2004; Quimby et al., 2006b). If abundance enhancements are responsible, it could be explained by an overabundant, outer region of Si and Ca synthesized during a pre-explosion simmering phase (see Piro 2011 and Zingale et al. 2011). On the other hand, the HVFs in LVG SN Ia spectra could indicate the presence of an opaque disk. For example, it is plausible that HVFs are due to magnetically induced merger outflows (Ji et al. 2013, pending abundance calculations of a successful detonation), or interaction with a tidal tail and/or secondary star (e.g., Raskin & Kasen 2013; Moll et al. 2013).
Most recently, Childress et al. (2013b) studied 58 low-z SN Ia (z 0.03) with well-sampled light curves and spectra near maximum light in order to access potential relationships between light curve decline rates and empirical relative strength measurements of Si II and Ca II HVFs. They find a consistent agreement with Maguire et al. (2012) in that the Ca II velocity profiles assume a variety of characteristics for a given m15(B) solely because of the overlapping presence of HVFs. In addition, Childress et al. (2013b) show for their sample that the presence of HVFs is not strongly related to the overall intrinsic (B V)max colors. It is also seen that SN Ia with m15(B) 1.4 continue to be void of conspicuous HVFs, while the strength of HVFs in normal SN Ia is generally larger for objects with broader light curves. Finally, and most importantly, the strength of HVFs at maximum light does not uniquely characterize HVF pre-maximum light behavior.
Notably, Silverman et al. (2013a) find no correlation between nebular velocity and m15(B), and for a given light-curve shape there is a large range of observed nebular velocities. Similarly Blondin et al. (2012) found no relation between the FWHM of late time 4700 Å iron emission features and m15(B). This implies the peak brightness of these events do not translate toward uniquely specifying their late time characteristics, however the data do indicate a correlation between observed (B V)max and this particular measure of line-of-sight nebular velocities.
We should also note that while HVG SN Ia do not clearly come with HVFs in the same sense as for LVG SN Ia, the entire 6100 Å absorption feature for HVG SN Ia spans across velocity intervals for HVFs detected in LVG SN Ia. This makes it difficult to regard LVG and HVG subtypes as two separately distinct explosion scenarios. Instead we can only conclude that HVFs are a natural component of all normal SN Ia, whether conspicuously separate from a photospheric region or concealed as an extended region of absorbing material in the radial direction.
3.5 Empirical Diversity Diagnostics
The depth ratio between 5750 and 6100 Å absorption features, (“Si II”) (Nugent et al., 1995), has been found to correlate with components of the WLR. In addition, Benetti et al. (2005) find a rich diversity of (Si II) pre-maximum evolution among LVG and HVG SN Ia.
As for some observables not directly related to the decline rate parameter, Patat et al. (1996) studied a small sample of well observed SN Ia and found no apparent correlation between the blue-shift of the 6100 Å absorption feature at the time of maximum and m15(B). Similarly, Hatano et al. (2000) showed that (Si II) does not correlate well with v10(Si II), the photospheric velocity derived from the Si II 6355 Doppler line velocities 10 days after maximum light. This could arise from two or more explosion mechanisms, however Hatano et al. (2000) note that their interpretation is “rudimentary” on account of model uncertainties and the limited number of temporal datasets available at that time. In the future, it would be worthwhile to re-access these trends with the latest detailed modeling.
Hachinger et al. (2006) made empirical measurements of spectroscopic feature pEWs, flux ratios, and projected Doppler velocities for 28 well-observed SN Ia, which include LVG, HVG, and FAINT subtypes. For normal LVG SN Ia they find similar observed maximum light velocities (via Si II 6355; 900010,600 km s-1). Meanwhile the HVG SN Ia in their sample revealed a large spread of maximum light velocities ( 10,30012,500 km s-1), regardless of the value of m15(B). This overlap in maximum light velocities implies a natural continuum between LVG and HVG SN Ia (enabling unification through asymmetrical contexts; Maeda et al. 2010b; Maund et al. 2010b). They also note that FAINT SN Ia tend to show slightly smaller velocities at B-band maximum for larger values of m15(B), however no overreaching trend of maximum light expansion velocities from LVG to HVG to FAINT SN Ia was apparent from this particular sample of SN Ia.
Hachinger et al. (2006) did find several flux ratios to correlate with m15(B). In particular, they confirm that the flux ratio, (“S II 5454, 5640”/“Si II 5972”), is a fairly reliable spectroscopic luminosity indicator in addition to (Si II). Hachinger et al. (2006) conclude that these and other flux ratio comparisons are the result of changes in relative abundances across the three main SN Ia subtypes. In a follow-up investigation, Hachinger et al. (2009) argue that the correlation with luminosity is a result of ionization balance, where dimmer objects tend to have a larger value of (Si II). Silverman et al. 2012b later studied correlations between these and other flux ratios of SN Ia from the BSNIP sample and find evidence to suggest that CSM-associated events tend to have larger 6100 Å blue-shifts in addition to broader absorption features at the time of maximum light (see also Arsenijevic 2011; Foley et al. 2012a).
Altavilla et al. (2009) studied the (Si II) ratio and expansion velocities of intermediate-redshift supernovae. They find that the comparison of intermediate-redshift SN Ia spectra with high S/N spectra of nearby SN Ia do not reveal significant differences in the optical features and the expansion velocities derived from the Si II and Ca II lines that are within the range observed for nearby SN Ia. This agreement is also found in the color and decline of the light curve (see also Mohlabeng & Ralston 2013).
While the use of empirically determined single-parameter descriptions of SN Ia have proved to be useful in practice, they do not fully account for the observed diversity of SN Ia (Hatano et al., 2000; Benetti et al., 2004; Pignata et al., 2004). With regard to SN Ia diversity, it should be reemphasized that special care needs to be taken with the implementation of flux ratios and pEWs. Detailed modeling is needed when attempting to draw connections between solitary characteristics of the observed spectrum and the underlying radiative environment, where a photon-ray’s route crosses many radiative contributions that form the spectrum’s various shapes, from UV to IR wavelengths. For example, the relied upon 5750, 6100 Å features used for (Si II) have been shown to be influenced by more than simply Si II, as well as from more locations (and therefore various temperatures) than a single region of line formation (Bongard et al., 2008). In fact, it is likely that a number of effects are at play, e.g., line blending and phase evolution effects. Furthermore, v10(Si II) is a measure of the 6100 Å absorption minimum during a phase of intense line blending with no less than Fe II, which imparts a bewildering array of lines throughout the optical bands (Baron et al., 1995, 1996). Still, parameters such as (Si II) have served as useful tools for SN Ia diversity studies in that they often correlate with luminosity (Bongard et al., 2006) and are relatively accessible empirical measurements for large samples of under-observed SN Ia. A detailed study on the selection of global spectral indicators can be found in Bailey et al. 2009.
3.6 The Adjacent Counterparts of Optical Wavelengths
3.6.1 Ultraviolet Spectra
SN Ia are known as relatively “weak emitters” at UV wavelengths ( 3500 Å; Panagia 2007). It has been shown that UV flux deficits are influenced by line-blanketing effects from IPEs within the outermost layers of ejecta (Sauer et al., 2008; Hachinger et al., 2013; Mazzali et al., 2013), overall higher expansion velocities (Foley & Kasen, 2011; Wang et al., 2012), progenitor metallicity (Höflich et al., 1998; Lentz et al., 2000; Sim et al., 2010b), viewing angle effects (e.g., Blondin et al. 2011), or a combination of these (Moll et al., 2013). Although, it is not certain which of these play the dominant role(s) in controlling UV flux behaviors among all SN Ia.
For SN 1990N and SN 1992A, two extensively studied SN Ia, pre-maximum light UV observations were made and presented by Leibundgut et al. (1991) and Kirshner et al. (1993), respectively. These observations revealed their expected sensitivity to the source temperature and opacity at UV wavelengths.
It was not until recently when a larger UV campaign of high S/N, multi-epoch spectroscopy of distant SN Ia was presented and compared to that of local SN Ia (Ellis et al. 2008, see also Milne et al. 2013). Most notably, Ellis et al. (2008) found a larger intrinsic dispersion of UV properties than could be accounted for by the span of effects seen in the latest models (e.g., metallicity of the progenitor, see Höflich et al. 1998; Lentz et al. 2000).
As a follow-up investigation, Cooke et al. (2011) utilized and presented data from the STIS spectrograph onboard Hubble Space Telescope (HST) with the intent of studying near-UV, near-maximum light spectra (day 0.32 to day 4) of nearby SN Ia. Between a high-z and low-z sample, they find a noticeable difference between the mean UV spectrum of each, suggesting that the cause may be related to different metallicities between the statistical norm of each sample. Said another way, their UV observations suggest a plausible measure of two different populations of progenitors (or constituent scenarios) that could also be dependent on the metallically thereof, including potentially larger dependencies such as variable 56Ni mass and line blanketing due to enhanced burning within the outermost layers (Marion et al., 2013). It should be noted, despite the phase selection criterion invoked by Cooke et al. (2011), it may not be enough to simply designate a phase range in order to avoid phase evolution effects (see Fig. 7 of Childress et al. 2013b).
In order to confirm spectroscopic trends at UV wavelengths, a better method of selection will be necessary as the largest UV difference found by Cooke et al. (2011) and Maguire et al. (2012) between the samples overlaps with the Si II, Ca II H&K absorption features (36003900 Å), i.e. a highly blended feature that is far too often a poorly understood SN Ia variable, both observationally (across subtype and phase) and theoretically, within the context of line formation at UVNIR wavelengths (Mazzali, 2000; Kasen et al., 2003; Thomas et al., 2004; Foley, 2012; Marion et al., 2013; Childress et al., 2013b). While it is true that different radiative processes dominate within different wavelength regions, there are a multitude of explanations for such a difference between the Si IICa II blend near 3700 Å. Furthermore, the STIS UV spectra do not offer a look at either the state of the 6100 Å absorption feature (is it completely photospheric?the answer requires spectrum synthesis even for maximum light phases), nor is it clear if the same is true for Ca II in the NIR where high-velocity components thereof are most easily discernible (Lentz et al., 2000).
It is important to further reemphasize that the time-dependent behavior of the sum total of radiative processes that generate a spectrum from a potentially axially-asymmetric (and as of yet unknown) progenitor system and explosion mechanism are not well understood, much less easily decipherable with an only recently obtained continuous dataset for how the spectrum itself evolves over time at optical wavelengths202020SN 2011fe. See Pereira et al. 2013 and http://snfactory.lbl.gov/snf/data/. Which is only to say, given the current lack of certain predictability between particular observational characteristics of SN Ia (e.g., spectroscopic phase transition times), time series observations at UV wavelengths would offer a beneficial route for the essential purposes of hand-selecting the ‘best’ spectrum comparisons in order to ensure a complete lack of phase evolution effects.
Recently, Wang et al. (2012) presented HST multi-epoch, UV observations of SN 2004dt, 2004ef, 2005M, and 2005cf. Based on comparisons to the results of Lentz et al. (2000) and Sauer et al. (2008), two studies that show a 0.3 magnitude span of UV flux for a change of two orders of magnitude in metallicity within the CO layer of a pure deflagration model (W7; Nomoto et al. 1984), Wang et al. (2012) conclude that the UV excess for a HVG SN Ia, SN 2004dt (A.22), cannot be explained by metallicities or expansion velocities alone. Rather, the inclusion of asymmetry into a standard model picture of SN Ia should be a relevant part of their observed diversity (e.g., Kasen et al. 2009; Blondin et al. 2011).
More recently, Mazzali et al. (2013) obtained 10 HST UVNIR spectra of SN 2011fe, spanning 13.5 to 41 days relative to B-band maximum. They analyzed the data along side spectrum synthesis results from three explosion models, namely a ‘fast deflagration’ (W7), a low-energy delayed-detonation (WS15DD1; Iwamoto et al. 1999), and a third model treated as an intermediary between the outer-layer density profiles of the other two models (“W7+”). From the seen discrepancies between W7 and WS15DD1 during the early pre-maximum phase, in addition to optical flux excess for W7 and a mismatch in observed velocities for WS15DD1, Mazzali et al. (2013) conclude that their modified W7+ model is able to provide a better fit to the data because of the inclusion of a high velocity tail of low density material. In addition, and based on a spectroscopic rise time of 19 days, Mazzali et al. (2013) infer a 1.4 day period of optical quiescence after the explosion (see Piro & Nakar 2013; Chomiuk 2013).
3.6.2 Infrared Light Curves and Spectra
By comparing absolute magnitudes at maximum of two dozen SN Ia, Krisciunas (2005) argue that SN Ia can be best used as standard candles at NIR wavelengths (which was also suggested by Elias et al. 1985a, b), even without correction for optical light curve shape. Wood-Vasey et al. (2008) later confirmed this to be the case from the analysis of 1087 near-IR (JHK) measurements of 21 SN Ia. Based on their data and data from the literature, they derive absolute magnitudes of 41 SN Ia in the H-band with rms scatter of 0.16 magnitudes. Folatelli et al. (2010) find a weak dependence of J-band luminosities on the decline rate from 9 NIR datasets, in addition to VJ corrected J-band magnitudes with a dispersion of 0.12 magnitudes. Mandel et al. (2011) constructed a statistical model for SN Ia light curves across optical and NIR passbands and find that near-IR luminosities enable the most ideal use of SN Ia as standard candles, and are less sensitive to dust extinction as well. Kattner et al. (2012) analyzed the standardizability of SN Ia in the near-IR by investigating the correlation between observed peak near-IR absolute magnitude and post-maximum m15(B). They confirm that there is a bimodal distribution in the near-IR absolute magnitudes of fast-declining SN Ia (Krisciunas et al., 2009) and suggest that applying a correction to SN Ia peak luminosities for decline rate is likely to be beneficial in the J and H bands, making SN Ia more precise distance indicators in the IR than at optical wavelengths (Barone-Nugent et al., 2012).
While optical spectra of SN Ia have received a great deal of attention in the recent past, infrared datasets (e.g., Kirshner et al. 1973b; Meikle et al. 1996; Bowers et al. 1997; Rudy et al. 2002; Höflich et al. 2002) are either not obtained, or are not observed at the same epochs or rate as their optical counterparts. This has only recently begun to change. Thus far, the largest NIR datasets can be found in Marion et al. (2003) and Marion et al. (2009a). Marion et al. (2003) obtained NIR spectra (0.82.5 m) of 12 normal SN Ia, with fairly early coverage. Later, Marion et al. (2009a) presented and studied a catalogue of NIR spectra (0.7 2.5 m) of 41 additional SN Ia. In all, they report an absence of conspicuous signatures of hydrogen and helium in the spectra, and no indications of carbon via C I 10693 (however, see our §4.1). For an extensive review on IR observations, we refer the reader to Phillips (2012).
3.7 Drawing Conclusions about SN Ia Diversity from SN Ia Rates Studies
It has long been perceived that a supernova’s local environment, rate of occurrence, and host galaxy properties (e.g., WD population) serve as powerful tools for uncovering solutions to SN Ia origins (Zwicky, 1961; Hamuy et al., 1995; van den Bergh et al., 2005; Mannucci, 2005; Leaman et al., 2011; Li et al., 2011a, d). After all, a variety of systems, both standard and exotic scenariosall unconfirmedoffer potential for explaining “oddball” SN Ia, as well as more normal events, at various distances (z; redshift) and associations with a particular host galaxy or WD population (Yungelson & Livio, 2000; Parthasarathy et al., 2007; Hicken et al., 2009a; Hachisu et al., 2012; Pakmor et al., 2013; Wang et al., 2013c; Pan et al., 2013; Kim et al., 2014).
Despite this broad extent of the progenitor problem, measurements of the total cosmic SN Ia rate, RSNIa(z), can be made to gauge the general underlying behavior of actively contributing systems (Maoz et al., 2012). Further insight into how various progenitor populations impart their signature onto RSNIa(z) comes about by considering which scenarios lead to a “prompt” (or a “tardy”) stellar demise (Scannapieco & Bildsten, 2005; Mannucci, 2005). Whether or not mergers involve both a (“prompt”) helium-burning or (“tardy”) degenerate secondary star remains to be seen (Woods et al. 2011; Hillebrandt et al. 2013; Dan et al. 2013 and references therein). Because brighter SN Ia prefer younger, metal-poor galaxies, and a linear relation exists between the SN Ia light curve shape and gas-phase metallicity, the principle finding has been that the rate of the universally prompt component is proportional to the star formation rate of the host galaxy, whereas the second delayed component’s rate is proportional to the stellar mass of the galaxy (Sullivan et al., 2006; Howell et al., 2007; Sullivan et al., 2010; Zhang, 2011; Pan et al., 2013). The SN Ia galaxy morphology study of Hicken et al. (2009a) has since progressed this discussion of linking certain observed SN Ia properties with their individual environments. Overall, the trend of brighter/dimmer SN Ia found in younger/older hosts remains, however now with indications that a continuous distribution of select SN Ia subtypes exist in multiple host galaxy morphologies and projected distances within each host.
To understand the full form of RSNIa(z), taking into account the delay time distribution (DTD) for every candidate SN Ia system is necessary (see Bonaparte et al. 2013; Claeys et al. 2014). Maoz et al. (2010) find that the DTD peaks prior to 2.2 Gyr and has a long tail out to 10 Gyr. They conclude that a DTD with a power-law t-1.2 starting at time t = 400 Myr to a Hubble time can satisfy both constraints of observed cluster SN rates and iron-to-stellar mass ratios, implying that that half to a majority of all SN Ia events occur within one Gyr of star formation (see also Strolger et al. 2010; Meng et al. 2011).
In general, the DTD may be the result of binary mergers (Ruiter et al., 2009; Toonen et al., 2012; Nelemans et al., 2013) and/or a single-degenerate scenario (Hachisu et al., 2008, 2012; Chen et al., 2013), but with the consideration that evidence for delay times as short as 100 Myr have been inferred from SN remnants in the Magellanic Clouds (Badenes et al., 2009; Maoz & Badenes, 2010). From a recent comparison of low/high-z SN Ia rate measurements and DTDs of various binary population synthesis models, Graur et al. (2013) argue that single-degenerate systems are ruled out between 1.8 z 2.4. Overall, their results support the existence of a double-degenerate progenitor channel for SN Ia if the the number of double-degenerate systems predicted by binary population synthesis models can be “aptly” increased (Maoz et al., 2010).
However, initial studies have primarily focussed upon deriving the DTD without taking into account the possible effects of stellar metallicity on the SN Ia rate in a given galaxy. Given that lower metallicity stars leave behind higher mass WD stars (Umeda et al., 1999b; Timmes et al., 2003), Kistler et al. (2013) and Meng et al. (2011) argue that the effects of metallicity may serve to significantly alter the SN Ia rate (see also Pan et al. 2013). In fact, models that include the effects of metallicity (e.g., Kistler et al. 2013) find similar consistencies with the observed RSNIa(z). Notably, recent spectroscopic studies do indicate a stronger preference of low-metallicity hosts for super-Chandrasekhar candidate SN Ia (Taubenberger et al., 2011; Childress et al., 2011), which may just as well be explained by low metallicity single-degenerate systems (Hachisu et al., 2012). While there are not enough close binary WD systems in our own galaxy that would result in SCC DD scenarios (Parthasarathy et al., 2007), sub-Chandrasekhar merging binaries may be able to account for discrepancies in the observed rate of SN Ia (Badenes & Maoz, 2012; Kromer et al., 2013b).
Although, we wish to remind the reader that since spectrophotometry of SN Ia so far offer the best visual insight into these distant extragalactic events, and because there is no clear consensus on the origin of their observed spectrophotometric diversity, there is no clear certainty as to what distribution of progenitor scenarios connect with any kind of SN Ia since none have been observed prior to the explosion. Furthermore, whether or not brighter or dimmer SN Ia “tend to” correlate with any property of their hosts does not alleviate the discussion down to one or two progenitor systems (e.g., single- versus double-degenerate systems) since the most often used tool for probing SN Ia diversity over all distance scales, i.e. the “stretch” of a light curve, does not necessarily uniquely determine the spectroscopic subtype. Rather, such correlations reveal the degree of an underlying effect from samples of uncertain and unknown SN Ia subtype biases, i.e. dust extinction in star formation galaxies and progenitor ages also evolve along galaxy mass sequences (Childress et al., 2013a) and the redshift-color evolution of SN Ia remains an open issue (Mohlabeng & Ralston, 2013; Pan et al., 2013; Wang et al., 2013b).
While it is important to consider the full redshift range over which various hierarchies of progenitor and subtype sequences may dominate over others, such studies are rarely able to incorporate spectroscopic diversity as input (a “serendipitous” counter-example being Krughoff et al. 2011). This is relevant given that the landscape of SN Ia spectroscopic diversity has not yet been seen to be void of line-of-sight discrepancies for all progenitor scenarios (particularly so for double degenerate detonations/mergers, e.g., Shen et al. 2013; Pakmor et al. 2013; Raskin & Kasen 2013; Moll et al. 2013; Raskin et al. 2013). Ultimately, robust theories should be able to connect spectroscopic subtypes with individual or dual instances of particular progenitor systems, which requires detailed spectroscopic modeling.
Thus, the consensus as to how many progenitor channels contribute to SN Ia populations is still unclear. Broadly speaking, there are likely to be no less than two to three progenitor scenarios for normal SN Ia so long as single-degenerate systems remain viable (Hachisu et al., 2012), if not restricted to explaining Ia-CSM SN alone (see Han & Podsiadlowski 2006; Silverman et al. 2013d; Leloudas et al. 2013). Given also a low observed frequency of massive white dwarfs and massive double-degenerate binaries near the critical mass limit with orbital periods short enough to merge within a Hubble time, some normal SN Ia are still perceived as originating from single-degenerate systems (Parthasarathy et al., 2007). Meanwhile, some portion of events may also be the result of a core-degenerate merger (Soker et al., 2013), while some merger phenomena are possibly accelerated within triple systems (Thompson, 2011; Kushnir et al., 2013; Dong et al., 2014). It likewise remains unclear whether or not some double-degenerate mergers predominately result in the production of a neutron star instead of a SN Ia (Saio & Nomoto, 1985; Nomoto & Kondo, 1991; Piersanti et al., 2003; Saio & Nomoto, 2004; Dan et al., 2013; Tauris et al., 2013). At present, separately distinct origins for spectroscopically similar SN Ia cannot be ruled out by even one discovery of a progenitor system; the spectroscopic diversity is currently too great and too poorly understood to confirm without greater unanimity among explosion models and uniformity in data collection efforts.
4 Some Recent SN Ia
During the past decade, several normal, interesting, and peculiar SN Ia have been discovered. For example, the recent SN 2009ig, 2011fe, and 2012fr are nearby SN Ia that were discovered extremely young with respect to the onset of the explosion (Nugent et al., 2011; Foley et al., 2012c; Childress et al., 2013c) and have been extensively studied at all wavelengths, yielding a clearer understanding of the time-dependent behavior of SN spectroscopic observations, in addition to a better context by which to compare. Below we briefly summarize some of the highlighted discoveries during the most recent decade, during which it has revealed a greater diversity of SN Ia than was previously known. In the appendix we provide a guide to the recent literature of other noteworthy SN Ia discoveries. We emphasize that these sections are not meant to replace reading the original publications, and are only summarized here as a navigation tool for the reader to investigate further.
4.1 SN 2011fe in M101
Thus far, the closest spectroscopically normal SN Ia in the past 25 years, SN 2011fe (PTF11kly), has provided a great amount of advances, including testing SN Ia distance measurement methods (Matheson et al., 2012; Vinkó et al., 2012; Lee & Jang, 2012). For example, the early spectroscopy of SN 2011fe showed a clear and certain time-evolving signature of high-velocity oxygen that varied on time scales of hours, indicating sizable overlap between CO, Si, and Ca-rich material and newly synthesized IMEs within the outermost layers (Nugent et al., 2011).
Parrent et al. (2012) carried out analysis of 18 spectra of SN 2011fe during its first month. Consequently, they were able to follow the evolution of C II 6580 absorption features from near the onset of the explosion until they diminished after maximum light, providing strong evidence for overlapping regions of burned and unburned material between ejection velocities of at least 10,000 and 16,000 km s-1. At the same time, the evolution of a 7400 Å absorption feature experienced a declining Doppler-shift until 5 days post-maximum light, with O I 7774 line velocities ranging 11,500 to 21,000 km s-1 (Nugent et al., 2011). Parrent et al. (2012) concluded that incomplete burning (in addition to progenitor scenarios) is a relevant source of spectroscopic diversity among SN Ia (Tanaka et al., 2008; Maeda et al., 2010a).
Pereira et al. (2013) presented high quality spectrophotometric observations of SN 2011fe, which span from day 15 to day 97, and discussed comparisons to other observations made by Brown et al. (2012), Richmond & Smith (2012), Vinkó et al. (2012), and Munari et al. (2013). From an observed peak bolometric luminosity of 1.17 0.04 x 1043 erg s-1, they estimate SN 2011fe to have produced between 0.44 0.08 0.53 0.11 M⊙ of 56Ni.
By contrast, Pastorello et al. (2007a) and Wang et al. (2009b) estimate 56Ni production for the normal SN 2005cf (A.26) to be 0.7 M⊙. It is also interesting to note that SN 2011fe and the fast-declining SN 2004eo produced similar amount of radioactive nickel, however lower for SN 2004eo ( 0.4 M⊙; Mazzali et al. 2008). Pereira et al. (2013) also made comparisons between SN 2011fe, a SNFactory normal SN Ia (SNF20080514-002) and the broad-lined HV-CN SN 2009ig (Foley et al., 2012c). Pereira et al. (2013) note similarities (sans the UV) and notable contrast with respect to high-velocity features, respectively.
Pereira et al. (2013) calculated v̇ for SN 2011fe to be 60 ( 3) km s-1 day-1, near the high end of low-velocity gradient SN Ia events (see Benetti et al. 2005; Blondin et al. 2012). Given their high S/N, time series dataset, Pereira et al. (2013) were also able to place tighter constraints on the velocities over which C II 6580 is observed to be present in SN 2011fe. They conclude that C II is present down to at least as low as 8000 km s-1, which is 2000 km s-1 lower than that estimated by Parrent et al. (2012), and is also 40006000 km s-1 (or more) lower than what is predicted by some past and presently favored SN Ia abundance models (e.g., W7; Nomoto et al. 1984, and the delayed detonations of Höflich 2006 and Röpke et al. 2012).
Hsiao et al. (2013) presented and discussed NIR time series spectra of SN 2011fe that span between day 15 and day 17. In particular, they report a detection of C I 10693 on the blue-most side of a blended Mg II 10927 absorption feature at roughly the same velocities and epochs as C II 6580 found by Parrent et al. (2011) and Pereira et al. (2013), which itself is blended on its blue-most side with Si II 6355. While searches and studies of C I 10693 are extremely useful for understanding the significance of C-rich material from normal to cooler sub-luminous SN Ia within the greater context of all C I, C II, C III, O I absorption features (C III for “hotter” SN 1991T-likes), blended C I 10693 absorption shoulders are certainly no more (nor no less) useful for probing lower velocity boundaries than C II 6580 absorption notches. This is especially true given that C I 10693 absorption features are blended from the red-most side (lower velocities) by the neighboring Mg II line, which will only serve to obscure the lower velocity information of the C I profile for the non-extreme cases (e.g., SN 1999by, Höflich et al. 2002).
Hsiao et al. (2013) used the observed temporal behavior, and later velocity-plateau, of Mg II 10927 to estimate a lower extent of 11,200 km s-1 for carbon-burning products within SN 2011fe. Given that this in contrast to the refined lower extent of C II at 8000 km s-1 by Pereira et al. (2013), this could imply (i.e. assuming negligible temperature differences and/or non-LTE effects) that either some unburned material has been churned below the boundary of carbon-burning products via turbulent instabilities (Gamezo et al., 1999, 1999, 2004) and/or the distribution of emitting and absorbing carbon-rich material is truly globally lopsided (Kasen et al., 2009; Maeda et al., 2010b; Blondin et al., 2011), and may indicate the remains of a degenerate secondary star (Moll et al., 2013).
Detailed studies of this nearby, normal, and unreddenned SN 2011fe have given strong support for double-degenerate scenarios (assuming low environmental abundances of hydrogen) and have placed strong constraint on single-degenerate scenarios, i.e. MS and RG companion stars have been strongly constrained for SN 2011fe (see Shappee et al. 2013 and references therein, and also Hayden et al. 2010a; Bianco et al. 2011). Nugent et al. (2011), Li et al. (2011b) and Bloom et al. (2012) confirm that the primary star was a compact star (R∗ 0.1 R⊙, c.f., Bloom et al. 2012; Piro & Nakar 2013; Chomiuk 2013). From the lack of evidence for an early shock outbreak (Kasen, 2010; Nakar & Sari, 2012), non-detections of radio and X-ray emissions (Horesh et al., 2012; Chomiuk et al., 2012; Margutti et al., 2012), non-detections of narrow Ca II H&K or Na D lines or pre-existing dust that could be associated with the event (Patat et al., 2013; Johansson et al., 2013), and low upper-limits on hydrogen-rich gas (Lundqvist et al., 2013), the paucity of evidence for an environment dusted in CSM from a non-degenerate secondary strongly supports the double degenerate scenario for SN 2011fe. Plus, this inferred ambient environment is consistent with that of recent merger simulations (Dan et al., 2012), and could signal an avenue of interpretation for signatures of carbon-rich material as well (Branch et al., 2005; Dan et al., 2013; Moll et al., 2013). Specifically, the remaining amount of carbon-rich material predicted by some explosion models may already be accounted for, and more so than would be required by the existence of low velocity detections of C I and C II. If this turns out to be the case, spectroscopic signatures of both C and O could tap into understanding (i) the sizes of merger CO common envelopes, (ii) potential downward mixing effects between the envelope and the underlying ejecta, and/or (iii) test theories on possible asymmetries of CO material within the post-explosion ejecta of the primary and secondary stars (Livio & Pringle, 2011), which is expected to depend on the degree of coalescence (Moll et al., 2013; Raskin & Kasen, 2013).
Of course, this all rests on the assumptions that (i) the surrounding environment of a single degenerate scenario just prior to the explosion ought to be contaminated with some amount of CSM, above which it would be detected (Justham, 2011; Brown et al., 2012), and (ii) the surrounding environment of a merger remains relatively “clean” (Shen et al., 2013; Raskin & Kasen, 2013). In this instance, and assuming similarly above that current DDT-like models roughly fit the outcome of the explosion, absorption signatures of C ( HV O I) may point to super-massive single-degenerate progenitors with variable enclosed envelopes and/or disks of material (e.g., Yoon & Langer 2004, 2005; Hachisu et al. 2012; Scalzo et al. 2012; Tornambé & Piersanti 2013; Dan et al. 2013) or sub-Chandrasekhar mass “peri-mergers” for resolve (see Moll et al. 2013 and references therein).
4.2 Other Early Discoveries
4.2.1 SN 2009ig in NGC 1015
Foley et al. (2012c) obtained well-sampled, early UV and optical spectra of SN 2009ig as it was discovered 17 hr after the event (Kleiser et al., 2009; Navasardyan et al., 2009). SN 2009ig is found to be a normal SN Ia, rising to B-band maximum in 17.3 days. From the earliest spectra, Foley et al. (2012c) find Si II 6355 line velocities around 23,000 km s-1, which is exceptionally high for such a spectroscopically normal SN Ia (see also Blondin et al. 2012). SN 2009ig possess either an overall shallower density profile than other CN SN Ia, or a buildup of IMEs is present at high velocities.
Marion et al. (2013) recently analyzed the photospheric to post-maximum light phase spectra of SN 2009ig, arguing for the presence of additional high-velocity absorption signatures from not only Si II, Ca II, but also Si III, S II and Fe II. Whether or not two separate but compositionally equal regions of line formation is a ubiquitous property of similar SN Ia remains to be seen. However, it should not be unlikely for primordial amounts of said atomic species to be present (in addition to singly-ionized silicon and calcium) on account of possible density and/or abundance enhancements within the outermost layers (Thomas et al., 2004; Mazzali et al., 2005b, a). For example, simmering effects during convective phases prior to the explosion may be responsible for dredging up IMEs later seen as HVFs, which would give favorability to single-degenerate progenitor scenarios (see Piro 2011; Zingale et al. 2011). Similarly, it is worthwhile to access the versatility of mergers in producing high-velocity features.
4.2.2 SN 2012fr in NGC 1365
Childress et al. (2013c) report on their time series spectroscopic observations of SN 2012fr (Klotz et al., 2012; Childress et al., 2012; Buil, 2012), complete with 65 spectra that cover between 15 days before and 40 days after it reached a peak B-band brightness of 19.3. In addition to the simultaneous spectropolarimetric observations of Maund et al. (2013), the early to maximum light phase spectra of SN 2012fr reveal one of the clearest indications that SN Ia of similar type (e.g., SN 1994D, 2001el, 2009ig, 2011fe, and many others; Mazzali05a) tend to have two distinctly separate regions of Si-, Ca-based material that differ by a range of separation velocities (Childress et al., 2013b).
Childress et al. (2013c) and Maund et al. (2013) discussed the various interpretations that have been presented in the past, however no firm conclusions on the origin of HVFs could be realized given the uncertainties of current explosion models. Despite this, the most recent advance toward understanding HVFs is the continual detection of polarization signatures due to the high-velocity Si II and Ca II absorption features, indicating a departure from a radially stratified, spherically symmetric geometry at some layer near or above the “photospheric region” of IMEs.
4.3 Super-Chandrasekhar Candidate SN Ia
4.3.1 Over-luminous SN 2003fg (SNLS-03D3bb)
SN 2003fg was discovered as part of the Supernova Legacy Survey (SNLS); z = 0.2440 (Howell et al., 2006). Its peak absolute magnitude was estimated to be 19.94 in V-band, placing SN 2003fg completely outside the M-distribution of normal low-z SN Ia (2.2 times brighter). Assuming Arnett’s rule, such a high luminosity corresponds to 1.3 M⊙ of 56Ni, which would be in conflict with SN 2003fg’s spectra since only 60% of a Chandrasekhar pure detonation ends up as radioactive nickel (Steinmetz et al. 1992, however see also Pfannes et al. 2010). Given also the lower mean expansion velocities, this builds upon the picture of a super-Chandrasekhar mass progenitor for SN 2003fg and others like it (Howell et al., 2006; Jeffery et al., 2006).
Yoon & Langer (2005) proposed the formation of super-Chandrasekhar mass WD stars as a result of rapid rotation. Pfannes et al. (2010) later reworked these models and found that the “prompt” detonation of a super-Chandrasekhar mass WD produces enough nickel, as well as a remainder of IMEs in the outer layers (in contrast to Steinmetz et al. 1992), to explain over-luminous SN Ia.
Hachisu et al. (2012) added to this model by taking into account processes of binary evolution. Namely, with the inclusion of mass-striping, optically thick winds of a differentially rotating primary star, Hachisu et al. (2012) find three critical mass ranges that are each separated according to the spin-down time of the accreting WD. All three of these single-degenerate scenarios may explain a majority of events from sub-luminous to over-luminous SN Ia. So far no super-Chandrasekhar mass WD stars that would result in a SN Ia have been found in the sample of known WD stars in our Galaxy (Saffer et al. 1998, see also Kilic et al. 2012). However, this does not so much rule out super-Chandrasekhar mass models as it suggests that these systems are rare in the immediate vicinity within our own galaxy.
Hillebrandt et al. (2007) proposed an alternative scenario involving only a Chandrasekhar-mass WD progenitor to explain the SN 2003fg event. They demonstrated that an off-center explosion of a Chandrasekhar-mass WD could explain the super-bright SN Ia. However, in this off-center explosion model it is not easy to account for the high Ni mass in the outer layers, in addition to the special viewing direction.
4.3.2 Over-luminous SN 2009dc in UGC 10064
Yamanaka et al. (2009a) presented early phase optical and NIR observations for SN 2009dc (Puckett et al., 2009; Harutyunyan et al., 2009; Marion et al., 2009b; Nicolas & Prosperi, 2009). From the peak V-band absolute magnitude they conclude that SN 2009dc belongs to the most luminous class of SN Ia (m15(B) = 0.65), and estimate the 56Ni mass to be 1.2 to 1.6 M⊙. Based on the JHK photometry Yamanaka et al. (2009a) also find SN 2009dc had an unusually high NIR luminosity with enhanced fading after day 200 (Maeda et al., 2009; Silverman et al., 2011; Taubenberger et al., 2011). The spectra of SN 2009dc also show strong, long lasting 6300 Å absorption features (until two weeks post-maximum light) Based on the observed spectropolarimetric indicators, in combination with photometric and spectroscopic properties, Tanaka et al. (2010) similarly conclude that the progenitor mass of SN 2009dc was of super-Chandrasekhar origin and that the explosion geometry was globally spherically symmetric, with a clumpy distribution of IMEs.
Silverman et al. (2011) presented an analysis of 14 months of observations of SN 2009dc and estimate a rise-time of 23 days and m15(B) = 0.72. They find a lower limit of the peak bolometric luminosity 2.4 x 1043 erg s-1 and caution that the actual value is likely almost 40% larger. Based on the high luminosity and low mean expansion velocities of SN 2009dc, Silverman et al. (2011) derive a mass of more than 2M⊙ for the white dwarf progenitor and a 56Ni mass of 1.4 to 1.7 M⊙. Taubenberger et al. (2011) find the minimum 56Ni mass to be 1.8 M⊙, assuming the smallest possible rise-time of 22 days, and the ejecta mass to be 2.8 M⊙.
Taubenberger et al. (2013) compared photometric and spectroscopic observations of normal and SCC SN Ia at late epochs, including SN 2009dc, and find a large diversity of properties spanning through normal, SS, and SCC SN Ia. In particular the decline in the light curve “radioactive tail” for SCC SN Ia is larger than normal, along with weaker than normal [Fe III] emission in the nebular phase spectra. Taubenberger et al. (2013) argue that the weak [Fe III] emission is indicative of an ejecta environment with higher than normal densities. Previously, Hachinger et al. (2012) carried out spectroscopic modeling for SN 2009dc and discussed the model alternatives, such as a 2 M⊙ rotating WD, a core-collapse SN, and a CSM interaction scenario. Overall, Hachinger et al. (2012) found the interaction scenario to be the most promising in that it does not require the progenitor to be super-massive. Taubenberger et al. (2013) furthered this discussion in conjunction with their late time comparisons and conclude that the models of Hachinger et al. (2012) do not simultaneously match the peak brightness and decline of SN 2009dc (see also Yamanaka et al. 2013). Following the interaction scenario of Hachinger et al. (2012), Taubenberger et al. (2013) propose a non-violent merger model that produces 1M⊙ of 56Ni and is enshrouded by 0.60.7M⊙ of CO-rich material. In order to reconcile the low 56Ni production, Taubenberger et al. (2013) note that additional luminosity from interaction with CSM is required during the first two months post-explosion. Further support for CSM interaction comes from the observed suppression of the double peak in the I-band, which is thought to arise from a breaking of ejecta stratification in the outermost layers (Kasen, 2006; Kamiya et al., 2012).
It is not yet clear if SN 2003fg, 2006gz (A.32), 2007if (A.34), and SN 2009dc are the result of a single super-Chandrasekhar mass WD star, given that even in our galaxy there is no observational evidence for the existence of such a system. Likewise, there is no direct observational evidence for the presence of very rapidly rotating massive WD stars, either single WDs or in binary systems as well. In fact, no double-degenerate close binary systems with a total mass amounting to super-Chandrasekhar mass configurations that can merge in Hubble-time have been found (Parthasarathy et al., 2007). Therefore, our current understanding of the origin of over-luminous SN Ia is limited, and more observations are needed. For example, progress has been made with the recent discovery of 24 merging WD systems via the extremely low mass Survey (see Kilic et al. 2012 and references therein), however it is unclear if any are systems that would produce a normal SN Ia.
4.4 The Peculiar SN 2002cx-like Class of SN
4.4.1 SN 2002cx in CGCG-044-035
Li et al. (2003) considered SN 2002cx as “the most peculiar known SN Ia” (Wood-Vasey et al., 2002b). They obtained photometric and spectroscopic observations which revealed it to be unique among all observed SN Ia. Li et al. (2003) described SN 2002cx as having SN 1991T-like pre-maximum spectrum, a SN 1991bg-like luminosity, and expansion velocities roughly half those of normal SN Ia.
Photometrically, SN 2002cx has a broad peak in the R-band, a plateau phase in the I-band, and a slow late time decline. The B V color evolution are described as nearly normal, while the V R and V I colors are redder than normal. Spectra of SN 2002cx during early phases evolve rapidly and are dominated by lines from IMEs and IPEs, but the features are weak overall. In addition, emission lines are present around 7000 Å during post-maximum light phases, while the late time nebular spectrum shows narrow lines of iron and cobalt.
Jha et al. (2006a) presented late time spectroscopy of SN 2002cx, which includes spectra at 227 and 277 days post-maximum light. They considered it as a prototype of a new subclass of SN Ia. The spectra do not appear to be dominated by the forbidden emission lines of iron, which is not expected during the “nebular phase,” where instead they find a number of P Cygni profiles of Fe II at exceptionally low expansion velocities of 700 km s-1 (Branch et al., 2004a). A tentative identification of O I 7774 is also reported for SN 2002cx, suggesting the presence of oxygen-rich material. Currently, it is difficult to explain all the observed photometric and spectroscopic properties of SN 2002cx using the standard SN Ia models (see Foley et al. 2013). However, the spectral characteristics of SN 2002cx support pure deflagration or failed-detonation models that leave behind a bound remnant instead of delayed detonations (Jordan et al., 2012; Kromer et al., 2013a; Hillebrandt et al., 2013).
4.4.2 SN 2005hk in UGC 00272
Phillips et al. (2007) presented extensive multi-color photometry and optical spectroscopy of SN 2005hk (Quimby et al., 2005). Sahu et al. (2008) also studied the spectrophotometric evolution SN 2005hk, covering pre-maximum phase to around 400 days after the event. These datasets reveal that SN 2005hk is nearly identical in its observed properties to SN 2002cx. Both supernovae exhibited high ionization SN 1991T-like pre-maximum light spectra but with low peak luminosities like that of SN 1991bg. The spectra reveal that SN 2005hk, like SN 2002cx, has expansion velocities that are roughly half those of typical SN Ia.
The R and I-band light curves of both supernovae are also peculiar for not displaying the secondary maximum observed for normal SN Ia. Phillips et al. (2007) constructed a bolometric light curve from 15 days before to 60 days after B-band maximum. They conclude that the shape and exceptionally low peak luminosity of the bolometric light curve, low expansion velocities, and absence of a secondary maximum in the NIR light curves are in reasonable agreement with model calculations of a three-dimensional deflagration that produces 0.25 M⊙ of 56Ni. Note however that the low amount of continuum polarization observed for SN 2005hk ( 0.2%0.4%) is far too similar to that of more normal SN Ia to serve as an explanation for the spectroscopic peculiarity of SN 2005hk, and possibly other SN 2002cx-like events (Chornock et al., 2006; Maund et al., 2010a).
4.4.3 Sub-luminous SN 2007qd
McClelland et al. (2010) obtained multi-band photometry and multi-epoch spectroscopy of SN 2007qd (Bassett et al., 2007). Its observed properties place it broadly between those of the peculiar SN 2002cx and SN 2008ha (A.37). Optical photometry indicate a fast rise-time and a peak absolute B-band magnitude of 15.4. McClelland et al. (2010) carried out spectroscopy of SN 2007qd near maximum brightness and detect signatures of IMEs. They find the photospheric velocity to be 2800 km s-1 near maximum light, and note that this is 4000 and 7000 km s-1 less than that inferred for SN 2002cx and normal SN Ia, respectively. McClelland et al. (2010) find that the peak luminosities of SN 2002cx-like objects are well correlated with their light curve stretch and photospheric velocities.
4.4.4 SN 2009ku
SN 2009ku was discovered by Pan-STARS-1 as a SN Ia belonging to the peculiar SN 2002cx class. Narayan et al. (2011) studied SN 2009ku and find that while its multi-band light curves are similar to that of SN 2002cx, they are slightly broader and have a later rise to g-band maximum. Its peak brightness was found to be M = 18.4 and the ejecta velocity at 18 days after maximum brightness was found to be 2000 km s-1. Spectroscopically, SN 2009ku is similar to SN 2008ha (A.37). Narayan et al. (2011) note that the high luminosity and low ejecta velocity for SN 2009ku is not in agreement with the trend seen for SN 2002cx class of SN Ia. The spectroscopic and photometric characteristics of SN 2009ku indicate that the SN 2002cx class of SN Ia are not homogeneous, and that the SN 2002cx class of events may have a significant dispersion in their progenitor population and/or explosion physics (see also Kasliwal et al. 2012 for differences between this class and sub-luminous “calcium-rich” transients).
4.5 PTF11kx and the “Ia-CSM” Class of SN Ia
4.5.1 PTF11kx: A case for single-degenerate scenarios?
Dilday et al. (2012) studied the photometric and spectroscopic properties of another unique SN Ia event, PTF11kx. Using time series, high-resolution optical spectra, they find direct evidence supporting a single-degenerate progenitor system based on several narrow, temporal ( 65 km s-1) spectroscopic features of the hydrogen Balmer series, He I, Na I, Ti II, and Fe II. In addition, and for the first time, PTF11kx observations reveal strong, narrow, highly time-dependent Ca II absorption features that change from saturated absorption signatures to emission lines within 40 days.
Dilday et al. (2012) considered the details of these observations and concluded that the complex CSM environment that enshrouds PTF11kx is strongly indicative of mass loss or “outflows,” prior to the onset of the explosion of the progenitor system. Other SN Ia have exhibited narrow, temporal Na D lines before (e.g., SN 2006X, 2007le; see Simon et al. 2009; Patat et al. 2009, 2010, 2011; Sternberg et al. 2011), but none have been reported as having signatures of these particular ions, which are clearly present in the high-resolution spectra of PTF11kx. On the whole, and during the earliest epochs, Dilday et al. (2012) find that the underlying SN Ia spectroscopic component of PTF11kx most closely resembles that of SN 1991T (Filippenko et al., 1992a; Gómez & López, 1998) and 1999aa (Garavini et al., 2004).
As for the late time phases, Silverman et al. (2013b) studied spectroscopic observations of PTF11kx from 124 to 680 days post-maximum light and find that its nebular phase spectra are markedly different from those of normal SN Ia. Specifically, the late time spectra of PTF11kx are void of the strong cobalt and iron emission features typically seen in other SN 1991T/1999aa-like and normal SN Ia events (e.g., Ruiz-Lapuente & Lucy 1992; Salvo et al. 2001; Branch et al. 2003; Stehle et al. 2005; Kotak et al. 2005; McClelland et al. 2013; Silverman et al. 2013a). For the most part, the late time spectra of PTF11kx are seen to be dominated by broad (FWHM 2000 km s-1) H emission and strong Ca II emission features that are superimposed onto a relatively blue, overly luminous continuum level that may be serving to wash out the underlying SN Ia spectroscopic information. Silverman et al. (2013b) note that the H emission increases in strength for 1 yr before decreasing. In addition, from the absence of strong H, He I, and O I emission, as well as a larger than normal late time luminosity, Silverman et al. (2013b) conclude that PTF11kx indeed interacted with some form of CSM material; possibly of multiply thin shells, shocked into radiative modes of collisional excitation as the SN ejecta overtakes the slower-moving CSM. However, it should be noted that it is not yet clear if the CSM originates from a single-degenerate scenario or a H-rich layer of material that is ejected prior to a double-degenerate merger event (Shen et al. 2013, see also Soker et al. 2013).
4.5.2 SN 2002ic
Hamuy et al. (2003) detected a large H emission in the spectra of SN 2002ic (Wood-Vasey et al., 2002a). Seven days before to 48 days after maximum light, the optical spectra of SN 2002ic exhibit normal SN Ia spectral features in addition to the strong H emission. The H emission line in the spectrum of SN 2002ic consists of a narrow component atop a broad component (FWHM of about 1800 km s-1). Hamuy et al. (2003) argue that the broad component arose from ejectaCSM interaction. By day 48, they find that the spectrum is similar to that of SN 1990N. Hamuy et al. (2003) argue that the progenitor system contained a massive AGB star, associated with a few solar masses of hydrogen-rich CSM.
Kotak et al. (2004) obtained the first high resolution, high S/N spectrum of SN 2002ic. The resolved H line has a P Cygni-type profile, indicating the presence of a dense, slow-moving outflow (about 100 km s-1). They also find a relatively large and unusual NIR excess and argue that this is the result of an infrared light-echo originating from the presence of CSM. They estimate the mass of CSM to be more than 0.3 M⊙, produced by a progenitor mass loss rate greater than 10-4 M⊙ yr-1. For the progenitor, Kotak et al. (2004) favor a single-degenerate system with a post-AGB companion star.
Wood-Vasey et al. (2004) obtained pre-maximum and late time photometry of SN 2002ic and find that a non-SN Ia component of the light curve becomes pronounced about 20 days post-explosion. They suggest the non-SN Ia component to be due to heating from a shock interaction between SN ejecta and CSM. Wood-Vasey et al. (2004) also suggest that the progenitor system consisted of a WD and an AGB star in the protoplanetary nebula phase. Wood-Vasey et al. (2004) and Sokoloski et al. (2006) proposed that a nova shell ejected from a recurrent nova progenitor system, creating the evacuated region around the explosion center of SN 2002ic. They suggest that the periodic shell ejections due to nova explosions on a WD sweep up the slow wind from the binary companion, creating density variations and instabilities that lead to structure in the circumstellar medium. This type of phenomenon may occur in SN Ia with recurrent nova progenitors, however Schaefer (2011) recently reported on an ongoing observational campaign of recurrent novae (RN) orbital period changes between eruptions. For at least two objects (CI Aquilae and U Scorpii), he finds that the RN lose mass, thus making RN unlikely progenitors for SN Ia.
Nearly one year after the explosion, Wang et al. (2004) found that the supernova had become fainter overall, but H emission had brightened and broadened compared to earlier observations. From their spectropolarimetry observations, Wang et al. (2004) find that hydrogen-rich matter is asymmetrically distributed. Likewise, Deng et al. (2004) also found evidence of a hydrogen-rich asymmetric circumstellar medium. From their observations of SN 2002ic, Wang et al. (2004) conclude that the event took place within a “dense, clumpy, disk-like” circumstellar medium. They suggest that the star responsible for SN 2002ic could either be a post-AGB star or WD companion (see also Hachisu et al. 1999; Han & Podsiadlowski 2006).
4.5.3 SN 2005gj
Similar to SN 2002ic, Aldering et al. (2006) argue that SN 2005gj is a SN Ia in a massive circumstellar envelope (see also Prieto et al. 2007), which is located in a low metallicity host galaxy with a significant amount of star formation. Their first spectrum of SN 2005gj shows a blue continuum level with broad and narrow H emission. Subsequent spectra reveal muted SN Ia features combined with broad and narrow H, H, H and He I 5876, 7065 in emission, where high resolution spectra reveal narrow P Cygni profiles. An inverted P Cygni profile for [O III] 5007 was also detected, indicating top-lighting effects from CSM interaction (Branch et al., 2000). From their early photometry of SN 2005gj, Aldering et al. (2006) find that the interaction between the supernova ejecta and CSM was much weaker for SN 2002ic. Notably, both Aldering et al. (2006) and Prieto et al. (2007) agree that a SN 1991T-like spectrum can account for many of the observed profiles with an assumed increase in continuum radiation from interaction with the hydrogen-rich material.
Aldering et al. (2006) also find that the light curve and measured velocity of the unshocked CSM imply mass loss as recent as 1998. This is in contrast to SN 2002ic, for which an inner cavity in the circumstellar matter was inferred (Wood-Vasey et al., 2004). Furthermore, SN 1997cy, SN 2002ic, and SN 2005gj all exhibit large CSM interactions and are from low-luminosity hosts.
Consistent with this interpretation for CSM interactions is the recent report by Fox & Filippenko (2013) that a NIR re-brightening, possibly due to emission from “warm” dust, took place at late times for both SN 2002ic and 2005gj. Notably, and in contrast to SN 2002ic, Fox & Filippenko (2013) find that the mid-IR luminosity of SN 2005gj increased to twice its early epoch brightness.
5 Summary and Concluding Remarks
Observations of a significant number of SN Ia during the last two decades have enabled us to document a larger expanse of their physical properties which is manifested through spectrophotometric diversity. While in general SN Ia have long been considered a homogeneous class, they do exhibit up to 3.5 mag variations in the peak luminosity, whereas “normal” SN Ia dispersions are 1 mag, and constitute several marginally distinct subtypes (Blondin et al., 2012; Scalzo et al., 2012; Silverman et al., 2013d; Foley et al., 2013; Dessart et al., 2013a). Consequently, the use of normal SN Ia for cosmological purposes depends on empirical calibration methods (e.g., Bailey et al. 2009), where one of the most physically relevant methods is the use of the width-luminosity relation (Phillips, 1993; Phillips et al., 1999).
Understanding the physics and origin of the width-luminosity-relationship of SN Ia light curves is an important aspect in the modeling of SN Ia (Khokhlov et al., 1993; Lentz et al., 2000; Timmes et al., 2003; Nomoto et al., 2003; Kasen & Woosley, 2007; Kasen et al., 2009; Meng et al., 2011; Blondin et al., 2011). Brighter SN Ia often have broad light curves that decline slowly after peak brightness. Slightly less bright or dimmer SN Ia have narrower and relatively rapidly declining light curves. In addition, several SN Ia do not follow the width-luminosity-relationship (e.g., SN 2001ay, 2004dt, 2010jn, SCC, CL and SN 2002cx-like SN Ia), which reinforces the notion that a significant number of physically relevant factors influence the diversity of SN Ia overall (see Wang et al. 2012; Baron et al. 2012).
Despite the ever increasing number of caught-early supernovae, our perspective on their general properties and individual peculiarities undergoes a continual convergence toward a set of predictive standards with which models must be seen to comply. The most recent observational example is that of SN 2012fr (Maund et al., 2013; Childress et al., 2013c), a normal/low-velocity-gradient SN Ia that has been added to the growing list of similar SN Ia that exhibit stark evidence for a distinctly separate region of “high-velocity” material (16,000 km s-1). While the origin of high velocity features in the spectra of SN Ia is not well understood, it is concurrent with polarization signatures in most cases which implies some amount of ejecta density asymmetries (e.g., Kasen et al. 2003; Wang & Wheeler 2008; Smith et al. 2011; Maund et al. 2013). Furthermore, since understanding the temporal behavior of high velocity Si II/Ca II depends on knowing the same for the photospheric component, studies that focus on velocity gradients and potential velocity-plateaus of the photospheric component could make clearer the significance of the physical separation between these two regions of material (see Patat et al. 1996; Kasen et al. 2003; Tanaka et al. 2008; Foley et al. 2012c; Parrent et al. 2012; Scalzo et al. 2012; Childress et al. 2013c; Marion et al. 2013). However, it is at least certain that all viable models that encompass “normal” SN Ia conditions must account for the range of properties related to velocity evolution (see Blondin et al. 2012 and references therein), the occasionally observed however potentially under-detected signatures of CO material at both low and high velocities (Thomas et al., 2007; Parrent et al., 2011; Thomas et al., 2011b; Folatelli et al., 2012; Silverman & Filippenko, 2012; Piro & Nakar, 2013; Mazzali et al., 2013), a high-velocity region of either clumps or an amorphous plumage of opaque Si-, Ca-based material (Gamezo et al., 2004; Leonard et al., 2005; Wang et al., 2007; Maund et al., 2010b; Piro, 2011), and the supposed blue/red-shift of nebular lines emitted from the inner IPE-rich material (Maeda et al., 2010b; McClelland et al., 2013; Silverman et al., 2013a).
For at least normal SN Ia, there remain two viable explosion channels (with a few sub- and super-MCh sub-channels) regardless of the hierarchical dominance of each at various redshifts and/or ages of galactic constituents (c.f., Röpke et al. 2012; Hachisu et al. 2012; Seitenzahl et al. 2013; Pakmor et al. 2013; Moll et al. 2013; Claeys et al. 2014). Also, it may or may not be the case that some SN Ia are 2 subtypes viewed upon from various lines of sight amidst variable CSM interaction (Maeda et al., 2010b; Foley et al., 2012a; Scalzo et al., 2012; Leloudas et al., 2013; Dan et al., 2013; Moll et al., 2013; Dessart et al., 2013a). However, with the current lack of complete observational coverage in wavelength, time, and mode (i.e. spectrophotometric and spectropolarimetric observations) for all SN Ia subtypes and “well-observed” events, there is a limit for how much constraint can be placed on many of the proposed explosion models and progenitor scenarios. That is, despite observational indications for and theoretical consistencies with the supposition of multiple progenitor channels, the observed diversity of SN Ia does not yet necessitate that each spectrophotometric subtype be from a distinctly separate explosive binary scenario than that of others within the SN Ia family of observed events; particularly so for normal SN Ia.
For the purposes of testing the multifaceted predictions of theoretical explosion models, time series spectroscopic observations of SN Ia serve to visualize the post-explosion material of an unknown progenitor system. For example during the summer of 2011 astronomers bore witness to SN 2011fe, the best observed normal type Ia supernova of the modern era. The prompt discovery and follow-up of this nearby event uniquely allowed for a more complete record of observed properties than all previous well-observed events. More specifically, the full range (in wavelength and time) of rapid spectroscopic changes was documented with continual day-to-day follow-up into the object’s post-maximum light phases and well beyond. However, the observational side of visualizing other SN Ia remains inefficient without the logistical coordination of many telescope networks (e.g., LCOGT; Brown et al. 2013), telescopes large enough to make nearly all SN “nearby” in terms of improved signal-to-noise ratios (e.g., The Thirty Meter Telescope, The Giant Magellan Telescope), or a space-based facility dedicated to the study of such time sensitive UVopticalNIR transients.
Existing SN Ia surveys are currently acting toward optimizing a steady flow of discoveries, while other programs have produced a significant number of publicly available spectra (Richardson et al., 2001; Matheson et al., 2008; Blondin et al., 2012; Yaron & Gal-Yam, 2012; Silverman et al., 2012c; Folatelli et al., 2013). However, for the longterm future we believe it is imperative to begin a discussion of a larger (digital) network of international collaboration by way of (data-) cooperative competition like that done for both The Large Hadron Collider Experiment and Fermi Lab’s Tevatron, with multiple competing experiments centered about mutual goals and mutual resources. Otherwise we feel the simultaneous collection of even very high quality temporal datasets by multiple groups will continue to create an inefficient pursuit of over-observing the most high profile event(s) of the year with a less than complete dataset.
Such observational pursuits require an increasingly focused effort toward observing bright and nearby events. For example, 206 supernovae were reported in 1999 and 67 were brighter than 18th magnitude while only three reached 13 magnitude212121Quoted from the archives page of http://www.rochesterastronomy.org/snimages/.. By 2012 the number of found supernovae increased to 1045 while 78 were brighter than 16th magnitude and five brighter than 13th magnitude. This clearly indicates that supernovae caught early are more prevalent than 15 years ago and it is worthwhile for multiple groups to continually increase collaborative efforts for the brightest events. Essentially this could be accomplished without interfering with spectrum-limited high[er]-z surveys by considering a distance threshold ( 1030 Mpc) as part of the public domain. Additionally, surveys that corroborate the immediate release of discoveries would further increase the number of well-observed events and could be supplemented and sustained with staggered observations given that there are two celestial hemispheres, unpredictable weather patterns, and caught-early opportunities nearly every week during active surveying.
In conclusion, to extract details of the spectroscopic behavior for all SN Ia subtypes, during all phases, larger samples of well-observed events are essential, beginning from as close to the onset of the explosion as possible (e.g., SN 1999ac, 2009ig, 2011fe, 2012cg, 2012fr), where SN Ia homogeneity diverges the most (see Zheng et al. 2013 for the most recent instance in SN 2013dy). Near-continuous temporal observations are most important for at least the first 12 months post-explosion and biweekly to monthly follow-up thereafter for 1 year. SN Ia spectra are far too complicated to do so otherwise. Even normal SN Ia deserve UVopticalIR spectroscopic follow-up at a 1:1 to 2:1 ratio between days passed and spectrum taken, whenever possible, given that fine differences between normal SN Ia detail the variance in explosion mechanism parameters and initial conditions of their unobserved progenitor systems. It is through such observing campaigns that the true diversity to the underlying nature of SN Ia events will be better understood.
Acknowledgements
This work was supported in part by NSF grant AST-0707704, and US DOE Grant DE-FG02- 07ER41517, and by SFB 676, GRK 1354 from the DFG. Support for Program number HST-GO- 12298.05-A was provided by NASA through a grant from the Space Telescope Science Institute, which is operated by the Association of Universities for Research in Astronomy, Incorporated, under NASA contract NAS5-26555. We wish to acknowledge the use of the Kurucz & Bell (1995) line list and colorbrewer2.org for the construction of Figure 3.
This review was made possible by collaborative discussions at the 2011 UC-UC-HIPACC International AstroComputing Summer School on Computational Explosive Astrophysics. We would like to thank Dan Kasen and Peter Nugent for organizing the program and providing the environment for a productive summit, and we hope that such programs for summer learning opportunities will continue in the future. We worked on this review during the visits of MP to the Homer L. Dodge Department of Physics and Astronomy, University of Oklahoma, Norman, OK, USA., McDonnell Center for the Space Science, Department of Physics, Washington University in St. Louis, USA., National Astronomical Observatory of Japan (NAOJ), Mitaka, Tokyo, Japan., and Inter-University Centre for Astronomy and Astrophysics (IUCAA), Pune, India.
MP is thankful to Prof. David Branch, Prof. Eddie Baron, Prof. Ramanath Cowsik, Prof. Shoken Miyama, Prof. Masahiko Hayashi, Prof. Yoichi Takeda, Prof. Wako Aoki, Prof. Ajit Kembhavi, Prof. Kandaswamy Subramanian, and Prof. T. Padamanabhan for their kind support, encouragement, and hospitality. JTP would like to thank the University of Oklahoma Supernova Group, Rollin Thomas, and Alicia Soderberg for several years of support and many enlightening discussions on reading supernova spectra. JTP wishes to acknowledge helpful discussions with B. Dilday, R. A. Fesen, R. Foley, M. L. Graham, D. A. Howell, G. H. Marion, D. Milisavljevic, P. Milne, D. Sand, and S. Valenti, as well as S. Perlmutter for an intriguing conversation on “characteristic information of SN Ia” at the 221st American Astronomical Society Meeting in Long Beach, CA. JTP is also indebted to Natalie Buckley-Medrano for influential comments on the text and figures presented here.
Finally, we would like to pay special tribute to our referee, Michael Childress, whose critical comments and suggestions were substantially helpful for the presentation of this review.
| SN Name | References |
|---|---|
| SN 1981B | Branch et al. 1983 |
| SN 1986G | Cristiani et al. 1992 |
| SN 1989B | Barbon et al. 1990; |
| Wells et al. 1994 | |
| SN 1990N | Mazzali et al. 1993; |
| Gómez & López 1998 | |
| SN 1991T | Filippenko et al. 1992a; |
| Gómez & López 1998 | |
| SN 1991bg | Filippenko et al. 1992b; |
| Turatto et al. 1996 | |
| SN 1994D | Patat et al. 1996; |
| Ruiz-Lapuente 1997; | |
| Gómez & López 1998; | |
| Blondin et al. 2012 | |
| SN 1994ae | Blondin et al. 2012 |
| SN 1995D | Sadakane et al. 1996; |
| Blondin et al. 2012 | |
| SN 1996X | Salvo et al. 2001; |
| Blondin et al. 2012 | |
| SN 1997br | Li et al. 1999; |
| Blondin et al. 2012 | |
| SN 1997cn | Turatto et al. 1998 |
| SN 1998aq | Branch et al. 2003 |
| SN 1998bu | Jha et al. 1999; |
| Matheson et al. 2008 | |
| SN 1998de | Modjaz et al. 2001; |
| Matheson et al. 2008 | |
| SN 1998es | Matheson et al. 2008 |
| SN 1999aa | Garavini et al. 2004 |
| SN 1999ac | Garavini et al. 2005; |
| Phillips et al. 2006; | |
| Matheson et al. 2008 | |
| SN 1999by | Garnavich et al. 2004; |
| Matheson et al. 2008 | |
| SN 1999ee | Hamuy et al. 2002 |
| SN 2000E | Valentini et al. 2003 |
| SN 2000cx | Li et al. 2001 |
| SN 2001V | Matheson et al. 2008 |
| SN 2001ay | Krisciunas et al. 2011 |
| SN 2001el | Wang et al. 2003 |
| SN 2002bo | Benetti et al. 2004; |
| Blondin et al. 2012 | |
| SN 2002cx | Li et al. 2003 |
| SN Name | References |
|---|---|
| SN 2002dj | Pignata et al. 2008; |
| Blondin et al. 2012 | |
| SN 2002er | Kotak et al. 2005 |
| SN 2003cg | Elias-Rosa et al. 2006; |
| Blondin et al. 2012 | |
| SN 2003du | Gerardy et al. 2004; |
| Anupama et al. 2005b; | |
| Leonard et al. 2005; | |
| Stanishev et al. 2007; | |
| Blondin et al. 2012 | |
| SN 2003hv | Leloudas et al. 2009; |
| Blondin et al. 2012 | |
| SN 2004S | Krisciunas et al. 2007 |
| SN 2004dt | Leonard et al. 2005; |
| Altavilla et al. 2007; | |
| Blondin et al. 2012 | |
| SN 2004eo | Pastorello et al. 2007a |
| SN 2005am | Blondin et al. 2012 |
| SN 2005cf | Garavini et al. 2007; |
| Wang et al. 2009b; | |
| Bufano et al. 2009 | |
| SN 2005cg | Quimby et al. 2006b |
| SN 2005hk | Chornock et al. 2006; |
| Phillips et al. 2007; | |
| Blondin et al. 2012 | |
| SN 2005hj | Quimby et al. 2007 |
| SN 2006D | Blondin et al. 2012 |
| SN 2006X | Wang et al. 2008a; |
| Yamanaka et al. 2009b; | |
| Blondin et al. 2012 | |
| SN 2006bt | Foley et al. 2010b |
| SN 2006gz | Hicken et al. 2007 |
| SN 2007ax | Blondin et al. 2012 |
| SN 2007if | Silverman et al. 2011; |
| Blondin et al. 2012 | |
| SN 2008J | Taddia et al. 2012 |
| SN 2008ha | Foley et al. 2009 |
| SN 2009dc | Silverman et al. 2011; |
| Taubenberger et al. 2011 | |
| PTF09dav | Sullivan et al. 2011b |
| SN 2011fe | Parrent et al. 2012 |
| SN 2011iv | Foley et al. 2012b |
| SN Name | References |
|---|---|
| SN 1981B | Leibundgut et al. 1993; |
| Saha et al. 1996; | |
| Hamuy et al. 1996; | |
| Saha et al. 2001b | |
| SN 1984A | Barbon et al. 1989 |
| SN 1986G | Filippenko et al. 1992b; |
| Ruiz-Lapuente & Lucy 1992; | |
| Leibundgut et al. 1993 | |
| SN 1989B | Barbon et al. 1990; |
| Wells et al. 1994; | |
| Richmond et al. 1995; | |
| Saha et al. 1999; | |
| Contardo et al. 2000; | |
| Saha et al. 2001a | |
| SN 1990N | Saha et al. 1997; |
| Lira et al. 1998; | |
| Saha et al. 2001a | |
| SN 1991T | Leibundgut et al. 1993; |
| Lira et al. 1998; | |
| Phillips et al. 1999; | |
| Krisciunas et al. 2004; | |
| Contardo et al. 2000; | |
| Saha et al. 2001b; | |
| Tsvetkov et al. 2011 | |
| SN 1991bg | Leibundgut et al. 1993; |
| Turatto et al. 1996; | |
| Mazzali et al. 1997; | |
| Contardo et al. 2000 | |
| SN 1992A | Leibundgut et al. 1993; |
| Hamuy et al. 1996; | |
| Drenkhahn & Richtler 1999; | |
| Contardo et al. 2000 | |
| SN 1992K | Hamuy et al. 1994 |
| SN 1992al | Misra et al. 2005 |
| SN 1992bc | Maza et al. 1994; |
| Contardo et al. 2000 | |
| SN 1992bo | Maza et al. 1994; |
| Contardo et al. 2000 |
| SN Name | References |
|---|---|
| SN 1994D | Hoflich et al. 1995; |
| Richmond et al. 1995; | |
| Patat et al. 1996; | |
| Vacca & Leibundgut 1996; | |
| Drenkhahn & Richtler 1999; | |
| Contardo et al. 2000 | |
| SN 1994ae | Contardo et al. 2000 |
| SN 1995D | Sadakane et al. 1996; |
| Contardo et al. 2000 | |
| SN 1996X | Phillips et al. 1999; |
| Salvo et al. 2001 | |
| SN 1997br | Li et al. 1999 |
| SN 1997cn | Turatto et al. 1998 |
| SN 1998aq | Riess et al. 1999; |
| Saha et al. 2001a | |
| SN 1998bu | Jha et al. 1999; |
| Hernandez et al. 2000; | |
| Saha et al. 2001a | |
| SN 1998de | Modjaz et al. 2001 |
| SN 1998es | Jha et al. 2006b; |
| Tsvetkov et al. 2011 | |
| SN 1999aa | Krisciunas et al. 2000; |
| Li et al. 2003; | |
| Tsvetkov et al. 2011 | |
| SN 1999ac | Jha et al. 2006b; |
| Phillips et al. 2006 | |
| SN 1999aw | Strolger et al. 2002 |
| SN 1999by | Vinkó et al. 2001; |
| Howell et al. 2001; | |
| Garnavich et al. 2004; | |
| Sullivan et al. 2011b | |
| SN 1999ee | Stritzinger et al. 2002; |
| Krisciunas et al. 2004 |
| SN Name | References |
|---|---|
| SN 2000E | Valentini et al. 2003 |
| SN 2000cx | Li et al. 2001; |
| Candia et al. 2003; | |
| Sollerman et al. 2004 | |
| SN 2001V | Vinkó et al. 2003 |
| SN 2001ay | Krisciunas et al. 2011 |
| SN 2001el | Krisciunas et al. 2003 |
| SN 2002bo | Benetti et al. 2004; |
| Stehle et al. 2005 | |
| SN 2002cv | Elias-Rosa et al. 2008 |
| SN 2002cx | Li et al. 2003 |
| SN 2002dj | Pignata et al. 2008 |
| SN 2002er | Pignata et al. 2004 |
| SN 2003cg | Elias-Rosa et al. 2006 |
| SN 2003du | Anupama et al. 2005b; |
| Stanishev et al. 2007; | |
| Tsvetkov et al. 2011 | |
| SN 2003fg | Howell et al. 2006; |
| Yamanaka et al. 2009b | |
| Scalzo et al. 2010 | |
| SN 2003hv | Leloudas et al. 2009 |
| SN 2004S | Misra et al. 2005; |
| Krisciunas et al. 2007 | |
| SN 2004dt | Altavilla et al. 2007 |
| SN 2004eo | Pastorello et al. 2007a |
| SN 2005am | Brown et al. 2005 |
| SN 2005bl | Taubenberger et al. 2008; |
| Hachinger et al. 2009 | |
| SN 2005cf | Pastorello et al. 2007b; |
| Wang et al. 2009b | |
| SN 2005hk | Phillips et al. 2007 |
| SN Name | References |
|---|---|
| SN 2006X | Wang et al. 2008b |
| SN 2006bt | Hicken et al. 2009b; |
| Foley et al. 2010b | |
| SN 2006gz | Hicken et al. 2007; |
| Scalzo et al. 2010 | |
| SN 2007ax | Kasliwal et al. 2008 |
| SN 2007if | Scalzo et al. 2010 |
| SN 2007qd | McClelland et al. 2010 |
| SN 2008J | Taddia et al. 2012 |
| SN 2008ha | Foley et al. 2009 |
| SN 2009dc | Yamanaka et al. 2009b; |
| Scalzo et al. 2010; | |
| Silverman et al. 2011; | |
| Taubenberger et al. 2011 | |
| SN 2009ig | Foley et al. 2012c |
| SN 2009ku | Narayan et al. 2011 |
| SN 2009nr | Khan et al. 2011b; |
| Tsvetkov et al. 2011 | |
| PTF09dav | Sullivan et al. 2011b |
| SN 2010jn | Hachinger et al. 2013 |
| SN 2011fe | Richmond & Smith 2012; |
| Munari et al. 2013; | |
| Pereira et al. 2013 | |
| SN 20011iv | Foley et al. 2012b |
| SN 2012cg | Silverman & Filippenko 2012; |
| Munari et al. 2013 | |
| SN 2012fr | Childress et al. 2013c |
Appendix A Some recent SN Ia, Continued
A.1 Peculiar SN 1997br in ESO 576-G40
Li et al. (1999) presented observations of the peculiar SN 1991T-like, SN 1997br (Bao Supernova Survey et al., 1997). Hatano et al. (2002) analyzed the spectra of SN 1997br and raised the question of whether or not Fe III and Ni III features in the early spectra are produced by 54Fe and 58Ni rather than by 56Fe and 56Ni. In addition, Hatano et al. (2002) discussed the issue of SN 1991T-like events as more powerful versions of normal SN Ia, rather than a physically distinct subgroup of events.
A.2 SN 1997cn in NGC 5490
Turatto et al. (1998) studied the faint SN 1997cn, which is located in an elliptical host galaxy (Li et al., 1997; Turatto et al., 1997). Like SN 1991bg, spectra of SN 1997cn show a deep Ti II trough between 4000 and 5000 Å, strong Ca II IR3 absorption features, a large (“Si II”), and slow mean expansion velocities.
A.3 SN 1997ff and other “farthest known” SN Ia
With a redshift of z = 1.7, SN 1997ff was the most distant SN Ia discovered at that time (Riess et al., 2001; Benítez et al., 2002). There have been 110 high-z (1 z 2) SN Ia discoveries since SN 1997ff (Riess et al., 2004, 2007; Suzuki et al., 2012), with the most recent and and one of the most distant SN Ia known being “SN UDS10Wil” at z = 1.914 (Jones et al., 2013). With these and future observations of “highest-z” SN Ia, constraints on DTD timescales (Strolger et al., 2010; Graur et al., 2013) and dark energy (Rubin et al., 2013) will certainly improve.
A.4 SN 1998aq in NGC 3982
Branch et al. (2003) used SYNOW to study 29 optical spectra of the normal SN 1998aq (Hurst et al., 1998), covering 9 days before to 241 days after maximum light (days 9 and 241, respectively). Notably, they find evidence for C II down to 11,000 km s-1, 3000 km s-1 below the cutoff of carbon in the pure deflagration model, W7 (Nomoto et al., 1984).
A.5 SN 1999aa in NGC 2595
From day 11 to day 58, Garavini et al. (2004) obtained 25 optical spectra of SN 1999aa (Armstrong & Schwartz, 1999). While SN 1999aa appears SN 1991T-like, Garavini et al. (2004) note that the Ca II absorption feature strengths are between those of SN 1991T (SS) and the SN 1990N (CN), along with a phase transition to normal SN Ia characteristics that sets in earlier than SN 1991T. Subsequently, they suggest SN 1999aa to be a link between SN 1991T-likes and spectroscopically normal SN Ia. Evidence of carbon-rich material is also found in SN 1999aa; decisively as C II 6580, tentatively as C III 4649 (see Parrent et al. 2011). A schematic representation of their SYNOW fitting results is also presented, showing the inference of Co II, Ni II, and Ni III during the pre-maximum phases. These results deserve further study from more detailed models.
A.6 SN 1999ac in NGC 2841
Between day 15 and day 42, Garavini et al. (2005) obtained spectroscopic observations of the unusual SN 1999ac (Modjaz et al., 1999). The pre-maximum light spectra are similar to that of SN 1999aa-like, while appearing spectroscopically normal during later epochs. Garavini et al. (2005) find evidence of a fairly conspicuous, heavily blended C II 6580 feature in the day 15 spectrum with approximate ejection velocities 16,000 km s-1. By day 9, the C II absorption feature is weak or absent amidst blending with the neighboring 6100 Å feature. This alone indicates that studies cannot fully constrain SN Ia models without spectra prior to day 10.
A.7 SN 1999aw in a low luminosity host galaxy
A.8 SN 1999by in NGC 2841
Vinkó et al. (2001) presented and discussed the first three pre-maximum light spectra of SN 1999by (Arbour et al., 1999), where they find it to be a sub-luminous SN Ia similar to SN 1991bg (Filippenko et al., 1992b; Leibundgut et al., 1993; Turatto et al., 1996), SN 1992K (Hamuy et al., 1994), SN 1997cn (Turatto et al., 1998), and SN 1998de (Modjaz et al., 2001); in addition, the list of sub-luminous SN Ia include SN 1957A, 1960H, 1971I, 1980I, 1986G (see Branch et al. 1993; Doull & Baron 2011 and references therein) and several other recently discovered under-luminous SN Ia (Howell, 2001; McClelland et al., 2010; Hachinger et al., 2009). Pre-maximum spectra of SN 1999by show relatively strong features due to O, Mg, and Si, which are due to explosive carbon burning. In addition, blue wavelength regions reveal spectra dominated by Ti II and some other IPEs.
Meanwhile, Höflich et al. (2002) studied the infrared spectra of SN 1999by, covering from day 4 to day 14. Post-maximum spectra show features which can be attributed to incomplete Si burning, while further support for incomplete burning comes from the detection of a pre-maximum C II absorption feature (Garnavich et al., 2004). Höflich et al. (2002) analyzed the spectra through the construction of an extended set of delayed detonation models covering the entire range of normal to sub-luminous SN Ia. They estimate the 56Ni mass for SN 1999by to be on the order of 0.1 M⊙. Garnavich et al. (2004) obtained UBVRIJHK light curves of SN 1999by. From the photometry of SN 1999by, the recent Cepheid distance to NGC 2841 (Macri et al., 2001), and minimal dust extinction along the line-of-sight, Garnavich et al. (2004) derive a peak absolute magnitude of M = 17.15.
In order to assess the role of material asymmetries as being responsible for the observed peculiarity of sub-luminous SN Ia, Howell et al. (2001) obtained polarization spectra of SN 1999by near maximum light. They find relatively low levels of polarization (0.3%0.8%), however significant enough to be consistent with a 20% departure from spherical symmetry (Maund et al., 2010b).
A.9 SN 1999ee in IC 5179
From day 10 to day 53, Stritzinger et al. (2002) obtained well-sampled UBVRIz light curves of SN 1999ee (Maza et al., 1999). They find the B-band light curve is broader than normal SN Ia, however sitting toward the over-luminous end of SN Ia peak brightnesses, with M = 19.85 0.28 and m15 = 0.94.
Hamuy et al. (2002) obtained optical and infrared spectroscopy of SN 1999ee between day 9 and day 42. Before maximum light, the spectra of SN 1999ee are normal, with relatively strong Si II 6100 Å absorption, however within the SS subtype (Branch et al., 2009). Hamuy et al. (2002) compared the infrared spectra of SN 1999ee to that of other SN Ia out to 60 days post-explosion, and find similar characteristics for SN 1999ee and 1994D (Meikle et al., 1996).
A.10 SN 2000E in NGC 6951
Valentini et al. (2003) obtained UBVRIJHK photometry and optical spectra of SN 2000E, which is located in a spiral galaxy. Optical spectra were obtained from 6 days before B-band maximum to 122 days after B-band maximum. The photometric observations span 230 days, starting at day 16. The photometric light curves of SN 2000E are similar to other SS SN Ia, however SN 2000E is classified as a slowly declining, spectroscopically “normal” SN Ia similar to SN 1990N. Valentini et al. (2003) estimate the 56Ni mass to be 0.9 M⊙ from the bolometric light curve.
A.11 SN 2000cx in NGC 524
One of the brightest supernovae observed in the year 2000 was the peculiar SN 2000cx, located in an S0 galaxy (Yu et al., 2000; Li et al., 2001; Candia et al., 2003). It was classified as a SN Ia with a spectrum resembling that of the peculiar SN 1991T (Chornock et al., 2000). Sollerman et al. (2004) obtained late time BVRIJH light curves of SN 2000cx covering 360 to 480 days after maximum. During these epochs, they find relatively constant NIR magnitudes, indicating the increasing importance (with time) of the NIR contribution to the bolometric light curve.
Branch et al. (2004b) decomposed the photospheric-phase spectra of SN 2000cx with SYNOW. Apart from confirming HVFs of Ca II IR3 (which are consistent with primordial abundances; Thomas et al. 2004), Branch et al. (2004b) also find HVFs of Ti II. They attribute the odd behavior of SN 2000cx’s B-band light curve to the time-dependent behavior of these highly line blanketing Ti II absorption signatures. Branch et al. (2004b) find an absorption feature near 4530 Å in the spectra of SN 2000cx that can be tentatively associated with H at high velocities, however this feature is more likely due to C III 4649 or S II/Fe II instead (see Parrent et al. 2011 and references therein).
Rudy et al. (2002) obtained 0.82.5 m spectra of SN 2000cx at day 7 and day 8 before maximum light. From the 10926 line of Mg II, they find that carbon-burning has taken place up to 25,000 km s-1. Given the SS subtype nature of SN 2000cx, the early epoch IR spectra of Rudy et al. (2002) are valuable for comparison with other SN Ia IR datasets.
A.12 SN 2001V in NGC 3987
Vinkó et al. (2003) presented photometry of SN 2001V (Jha et al., 2001). They find that SN 2001V is over-luminous, relative to the majority of SN Ia. Spectroscopic observations, spanning from day 14 to day 106, can be found in Matheson et al. (2008) and reveal it to be a SS SN Ia, consistent with its observed brightness.
A.13 Slowly declining SN 2001ay in IC 4423
Krisciunas et al. (2011) obtained optical and near infrared photometry, and optical and UV spectra of SN 2001ay (Swift et al., 2001). They find maximum light Si II and Mg II line velocities of 14,000 km s-1, with Si III and S II near 9,000 km s-1. SN 2001ay is one of the most slowly declining SN Ia. However, a m15(B) = 0.68 is odd given it is not over-luminous like SCC SN Ia slow decliners. In fact, the 56Ni yield of 0.58 is comparable to that of many normal SN Ia. Baron et al. (2012) note this apparent WLR violation is related to a decrease in -ray trapping deeper within the ejecta due to an overall outward shift of 56Ni, thus creating a fast rise in brightness followed by a slow decline caused by enhanced heating of the outer regions of material, which is a consequence of the larger expansion opacities.
A.14 SN 2001el in NGC 1448
Krisciunas et al. (2003) obtained well-sampled UBVRIJHK light curves of the nearby (about 18 Mpc) and normal SN 2001el (Monard et al., 2001), from day 11 to day 142. Because Krisciunas et al. (2003) obtained UBVRI and JHK light curves, they were able to measure a true opticalNIR reddening value (A = 0.57 mag along the line-of-sight) for the first time.
Mattila et al. (2005) obtained early time high resolution and low resolution optical spectra of SN 2001el. They estimate the mass loss rate (assuming 1050 km s-1 wind velocities) from the progenitor system of SN 2001el to be no greater than 9 x 10⁻⁶ M⊙ yr-1 and 5 x 10⁻⁵ M⊙ yr-1, respectively. The low resolution spectrum was obtained 400 days after maximum light with no apparent signatures of hydrogen Balmer lines. High velocity Ca II was detected out to 34,000 km s-1, while the 6100 Å absorption feature is suspected of harboring high velocity Si II (see also Kasen et al. 2003).
A.15 SN 2002bo in NGC 3190
Between day 13 and day 102, Benetti et al. (2004) collected optical and NIR spectra and photometry of the BL SN 2002bo (Cacella et al., 2002; Krisciunas et al., 2004). Estimates on host galaxy extinction from Na D equivalent width measurements are consistent with the inferred color excess determined by comparison to the Lira relation (Lira, 1995; Riess et al., 1996; Phillips et al., 1999). From the time-evolution of the 6100 Å absorption feature, Benetti et al. (2004) find that SN 2002bo is an intermediary between the BL SN 1984A and the CN SN 1994D. Benetti et al. (2004) also discuss SN 2002bo argue that some of the IME high velocity material may be primordial, while most is produced during the explosion and possibly by prolonged burning in a delayed detonation. This interpretation is also consistent with a lack of any clear signatures of unburned carbon. Stehle et al. (2005) studied the abundance stratification by fitting a series of spectra with a Monte Carlo code and found that the elements synthesized in different stages of burning are not completely mixed within the ejecta. In the case of SN 2002bo, they derived the total mass of 56Ni to be 0.52 M⊙. Similar to SN 2001ay’s fast rise to maximum light (Baron et al., 2012), Stehle et al. (2005) attribute SN 2002bo’s fast rise to outward mixing of 56Ni.
A.16 SN 2002cv in NGC 3190
The NIR photometry of SN 2002cv reveal an obscured SN Ia (Di Paola et al., 2002); more than 8 magnitudes of visual extinction. Both optical and NIR spectroscopy indicate SN 2002cv is most similar to SN 1991T (Meikle et al., 2002; Filippenko et al., 2002). It should also be noted that the SS SN 2002cv and the BL SN 2002bo share the same host galaxy. Elias-Rosa et al. (2008) obtained and analyzed VRIJHK photometry, in addition to a sampling of optical and NIR spectroscopy near and after maximum light, and find a best fit value for the ratio between inferred extinction and reddening, RV = 1.59 0.07 whereas 3.1 is often assumed for normal SN Ia (however see Tripp 1998; Astier et al. 2006; Krisciunas et al. 2006; Folatelli et al. 2010). They suggest this to indicate varying mean grain sizes for the dust along the line of sight toward SN 2002bo and 2002cv.
A.17 SN 2002dj in NGC 5018
For two years, and starting from day 11, Pignata et al. (2008) monitored the optical and IR behaviors of the SN 2002bo-like, high-velocity gradient SN 2002dj (Hutchings & Li, 2002). The dataset presented make it one of the most well-observed SN 1984A-like SN Ia and is a valuable tool for the discussion of SN Ia diversity.
A.18 SN 2002er in UGC 10743
From day 11 to day 215, Kotak et al. (2005) carried out spectroscopic follow-up for the reddened, CN SN 2002er (Wood-Vasey et al., 2002c). By contrast with the photometric behavior seen for SN 1992A, 1994D, and 1996X, SN 2002er stands out for its slightly delayed second peak in the I-band and similarly for V and R-bands. Pignata et al. (2004); Kotak et al. (2005) estimated the mass of 56Ni to be on the order of 0.6 to 0.7 M⊙, where the uncertainty in the exact distance to SN 2002er was the primary limitation.
A.19 SN 2003du in UGC 09391
For 480 days, and starting from day 13, Stanishev et al. (2007) monitored the CN SN 2003du. From modeling of the bolometric light curve, Stanishev et al. (2007) estimate the mass of 56Ni to between 0.6 and 0.8 M⊙. Like other normal SN Ia, the early spectra of SN 2003du contain HVFs of Ca II and a 6100 Å feature that departs from being only due to photospheric Si II, suggesting either a distinctly separate region of HV Si II or the radial extension of opacities from below.
Tanaka et al. (2011) studied the chemical composition distribution in the ejecta of SN 2003du by modeling a one year extended time series of optical spectra. Tanaka et al. (2011) do not find SN 2003du to be as fully mixed as a some 3D deflagration models. Specifically, from their modeling Tanaka et al. (2011) that the a core of stable IPEs supersedes 56Ni out to 3000 km s-1 ( 0.2 in mass coordinate). Atop this 0.65 M⊙ of 56Ni are layers of IMEs, while the outermost layers consist of oxygen, some silicon, and no more than 0.016 M⊙ of carbon above 10,500 km s-1.
A.20 SN 2003gs in NGC 936
Krisciunas et al. (2009) obtained near-maximum to late time optical and NIR observations of SN 2003gs, offering a chance to study the post-maximum light bolometric behavior of a fast declining SN Ia that was sub-luminous at optical wavelengths, but of standard luminosity in NIR bands at maximum light. Krisciunas et al. (2009) find m15(B) = 1.83 0.02 and discuss comparisons to other fast decliners; namely, SN 2003hv (Leloudas et al., 2009), SN 2004gs (Folatelli et al., 2010; Contreras et al., 2010), SN 2005bl (Taubenberger et al., 2008; Folatelli et al., 2010; Wood-Vasey et al., 2008), and SN 2005ke, 2006gt, and 2006mr (Folatelli et al., 2010; Contreras et al., 2010). In particular, Krisciunas et al. (2009) note that, in contrast to normal and over-luminous SN Ia, the delay in the time of J-band maximum from that of the B-band, for fast decliners, is inversely proportional to the peak NIR magnitude. Furthermore, they discussed the possibility for two subsets of FAINTCL fast decliners; those that do and do not show a J-band peak before the B-band (see also Kattner et al. 2012); respectively, SN 1986G, 2003gs, 2003hv, and 2006gt, and SN 1991bg, 1999by, 2005bl, 2005ke, and 2006mr.
Krisciunas et al. (2009) conclude that differences in NIR opacity within the outer layers are responsible for dissimilar -ray trapping, and therefore longer J-band than B-band diffusion times for FAINTCL SN Ia that are fainter in the NIR. However, the origin (differences of explosion mechanism and/or progenitor systems) for this apparent ‘bimodal’ difference in NIR opacity is not clear.
For SN 2003gs, Krisciunas et al. (2009) used UBVRIJHK photometry and Arnett’s rule (Arnett 1982, but also see Stritzinger & Leibundgut 2005) to estimate 0.25 M⊙ of 56Ni was produced during the explosion. As for the optical spectra, SN 2003gs is similar to SN 2004eo (A.23) in that it is found to have absorption signatures that are consistent with its photometric characteristics; a FAINTCL SN Ia with a larger than normal (Si II) and the presence of Ti II features near 40004500 Å.
A.21 SN 2003hv in NGC 1201
Leloudas et al. (2009) studied SN 2003hv out to very late phases (day 786). Notably, this seemingly spectroscopically normal SN Ia has m15(B) = 1.61, while the late time light curves show a deficit in flux that follow the decay of radioactive 56Co, assuming full and instantaneous positron trapping. Leloudas et al. (2009) consider this as possibly due to a redistribution of flux for SN 2003hv (a.k.a. an infrared catastrophe, see Axelrod 1980) from a dense clumping of inner material, and would also explain the flat-topped nebular emission lines (Motohara et al., 2006; Gerardy et al., 2007).
Mazzali et al. (2011) also studied the nebular spectrum of 2003hv and consider it as a non-standard event. They note that its late time flux deficit, compared to normal SN Ia, could be due to SN 2003hv having a lower mean density structure, possibly consistent with a sub-Chandrasekhar mass origin.
Motohara et al. (2006) presented NIR Subaru Telescope spectra of SN 2003du, 2003hv, and 2005W during their late phase evolution (200 days post-maximum light). For both SN 2003du and 2003hv, they find a flat-topped [Fe II] 16440 emission feature that is blue-shifted by 2000 km s-1 from the SN rest frame (FWHM 4000 km s-1). Motohara et al. (2006) further argue that the [Fe II] emission would be rounded on top if the neutron-rich Fe-peak isotopes produced in the explosion were thoroughly mixed with the surrounding distribution of 56Ni; for SN 2003du and 2003hv they suggest that this is not the case. In fact, they find that SN 1991T and 2005W (see their Fig. 1), at least, may represent instances where the inner most regions have been thoroughly mixed.
Similarly, Gerardy et al. (2007) looked to address the nature of the thermonuclear burning front by utilizing late time (135 days) mid-IR (5.215.2 m) Spitzer Space Telescope spectra of SN 2003hv and 2005df. In particular, Gerardy et al. (2007) find direct evidence in SN 2005df for a small inner zone of nickel that is surrounded by 56Co and an asymmetric shell-like structure of Ar. While it is not clear why a supposed initial deflagration phase of a DDT explosion mechanism produces little to no mixing for these two SN Ia, the observations of Gerardy et al. (2007) give strong support for a stratified abundance tomography like those seen in DDT-like models; the various species of material are restricted to radially confined zones, which is inconsistent with the large-scale mixing that is expected to occur in 3D deflagration models. This is also in agreement with X-ray observations of the Tycho supernova remnant (Badenes et al., 2006) in addition to optical and UV line resonance absorption imaging of SNR 1885 in M31 (Fesen et al., 2007).
A.22 SN 2004dt in NGC 0799
Wang et al. (2006) and Altavilla et al. (2007) studied the early spectral evolution of SN 2004dt from more than a week before optical maximum, when line profiles show matter moving at velocities as high as 25,000 km s-1. The variation of the polarization across some Si II lines approaches 2%, making SN 2004dt one of the most highly polarized SN Ia observed and an outlier in the polarization-nebular velocity plane (Maund et al., 2010b). In contrast with the polarization associated with Si II, Wang et al. (2006) find that the strong 7400 Å O IMg II absorption complex shows little or no polarization signature. Wang et al. (2006) conclude this is due to a spherical geometry of oxygen-rich material encompassing a lumpy distribution of IMEs.
A.23 SN 2004eo in NGC 6928
Pastorello et al. (2007a) presented optical and infrared observations of the transitional normal, CL SN 2004eo (Nakano et al., 2004). The light curves and spectra appear normal (M = 19.08) while exhibiting low mean expansion velocities and a fast declining B-band light curve (m15(B) = 1.46). The observed properties of SN 2004eo signify it is intermediate between FAINT, LVG, and HVG SN Ia. Mazzali et al. (2008) also consider SN 2004eo as a spectroscopically normal SN Ia that produced 0.43 0.05 M⊙ of 56Ni.
A.24 SN 2005am in NGC 2811
A.25 Under-luminous SN 2005bl in NGC 4070
Both Taubenberger et al. (2008) and Hachinger et al. (2009) studied the sub-luminous SN 2005bl with observations made between day and day 66, and carried out spectral analysis (“abundance tomography”) of SN 2005bl (Morrell et al., 2005). They find it to be one of incomplete burning similar to SN 1991bg and 1999by. Compared to SN 1991bg, a noteworthy difference of SN 1999by is the likely presence of carbon C II in pre-maximum spectra (Taubenberger et al., 2008), whereas C I 10691 is also clearly detected in NIR spectra (Höflich et al., 2002). However, this is likely a biased comparison to SN 1991bg given that the earliest spectrum obtained was on day 1 (potentially too late to detect unburned material via C II 6580). To our knowledge no conspicuous C I 10691 absorption features have been documented for other SN Ia. For example, C I 10691 is present in the pre-maximum spectra of SN 2011fe but it is not a conspicuous signature. Similarly, pre-maximum spectra of SN 2005bl show less conspicuous detections of C I and C II but still indicate low burning efficiency with a significant amount of leftover unburned material (Taubenberger et al., 2008). Hachinger et al. (2009) suggest that a detonation at low pre-expanded densities is responsible for the abundance stratification of IMEs seen in the spectra of SN 2005bl. This would also explain the remaining carbon-rich material seen for some CL SN Ia when caught early enough.
A.26 SN 2005cf in MCG-01-39-003
Wang et al. (2009b) studied UVopticalNIR observations of the normal SN 2005cf (see also Pastorello et al. 2007b). During the early evolution of the spectrum, HVFs of Ca II and Si II are found to be present above 18,000 km s-1 (confirming observations of Garavini et al. 2007). Gall et al. (2012) studied the NIR spectra of SN 2005cf at epochs from day 10 to day 42, which show clear signatures of Co II during post-maximum phases. In addition, they attribute fluorescence emission in making the underlying shape of the SED.
A.27 SN 2005cg in a low-luminosity, star forming host
Quimby et al. (2006b) presented and discussed the spectroscopic evolution and light curve of the SS SN 2005cg, which was discovered by ROTSE-IIIc. Pre-maximum spectra reveal HVFs of Ca II and Si II out to 24,000 km s-1 and Quimby et al. (2006b) find good consistency between observed and modeled Si II profiles. They interpret the steep rise in the blue wing of the Si II to be an indication of circumstellar interaction given that abundance estimates for HVFs suggest modest amounts of swept up material ( 10-4 10-3 M⊙; see Quimby et al. 2006b; Branch et al. 2006).
A.28 SN 2005hj
Quimby et al. (2007) obtained optical spectra of the SS SN 2005hj during pre-maximum and post-maximum light phases. From a ROTSE-IIIb unfiltered light curve, SN 2005hj reached an over-luminous peak absolute magnitude of 19.6 (assuming z = 0.0574). Interestingly, the sharp and shallow 6100 Å feature remains fairly stagnant at 10,600 km s-1 near and after maximum light, with a sudden decrease at later epochs. Similar to Quimby et al. (2006b), Quimby et al. (2007) find this also consistent with the interpretation that CSM is influencing spectral profiles of SN 1999aa-like SN Ia (see also Scalzo et al. 2010, 2012).
A.29 SN 2006D in MCG-01-33-034
Thomas et al. (2007) obtained the spectra of the spectroscopically normal SN 2006D from day 7 to day 13. The spectra show one of the clearest signatures of carbon-rich material at photospheric velocities observed in a normal SN Ia (below 10,000 km s-1). The 6300 Å carbon feature becomes weaker with time and disappears as the photosphere recedes and the SN reaches maximum brightness. These observationslike all SN Ia diversity studiesunderscore the importance of obtaining spectra of SN Ia during all phases. If [O I] and [C I] lines are present in the spectra during post-maximum light phases at velocities below 10,000 km s-1, this would indicate the presence of unburned matter. These particular lines have not been detected, however the absence of said signatures does not imply a complete lack of C+O material at low velocities (Baron et al., 2003; Kozma et al., 2005).
A.30 SN 2006X in M100
Wang et al. (2008b) presented UBVRI and JK light curves and optical spectroscopy of the reddened BL SN 2006X (Stockdale et al., 2006; Immler, 2006; Quimby et al., 2006a) and find high mean expansion velocities during pre-maximum light phases ( 20,000 km s-1). Wang et al. (2008b) suggest the observed properties of SN 2006X may be due to interaction with CSM. Yamanaka et al. (2009b) also presented and discussed the early spectral evolution. They note that the (Si II) ratio is unusually low for such a high-velocity gradient SN Ia. However, rather than this being an indication of low effective temperature, they suggest that the low (Si II) value is due to line-blending, likely from a higher velocity component of Si II. Both Wang et al. (2008b) and Yamanaka et al. (2009b) find the observed properties of SN 2006X to be consistent with characteristics of delayed detonation models.
Equipped with high resolution spectra of narrow Na D signatures spanning 100 days post-maximum light, Patat et al. (2007) infer the presence of intervening CSM and argue a mass loss history associated with SN 2006X in the decades prior to explosion. In fact, at least half of all SN Ia with narrow rest frame, blue-shifted Na D absorption profiles are associated with high ejecta velocities (Sternberg et al., 2011; Foley et al., 2012a). This indicates that CSM outflows are either present in some explosion scenarios or associated with all progenitors scenarios at some point during the lead up to the explosion.
Patat et al. (2009) later discussed the VLT spectropolarimetry of SN 2006X. In particular, they find that the presence of the high-velocity Ca II is coincident with a relatively high polarization signature (1.4%) at day 10, that diminishes by only 15% near maximum light, and is still present 41 days later. Patat et al. (2009) note that this day 40 detection is not seen for SN 2001el (Wang et al., 2003) or SN 2004du (Leonard et al., 2005). As for the high-velocity Si II, its polarization signature is seen to peak (1.1%) at day 6, drop by 30% near maximum, and is undetected well into the post-maximum phase. While the findings of spectropolarimetry studies of SN Ia are thought to be associated with, for example, “deflagration phase plumes” with time-dependent photospheric covering fractions, Patat et al. (2009) are unable to conclude why SN 2006X exhibits a sizable post-maximum light re-polarization signature by day 39.
A.31 SN 2006bt in CGCG 108-013
Foley et al. (2010b) obtained optical light curves and spectra of transitional CN/CL SN 2006bt (Lee & Li, 2006). The B-band decline rate, m15(B) = 1.09, is within the range that is observed for normal SN Ia, however SN 2006bt shows a larger than normal (Si II), slightly lower mean expansion velocities, and a lack of a double peak in the I-band; CL SN 1991bg-like properties. A tentative C II 6300 feature is identified, however with a minimum at 6450 Å. Foley et al. (2010b) suggest this inferred lower projected Doppler velocity could be accounted for by a clump of carbon offset from the line of sight at photospheric velocities. Because of an association within a halo population of its passive host galaxy, Foley et al. (2010b) conclude that the progenitor was also likely to be from an old population of stars.
A.32 Over-luminous SN 2006gz in IC 1277
Hicken et al. (2007) studied SN 2006gz (Prieto et al., 2006a) and estimated a peak intrinsic V-band brightness of 19.74 and m15(B) = 0.69, implying M(56Ni) 1.01.2 M⊙ (assuming = 2.13.1; see also Maeda et al. 2009). The spectroscopic signatures during early phases are relatively narrow on account of slightly lower mean expansion velocities. At two weeks before maximum light, Hicken et al. (2007) attributed a relatively strong 6300 Å feature to C II 6580 that diminishes in strength by day 10 (Prieto et al., 2006b). Compared to a 5 Å equivalent width 6300 Å absorption feature observed in the CN SN 1990N (Leibundgut et al., 1991; Jeffery et al., 1992), the absorption feature has an observed equivalent width of 25 Å in the early spectra of SN 2006gz (Hicken et al., 2007). So far, spectroscopic modeling that incorporate signatures of C II 6580 predict carbon mass fractions, X(C), that span an order of magnitude and are broadly consistent with both single- and double-degenerate scenarios.
Maeda et al. (2009) obtained Subaru and Keck observations of 2006gz at late-phases. Interestingly, SN 2006gz shows relatively weak pillars of iron emission that are usually seen in most SN Ia subtypes.
A.33 Extremely faint, SN 2007ax in NGC 2577
SN 2007ax was a very faint, red, and peculiar SN Ia. Kasliwal et al. (2008) find that it shares similarities with a sub-luminous SN 2005ke (Immler et al., 2006; Hughes et al., 2007; Patat et al., 2012) and also shows clear excess UV emission 20 days post-maximum light. Based on the small amount of synthesized 56Ni that is inferred (0.05 0.09 M⊙), along with SN Ia-like expansion velocities near maximum light (9000 km s-1), Kasliwal et al. (2008) conclude that SN 2007ax is not compatible with a number of theoretical models that have been proposed to explain FAINTCL SN Ia.
A.34 Over-luminous SN 2007if
Scalzo et al. (2010) find that SN 2007if qualifies as a SCC SN Ia, i.e. it is over-luminous (M = 20.4), has a slow-rise to peak brightness (trise = 24 days), the early spectra contain signatures of stronger than normal C II, and SN 2007if resides in a low-luminosity host (M = 14.10). Despite having a red B V color (0.16) at B-band maximum, signs of host reddening via Na D lines appear negligible. Utilizing Keck observations of the young metal-poor host galaxy, Childress et al. (2011) concluded that SN 2007if is likely to have originated from a young, metal-poor progenitor. From the H line of the host galaxy, Yuan et al. (2010) derived a redshift of 0.0736.
Based on the bolometric light curve and the sluggish Si II velocity evolution, Scalzo et al. (2010) conclude that SN 2007if was the death of a super-Chandrasekhar mass progenitor. They estimate the total mass of the system to be 2.4 M⊙, with 1.6 M⊙ of 56Ni, and 0.3 to 0.5 M⊙ in the form of a CO envelope. Given the possibility that other over-luminous events could potentially stem from similar super-Chandrasekhar mass origins, Scalzo et al. (2012) searched the SNFactory sample (based on a criterion of SN 1991T/2007if-like selections) and found four additional super-Chandrasekhar mass candidates.
A.35 SN 2007on in NGC 1404
SN 2007on was found associated with the elliptical galaxy, NGC 1404 (Pollas & Klotz, 2007). Voss & Nelemans (2008) reported the discovery of the progenitor of SN 2007on based on a detected X-ray source in pre-supernova archival X-ray images, located 0.9” 1.3” (later 1.15” 0.27”; Roelofs et al. 2008) from the position of SN 2007on within its host galaxy. However, Roelofs et al. (2008) later reevaluated the detection of the progenitor of SN 2007on and concluded that given the offset discrepancy between the X-ray source and the SN location, the probability for a connection is of order 1 percent. However, should SN Ia progenitors reveal themselves to be producers of pre-explosive X-ray sources, Voss & Nelemans (2008) suggest this would be consistent with a merger model with an accretion disc, formed from the disrupted companion star rather than an explosion immediately upon or soon after the merger of the two stars.
A.36 SN 2008J heavily reddened SN 2002ic-like in MGC-02-07-033
A.37 Sub-luminous SN 2008ha in UGC 12682
Foley et al. (2010a) studied the optical spectrum of SN 2008ha near maximum brightness (Puckett et al., 2008; Soderberg, 2009). It is found to be a dim thermonuclear SN Ia with uncommonly slow projected expansion velocities. Carbon features at maximum light indicate that carbon-rich material is present to significant depths in the SN ejecta. Consequently, Foley et al. (2010a) conclude that SN 2008ha was a failed deflagration since late time imaging and spectroscopy also give support to this idea (Kromer et al., 2013a).
A.38 SN 2009nr in UGC 8255
Khan et al. (2011b) discuss the photometric and spectroscopic observations of the over-luminous (M = 19.6, m15(B) = 0.95) SS SN 2009nr (Balanutsa & Lipunov, 2010). Similarly, Tsvetkov et al. (2011) made UBVRI photometric observations of SN 2009nr. They estimate that 0.78 1.07 M⊙ of 56Ni was synthesized during the explosion. Khan et al. (2011b) also find SN 2009nr is at a projected distance of 13.0 kpc from the nucleus of its star-forming host galaxy. In turn, this indicates that the progenitor of SN 2009nr was not associated with a young stellar population, i.e. SN 2009nr may not have originated from a “prompt” progenitor channel as is often assumed for SN Ia of its subtype.
A.39 Peculiar, sub-luminous PTF09dav
Sullivan et al. (2011b) studied the peculiar PTF09dav discovered by the Palomar Transient Factory. Sullivan et al. (2011b) find it to be faint (M = 15.5) compared to SN 1991bg, and does not satisfy the faint end of the WLR. Sullivan et al. (2011b) find estimates for both the 56Ni mass (0.019 M⊙) and ejecta mass (0.36 M⊙) significantly low for thermonuclear supernovae. The spectra are also consistent with signatures of Sc II, Mn I, Ti II, Sr II and low velocities of 6000 km s-1. The host galaxy of PTF09dav is not clear, however it appears this transient is not associated with massive, old stellar populations. Sullivan et al. (2011b) conclude that the observed properties of PTF09dav cannot be explained by the known models of sub-luminous SN Ia.
Notably, Kasliwal et al. (2012) recently presented late time spectra of PTF09dav (and other similar low luminosity transients). They confirm that this class of objects look nothing like SN Ia at all on account of little to no late-time iron emission, but instead with prominent emission from calcium in the NIR (Perets et al., 2010), confirming previous suspicions of Sullivan et al. (2011b).
A.40 PTF10ops, another peculiar cross-type SN Ia
Maguire et al. (2011) presented optical photometric and spectroscopic observations of a somewhat peculiar and sub-luminous SN Ia, PTF10ops (17.77 mag). Spectroscopically, this object has been noted as belonging to the CL class of SN Ia on account of the presence of conspicuous Ti II absorption features blue ward of 5000 Å, in addition to a larger than normal (Si II) ratio (partially indicative of cooler effective temperatures). Photometrically, PTF10ops overlaps “normal” SN Ia properties in m15(B) (1.12 0.06 mag) and its rise-time to maximum light (19.6 days). Maguire et al. (2011) estimate 0.17 M⊙ of 56Ni was produced during the explosion, which is well below what is expected for LVGCN SN Ia.
Maguire et al. (2011) also note that either PTF10ops remains without a visible host galaxy, or it resides within the outskirts of a massive spiral galaxy located at least 148 kpc away, which would be consistent with a possible influence of low metallicities or an old progenitor population. Maguire et al. (2011) suggest the progenitor could have been the merger of two compact objects (Pakmor et al., 2010), however time series spectrum synthesis is needed to confirm.
A.41 SN 2010jn in NGC 2929
The BL SN 2010jn was discovered by the Palomar Transient Factory (PTF10ygu) 15 days before it reached maximum light. Hachinger et al. (2013) performed spectroscopic analysis of the photospheric phase observations and find that the outer layers of SN 2010jn are rich in iron-group elements. At such high velocities (16,000 km s-1), iron-group elements have been tentatively identified in the spectra of SN Ia before (Hatano et al., 1999a) and may also be a ubiquitous property of SN Ia. However, more early epoch, time series observations are needed in order to test and confirm such claims. For SN 2010jn at least, Hachinger et al. (2013) favor a Chandrasekhar-mass delayed detonation, where the presence of iron-group elements within the outermost layers may be a consequence of outward mixing via hydrodynamical instabilities prior to or during the explosion (see Piro 2011, 2012).
A.42 SN 2011iv in NGC 1404
Foley et al. (2012b) presented the first maximum-light UV through NIR spectrum of a SN Ia (SN 2011iv; Drescher et al. 2011). Despite having a normal looking spectrum, SN 2011iv declined in brightness fairly quickly (m15(B) = 1.69). Since the UV region of a SN Ia spectrum is extremely sensitive to the composition of the outer layers, they offer the potential for strong constraints as soon as observational UV spectroscopic diversity is better understood.
A.43 SN 2012cg in NGC 4424
Silverman et al. (2012d) presented early epoch observations of the nearby spectroscopically normal SN 2012cg (Kandrashoff et al., 2012; Cenko et al., 2012; Marion et al., 2012), discovered immediately after the event (1.5 days after). Compared to the width of other normal SN Ia B-band light curves, Silverman et al. (2012d) find that SN 2012cg’s light curve relatively narrow for its peak absolute brightness, with = 17.3 days (coincident photometry was also presented by Munari et al. 2013). Mean expansion velocities within 2.5 days of the event were found to be more than 14,000 km s-1, while the earliest observations show high-velocity components of both Si II and Ca II. The C II 6580, 7234 absorption features were also detected very early.
Johansson et al. (2013) obtained upper limits on dust emission via far infrared Herschel Space Observatory flux measurements in the vicinity of the recent and nearby SN 2011by, 2011fe, and 2012cg. From non-detections during post-maximum epochs at 70 m and 160 m band-passes and archival image measurements, Johansson et al. (2013) exclude dust masses 7 x 10⁻³ M⊙ for SN 2011fe, and 10-1 M⊙ for SN 2011by and 2012cg for 500 K dust temperatures, 1017 cm dust shell radii, and peak SN bolometric luminosities of 109 L⊙.
A.44 SN 2000cx-like, SN 2013bh
Silverman et al. (2013c) discussed recent observations of SN 2013bh and found it similar to SN 2000cx on all accounts, with slightly higher mean expansion velocities. Silverman et al. (2013c) note that both of these SN Ia reside on the fringes of their spiral host galaxies. In addition, both SN 2000cx and 2013bh lack narrow Na D lines that would otherwise indicate an environment of CSM. Given the extreme similarities between SN 2000cx and 2013bh, Silverman et al. (2013c) suggest identical explosion scenarios for both events.
References
- Aldering et al. (2006) Aldering, G., et al. 2006, Astrophys. J., 650, 510
- Altavilla et al. (2007) Altavilla, G., et al. 2007, Astron. Astrophys., 475, 585
- Altavilla et al. (2009) —. 2009, Astrophys. J., 695, 135
- Anupama et al. (2005a) Anupama, G. C., Sahu, D. K., Deng, J., Nomoto, K., Tominaga, N., Tanaka, M., Mazzali, P. A., & Prabhu, T. P. 2005a, Astrophys. J. Lett., 631, L125
- Anupama et al. (2005b) Anupama, G. C., Sahu, D. K., & Jose, J. 2005b, Astron. Astrophys., 429, 667
- Arbour et al. (1999) Arbour, R., Papenkova, M., Li, W. D., Filippenko, A. V., & Armstrong, M. 1999, IAU Circ., 7156, 1
- Armstrong & Schwartz (1999) Armstrong, M., & Schwartz, M. 1999, IAU Circ., 7108, 1
- Arnett & Livne (1994a) Arnett, D., & Livne, E. 1994a, Astrophys. J., 427, 315
- Arnett & Livne (1994b) —. 1994b, Astrophys. J., 427, 330
- Arnett (1968) Arnett, W. D. 1968, Nature, 219, 1344
- Arnett (1969) —. 1969, Astrophys. Space Sci., 5, 180
- Arnett (1982) —. 1982, Astrophys. J., 253, 785
- Arsenijevic (2011) Arsenijevic, V. 2011, Mon. Not. R. Astron. Soc., 414, 1617
- Astier et al. (2006) Astier, P., et al. 2006, Astron. Astrophys., 447, 31
- Axelrod (1980) Axelrod, T. S. 1980, PhD thesis, California Univ., Santa Cruz.
- Baade (1936) Baade, W. 1936, Publ. Astron. Soc. Pac., 48, 226
- Baade et al. (1956) Baade, W., Burbidge, G. R., Hoyle, F., Burbidge, E. M., Christy, R. F., & Fowler, W. A. 1956, Publ. Astron. Soc. Pac., 68, 296
- Badenes et al. (2006) Badenes, C., Borkowski, K. J., Hughes, J. P., Hwang, U., & Bravo, E. 2006, Astrophys. J., 645, 1373
- Badenes et al. (2009) Badenes, C., Harris, J., Zaritsky, D., & Prieto, J. L. 2009, Astrophys. J., 700, 727
- Badenes & Maoz (2012) Badenes, C., & Maoz, D. 2012, Astrophys. J. Lett., 749, L11
- Bailey et al. (2009) Bailey, S., et al. 2009, Astron. Astrophys., 500, L17
- Balanutsa & Lipunov (2010) Balanutsa, P., & Lipunov, V. 2010, Central Bureau Electronic Telegrams, 2111, 1
- Bao Supernova Survey et al. (1997) Bao Supernova Survey, Qiao, Q.-Y., Wu, H., Wei, J.-Y., & Li, W.-D. 1997, IAU Circ., 6623, 1
- Barbon et al. (1990) Barbon, R., Benetti, S., Rosino, L., Cappellaro, E., & Turatto, M. 1990, Astron. Astrophys., 237, 79
- Barbon et al. (1989) Barbon, R., Rosino, L., & Iijima, T. 1989, Astron. Astrophys., 220, 83
- Baron et al. (2006) Baron, E., Bongard, S., Branch, D., & Hauschildt, P. H. 2006, Astrophys. J., 645, 480
- Baron et al. (1995) Baron, E., Hauschildt, P. H., & Mezzacappa, A. 1995, ArXiv Astrophysics e-prints
- Baron et al. (1996) Baron, E., Hauschildt, P. H., Nugent, P., & Branch, D. 1996, Mon. Not. R. Astron. Soc., 283, 297
- Baron et al. (2012) Baron, E., Höflich, P., Krisciunas, K., Dominguez, I., Khokhlov, A. M., Phillips, M. M., Suntzeff, N., & Wang, L. 2012, Astrophys. J., 753, 105
- Baron et al. (2008) Baron, E., Jeffery, D. J., Branch, D., Bravo, E., García-Senz, D., & Hauschildt, P. H. 2008, Astrophys. J., 672, 1038
- Baron et al. (2003) Baron, E., Lentz, E. J., & Hauschildt, P. H. 2003, Astrophys. J. Lett., 588, L29
- Barone-Nugent et al. (2012) Barone-Nugent, R. L., et al. 2012, Mon. Not. R. Astron. Soc., 425, 1007
- Bassett et al. (2007) Bassett, B., et al. 2007, Central Bureau Electronic Telegrams, 1137, 1
- Becker et al. (1997) Becker, R. H., Gregg, M. D., Hook, I. M., McMahon, R. G., White, R. L., & Helfand, D. J. 1997, Astrophys. J. Lett., 479, L93
- Benetti et al. (2004) Benetti, S., et al. 2004, Mon. Not. R. Astron. Soc., 348, 261
- Benetti et al. (2005) —. 2005, Astrophys. J., 623, 1011
- Benetti et al. (2011) —. 2011, Mon. Not. R. Astron. Soc., 411, 2726
- Benítez et al. (2002) Benítez, N., Riess, A., Nugent, P., Dickinson, M., Chornock, R., & Filippenko, A. V. 2002, Astrophys. J. Lett., 577, L1
- Bianco et al. (2011) Bianco, F. B., et al. 2011, Astrophys. J., 741, 20
- Blaylock et al. (2000) Blaylock, M., Branch, D., Casebeer, D., Millard, J., Baron, E., Richardson, D., & Ancheta, C. 2000, Publ. Astron. Soc. Pac., 112, 1439
- Blondin et al. (2013) Blondin, S., Dessart, L., Hillier, D. J., & Khokhlov, A. M. 2013, Mon. Not. R. Astron. Soc., 429, 2127
- Blondin et al. (2011) Blondin, S., Kasen, D., Röpke, F. K., Kirshner, R. P., & Mandel, K. S. 2011, Mon. Not. R. Astron. Soc., 417, 1280
- Blondin & Tonry (2007) Blondin, S., & Tonry, J. L. 2007, Astrophys. J., 666, 1024
- Blondin et al. (2012) Blondin, S., et al. 2012, Astron. J., 143, 126
- Bloom et al. (2012) Bloom, J. S., et al. 2012, Astrophys. J. Lett., 744, L17
- Bonaparte et al. (2013) Bonaparte, I., Matteucci, F., Recchi, S., Spitoni, E., Pipino, A., & Grieco, V. 2013, ArXiv e-prints
- Bongard et al. (2006) Bongard, S., Baron, E., Smadja, G., Branch, D., & Hauschildt, P. H. 2006, Astrophys. J., 647, 513
- Bongard et al. (2008) —. 2008, Astrophys. J., 687, 456
- Bowers et al. (1997) Bowers, E. J. C., Meikle, W. P. S., Geballe, T. R., Walton, N. A., Pinto, P. A., Dhillon, V. S., Howell, S. B., & Harrop-Allin, M. K. 1997, Mon. Not. R. Astron. Soc., 290, 663
- Branch (1972) Branch, D. 1972, Astron. Astrophys., 16, 247
- Branch (2004) Branch, D. 2004, in Cosmic explosions in three dimensions, ed. P. Höflich, P. Kumar, & J. C. Wheeler, 132
- Branch et al. (2005) Branch, D., Baron, E., Hall, N., Melakayil, M., & Parrent, J. 2005, Publ. Astron. Soc. Pac., 117, 545
- Branch et al. (2004a) Branch, D., Baron, E., Thomas, R. C., Kasen, D., Li, W., & Filippenko, A. V. 2004a, Publ. Astron. Soc. Pac., 116, 903
- Branch et al. (1982) Branch, D., Buta, R., Falk, S. W., McCall, M. L., Uomoto, A., Wheeler, J. C., Wills, B. J., & Sutherland, P. G. 1982, Astrophys. J. Lett., 252, L61
- Branch et al. (2009) Branch, D., Dang, L. C., & Baron, E. 2009, Publ. Astron. Soc. Pac., 121, 238
- Branch et al. (1993) Branch, D., Fisher, A., & Nugent, P. 1993, Astron. J., 106, 2383
- Branch et al. (2000) Branch, D., Jeffery, D. J., Blaylock, M., & Hatano, K. 2000, Publ. Astron. Soc. Pac., 112, 217
- Branch et al. (1983) Branch, D., Lacy, C. H., McCall, M. L., Sutherland, P. G., Uomoto, A., Wheeler, J. C., & Wills, B. J. 1983, Astrophys. J., 270, 123
- Branch et al. (2002a) Branch, D., Leighly, K. M., Thomas, R. C., & Baron, E. 2002a, Astrophys. J. Lett., 578, L37
- Branch et al. (2007a) Branch, D., Parrent, J., Troxel, M. A., Casebeer, D., Jeffery, D. J., Baron, E., Ketchum, W., & Hall, N. 2007a, in American Institute of Physics Conference Series, Vol. 924, The Multicolored Landscape of Compact Objects and Their Explosive Origins, ed. T. di Salvo, G. L. Israel, L. Piersant, L. Burderi, G. Matt, A. Tornambe, & M. T. Menna, 342–349
- Branch & Patchett (1973) Branch, D., & Patchett, B. 1973, Mon. Not. R. Astron. Soc., 161, 71
- Branch & Tammann (1992) Branch, D., & Tammann, G. A. 1992, Annu. Rev. Astron. Astrophys., 30, 359
- Branch et al. (2002b) Branch, D., et al. 2002b, Astrophys. J., 566, 1005
- Branch et al. (2003) —. 2003, Astron. J., 126, 1489
- Branch et al. (2004b) —. 2004b, Astrophys. J., 606, 413
- Branch et al. (2006) —. 2006, Publ. Astron. Soc. Pac., 118, 560
- Branch et al. (2007b) —. 2007b, Publ. Astron. Soc. Pac., 119, 709
- Branch et al. (2008) —. 2008, Publ. Astron. Soc. Pac., 120, 135
- Bravo et al. (2010) Bravo, E., Domínguez, I., Badenes, C., Piersanti, L., & Straniero, O. 2010, Astrophys. J. Lett., 711, L66
- Bravo et al. (2009) Bravo, E., García-Senz, D., Cabezón, R. M., & Domínguez, I. 2009, Astrophys. J., 695, 1257
- Bravo & Martínez-Pinedo (2012) Bravo, E., & Martínez-Pinedo, G. 2012, Phys. Rev. C, 85, 055805
- Bravo et al. (2011) Bravo, E., Piersanti, L., Domínguez, I., Straniero, O., Isern, J., & Escartin, J. A. 2011, Astron. Astrophys., 535, A114
- Brown et al. (2005) Brown, P. J., et al. 2005, Astrophys. J., 635, 1192
- Brown et al. (2012) —. 2012, Astrophys. J., 753, 22
- Brown et al. (2013) Brown, T. M., et al. 2013, Publ. Astron. Soc. Pac., 125, 1031
- Bufano et al. (2009) Bufano, F., et al. 2009, Astrophys. J., 700, 1456
- Buil (2012) Buil, C. 2012, Central Bureau Electronic Telegrams, 3277, 3
- Burns et al. (2011) Burns, C. R., et al. 2011, Astron. J., 141, 19
- Cacella et al. (2002) Cacella, P., Hirose, Y., Nakano, S., Kushida, Y., Kushida, R., & Li, W. D. 2002, IAU Circ., 7847, 1
- Calder et al. (2013) Calder, A. C., Krueger, B. K., Jackson, A. P., & Townsley, D. M. 2013, Frontiers of Physics
- Candia et al. (2003) Candia, P., et al. 2003, Publ. Astron. Soc. Pac., 115, 277
- Cartier et al. (2013) Cartier, R., et al. 2013, ArXiv e-prints
- Casebeer et al. (2008) Casebeer, D., Baron, E., Leighly, K., Jevremovic, D., & Branch, D. 2008, Astrophys. J., 676, 857
- Casebeer et al. (1998) Casebeer, D., Blaylock, M., Deaton, J., Branch, D., Baron, E., Richardson, D., & Ancheta, C. 1998, in Bulletin of the American Astronomical Society, Vol. 30, American Astronomical Society Meeting Abstracts, 1324
- Casebeer et al. (2000) Casebeer, D., Branch, D., Blaylock, M., Millard, J., Baron, E., Richardson, D., & Ancheta, C. 2000, Publ. Astron. Soc. Pac., 112, 1433
- Cenko et al. (2012) Cenko, S. B., Filippenko, A. V., Silverman, J. M., Gal-Yam, A., Pei, L., Nguyen, M., Carson, D., & Barth, A. J. 2012, Central Bureau Electronic Telegrams, 3111, 2
- Chandrasekhar (1957) Chandrasekhar, S. 1957, An introduction to the study of stellar structure.
- Chen et al. (2007) Chen, B., Kantowski, R., Baron, E., Knop, S., & Hauschildt, P. H. 2007, Mon. Not. R. Astron. Soc., 380, 104
- Chen et al. (2013) Chen, M. C., Herwig, F., Denissenkov, P. A., & Paxton, B. 2013, ArXiv e-prints
- Chen & Li (2009) Chen, W., & Li, X. 2009, Astrophys. J., 702, 686
- Childress et al. (2012) Childress, M., Zhou, G., Tucker, B., Bayliss, D., Scalzo, R., Yuan, F., & Schmidt, B. 2012, Central Bureau Electronic Telegrams, 3275, 2
- Childress et al. (2011) Childress, M., et al. 2011, Astrophys. J., 733, 3
- Childress et al. (2013a) —. 2013a, Astrophys. J., 770, 107
- Childress et al. (2013b) Childress, M. J., Filippenko, A. V., Ganeshalingam, M., & Schmidt, B. P. 2013b, ArXiv e-prints
- Childress et al. (2013c) Childress, M. J., et al. 2013c, Astrophys. J., 770, 29
- Chomiuk (2013) Chomiuk, L. 2013, Proc. Astron. Soc. Aust., 30, 46
- Chomiuk et al. (2012) Chomiuk, L., et al. 2012, Astrophys. J., 750, 164
- Chornock et al. (2006) Chornock, R., Filippenko, A. V., Branch, D., Foley, R. J., Jha, S., & Li, W. 2006, Publ. Astron. Soc. Pac., 118, 722
- Chornock et al. (2000) Chornock, R., Leonard, D. C., Filippenko, A. V., Li, W. D., Gates, E. L., & Chloros, K. 2000, IAU Circ., 7463, 1
- Chornock et al. (2011) Chornock, R., et al. 2011, Astrophys. J., 739, 41
- Claeys et al. (2014) Claeys, J. S. W., Pols, O. R., Izzard, R. G., Vink, J., & Verbunt, F. W. M. 2014, ArXiv e-prints
- Colgate & McKee (1969) Colgate, S. A., & McKee, C. 1969, Astrophys. J., 157, 623
- Conley et al. (2008) Conley, A., et al. 2008, Astrophys. J., 681, 482
- Contardo et al. (2000) Contardo, G., Leibundgut, B., & Vacca, W. D. 2000, Astron. Astrophys., 359, 876
- Contreras et al. (2010) Contreras, C., et al. 2010, Astron. J., 139, 519
- Cooke et al. (2011) Cooke, J., et al. 2011, Astrophys. J. Lett., 727, L35
- Cristiani et al. (1992) Cristiani, S., et al. 1992, Astron. Astrophys., 259, 63
- Dan et al. (2013) Dan, M., Rosswog, S., Brueggen, M., & Podsiadlowski, P. 2013, ArXiv e-prints
- Dan et al. (2012) Dan, M., Rosswog, S., Guillochon, J., & Ramirez-Ruiz, E. 2012, Mon. Not. R. Astron. Soc., 422, 2417
- de Kool & Begelman (1995) de Kool, M., & Begelman, M. C. 1995, Astrophys. J., 455, 448
- Deng et al. (2004) Deng, J., et al. 2004, Astrophys. J. Lett., 605, L37
- Deng et al. (2000) Deng, J. S., Qiu, Y. L., Hu, J. Y., Hatano, K., & Branch, D. 2000, Astrophys. J., 540, 452
- Dessart et al. (2013a) Dessart, L., Blondin, S., Hillier, D. J., & Khokhlov, A. 2013a, ArXiv e-prints
- Dessart et al. (2013b) Dessart, L., Hillier, D. J., Blondin, S., & Khokhlov, A. 2013b, ArXiv e-prints
- Dessart et al. (2012) Dessart, L., Hillier, D. J., Li, C., & Woosley, S. 2012, Mon. Not. R. Astron. Soc., 424, 2139
- Di Paola et al. (2002) Di Paola, A., Larionov, V., Arkharov, A., Bernardi, F., Caratti o Garatti, A., Dolci, M., Di Carlo, E., & Valentini, G. 2002, Astron. Astrophys., 393, L21
- Dilday et al. (2012) Dilday, B., et al. 2012, Science, 337, 942
- Domínguez & Khokhlov (2011) Domínguez, I., & Khokhlov, A. 2011, Astrophys. J., 730, 87
- Dong et al. (2014) Dong, S., Katz, B., Kushnir, D., & Prieto, J. L. 2014, ArXiv e-prints
- Doull & Baron (2011) Doull, B. A., & Baron, E. 2011, Publ. Astron. Soc. Pac., 123, 765
- Drenkhahn & Richtler (1999) Drenkhahn, G., & Richtler, T. 1999, Astron. Astrophys., 349, 877
- Drescher et al. (2011) Drescher, C., Parker, S., Brimacombe, J., Noguchi, T., & Nakano, S. 2011, Central Bureau Electronic Telegrams, 2940, 1
- Elias et al. (1985a) Elias, J. H., Matthews, K., Neugebauer, G., & Persson, S. E. 1985a, Astrophys. J., 296, 379
- Elias et al. (1985b) —. 1985b, Astrophys. J., 296, 379
- Elias-Rosa et al. (2006) Elias-Rosa, N., et al. 2006, Mon. Not. R. Astron. Soc., 369, 1880
- Elias-Rosa et al. (2008) —. 2008, Mon. Not. R. Astron. Soc., 384, 107
- Ellis et al. (2008) Ellis, R. S., et al. 2008, Astrophys. J., 674, 51
- Elmhamdi et al. (2006) Elmhamdi, A., Danziger, I. J., Branch, D., Leibundgut, B., Baron, E., & Kirshner, R. P. 2006, Astron. Astrophys., 450, 305
- Elvis (2000) Elvis, M. 2000, Astrophys. J., 545, 63
- Elvis (2012) Elvis, M. 2012, in Astronomical Society of the Pacific Conference Series, Vol. 460, AGN Winds in Charleston, ed. G. Chartas, F. Hamann, & K. M. Leighly, 186
- Fesen et al. (2007) Fesen, R. A., Höflich, P. A., Hamilton, A. J. S., Hammell, M. C., Gerardy, C. L., Khokhlov, A. M., & Wheeler, J. C. 2007, Astrophys. J., 658, 396
- Filippenko (1988) Filippenko, A. V. 1988, Astron. J., 96, 1941
- Filippenko (1992) —. 1992, Astrophys. J. Lett., 384, L37
- Filippenko (1997) —. 1997, Annu. Rev. Astron. Astrophys., 35, 309
- Filippenko et al. (2002) Filippenko, A. V., Chornock, R., Foley, R. J., & Li, W. 2002, IAU Circ., 7917, 2
- Filippenko et al. (1990) Filippenko, A. V., Porter, A. C., & Sargent, W. L. W. 1990, Astron. J., 100, 1575
- Filippenko et al. (1992a) Filippenko, A. V., et al. 1992a, Astrophys. J. Lett., 384, L15
- Filippenko et al. (1992b) —. 1992b, Astron. J., 104, 1543
- Fink et al. (2010) Fink, M., Röpke, F. K., Hillebrandt, W., Seitenzahl, I. R., Sim, S. A., & Kromer, M. 2010, Astron. Astrophys., 514, A53
- Fisher (2000) Fisher, A. K. 2000, PhD thesis, THE UNIVERSITY OF OKLAHOMA
- Folatelli et al. (2010) Folatelli, G., et al. 2010, Astron. J., 139, 120
- Folatelli et al. (2012) —. 2012, Astrophys. J., 745, 74
- Folatelli et al. (2013) —. 2013, Astrophys. J., 773, 53
- Foley (2012) Foley, R. J. 2012, ArXiv e-prints
- Foley et al. (2010a) Foley, R. J., Brown, P. J., Rest, A., Challis, P. J., Kirshner, R. P., & Wood-Vasey, W. M. 2010a, Astrophys. J. Lett., 708, L61
- Foley & Kasen (2011) Foley, R. J., & Kasen, D. 2011, Astrophys. J., 729, 55
- Foley et al. (2010b) Foley, R. J., Narayan, G., Challis, P. J., Filippenko, A. V., Kirshner, R. P., Silverman, J. M., & Steele, T. N. 2010b, Astrophys. J., 708, 1748
- Foley et al. (2009) Foley, R. J., et al. 2009, Astron. J., 138, 376
- Foley et al. (2012a) —. 2012a, Astrophys. J., 752, 101
- Foley et al. (2012b) —. 2012b, Astrophys. J. Lett., 753, L5
- Foley et al. (2012c) —. 2012c, Astrophys. J., 744, 38
- Foley et al. (2013) —. 2013, Astrophys. J., 767, 57
- Förster et al. (2012) Förster, F., González-Gaitán, S., Anderson, J., Marchi, S., Gutiérrez, C., Hamuy, M., Pignata, G., & Cartier, R. 2012, Astrophys. J. Lett., 754, L21
- Fox & Filippenko (2013) Fox, O. D., & Filippenko, A. V. 2013, ArXiv e-prints
- Friesen et al. (2012) Friesen, B., Baron, E., Branch, D., Chen, B., Parrent, J. T., & Thomas, R. C. 2012, Astrophys. J. Suppl. Ser., 203, 12
- Fryer & Diehl (2008) Fryer, C. L., & Diehl, S. 2008, in Astronomical Society of the Pacific Conference Series, Vol. 391, Hydrogen-Deficient Stars, ed. A. Werner & T. Rauch, 335
- Gall et al. (2012) Gall, E. E. E., Taubenberger, S., Kromer, M., Sim, S. A., Benetti, S., Blanc, G., Elias-Rosa, N., & Hillebrandt, W. 2012, Mon. Not. R. Astron. Soc., 427, 994
- Gamezo et al. (1999) Gamezo, V. N., Desbordes, D., & Oran, E. S. 1999, Combustion and Flame, 116, 154
- Gamezo et al. (2004) Gamezo, V. N., Khokhlov, A. M., & Oran, E. S. 2004, Physical Review Letters, 92, 211102
- Gamezo et al. (2005) —. 2005, Astrophys. J., 623, 337
- Gamezo et al. (2003) Gamezo, V. N., Khokhlov, A. M., Oran, E. S., Chtchelkanova, A. Y., & Rosenberg, R. O. 2003, Science, 299, 77
- Gamezo et al. (1999) Gamezo, V. N., Wheeler, J. C., Khokhlov, A. M., & Oran, E. S. 1999, Astrophys. J., 512, 827
- Ganeshalingam et al. (2011) Ganeshalingam, M., Li, W., & Filippenko, A. V. 2011, Mon. Not. R. Astron. Soc., 416, 2607
- Gaposchkin (1936) Gaposchkin, C. P. 1936, Astrophys. J., 83, 245
- Garavini et al. (2004) Garavini, G., et al. 2004, Astron. J., 128, 387
- Garavini et al. (2005) —. 2005, Astron. J., 130, 2278
- Garavini et al. (2007) —. 2007, Astron. Astrophys., 471, 527
- Garnavich et al. (2004) Garnavich, P. M., et al. 2004, Astrophys. J., 613, 1120
- Gerardy et al. (2004) Gerardy, C. L., et al. 2004, Astrophys. J., 607, 391
- Gerardy et al. (2007) —. 2007, Astrophys. J., 661, 995
- Germany et al. (2004) Germany, L. M., Reiss, D. J., Schmidt, B. P., Stubbs, C. W., & Suntzeff, N. B. 2004, Astron. Astrophys., 415, 863
- Gómez & López (1998) Gómez, G., & López, R. 1998, Astron. J., 115, 1096
- Goobar (2008) Goobar, A. 2008, Astrophys. J. Lett., 686, L103
- Graur et al. (2013) Graur, O., et al. 2013, ArXiv e-prints
- Guy et al. (2005) Guy, J., Astier, P., Nobili, S., Regnault, N., & Pain, R. 2005, Astron. Astrophys., 443, 781
- Guy et al. (2007) Guy, J., et al. 2007, Astron. Astrophys., 466, 11
- Hachinger et al. (2006) Hachinger, S., Mazzali, P. A., & Benetti, S. 2006, Mon. Not. R. Astron. Soc., 370, 299
- Hachinger et al. (2012) Hachinger, S., Mazzali, P. A., Taubenberger, S., Fink, M., Pakmor, R., Hillebrandt, W., & Seitenzahl, I. R. 2012, Mon. Not. R. Astron. Soc., 427, 2057
- Hachinger et al. (2009) Hachinger, S., Mazzali, P. A., Taubenberger, S., Pakmor, R., & Hillebrandt, W. 2009, Mon. Not. R. Astron. Soc., 399, 1238
- Hachinger et al. (2013) Hachinger, S., et al. 2013, Mon. Not. R. Astron. Soc., 429, 2228
- Hachisu et al. (2008) Hachisu, I., Kato, M., & Nomoto, K. 2008, Astrophys. J. Lett., 683, L127
- Hachisu et al. (1999) Hachisu, I., Kato, M., Nomoto, K., & Umeda, H. 1999, Astrophys. J., 519, 314
- Hachisu et al. (2012) Hachisu, I., Kato, M., Saio, H., & Nomoto, K. 2012, Astrophys. J., 744, 69
- Hamann & Sabra (2004) Hamann, F., & Sabra, B. 2004, in Astronomical Society of the Pacific Conference Series, Vol. 311, AGN Physics with the Sloan Digital Sky Survey, ed. G. T. Richards & P. B. Hall, 203
- Hamuy et al. (1995) Hamuy, M., Phillips, M. M., Maza, J., Suntzeff, N. B., Schommer, R. A., & Aviles, R. 1995, Astron. J., 109, 1
- Hamuy et al. (1996) Hamuy, M., Phillips, M. M., Suntzeff, N. B., Schommer, R. A., Maza, J., & Aviles, R. 1996, Astron. J., 112, 2391
- Hamuy et al. (1994) Hamuy, M., et al. 1994, Astron. J., 108, 2226
- Hamuy et al. (2002) —. 2002, Astron. J., 124, 417
- Hamuy et al. (2003) —. 2003, Nature, 424, 651
- Han & Podsiadlowski (2006) Han, Z., & Podsiadlowski, P. 2006, Mon. Not. R. Astron. Soc., 368, 1095
- Hansen & Wheeler (1969) Hansen, C. J., & Wheeler, J. C. 1969, Astrophys. Space Sci., 3, 464
- Harutyunyan et al. (2009) Harutyunyan, A., Elias-Rosa, N., & Benetti, S. 2009, Central Bureau Electronic Telegrams, 1768, 1
- Harutyunyan et al. (2008) Harutyunyan, A. H., et al. 2008, Astron. Astrophys., 488, 383
- Hatano et al. (1999a) Hatano, K., Branch, D., Fisher, A., Baron, E., & Filippenko, A. V. 1999a, Astrophys. J., 525, 881
- Hatano et al. (1999b) Hatano, K., Branch, D., Fisher, A., Millard, J., & Baron, E. 1999b, Astrophys. J. Suppl. Ser., 121, 233
- Hatano et al. (2000) Hatano, K., Branch, D., Lentz, E. J., Baron, E., Filippenko, A. V., & Garnavich, P. M. 2000, Astrophys. J. Lett., 543, L49
- Hatano et al. (2002) Hatano, K., Branch, D., Qiu, Y. L., Baron, E., Thielemann, F., & Fisher, A. 2002, New Astron., 7, 441
- Hauschildt & Baron (1999) Hauschildt, P. H., & Baron, E. 1999, Journal of Computational and Applied Mathematics, 109, 41
- Hayden et al. (2010a) Hayden, B. T., et al. 2010a, Astrophys. J., 722, 1691
- Hayden et al. (2010b) —. 2010b, Astrophys. J., 712, 350
- Hernandez et al. (2000) Hernandez, M., et al. 2000, Mon. Not. R. Astron. Soc., 319, 223
- Hicken et al. (2007) Hicken, M., Garnavich, P. M., Prieto, J. L., Blondin, S., DePoy, D. L., Kirshner, R. P., & Parrent, J. 2007, Astrophys. J. Lett., 669, L17
- Hicken et al. (2009a) Hicken, M., Wood-Vasey, W. M., Blondin, S., Challis, P., Jha, S., Kelly, P. L., Rest, A., & Kirshner, R. P. 2009a, Astrophys. J., 700, 1097
- Hicken et al. (2009b) Hicken, M., et al. 2009b, Astrophys. J., 700, 331
- Hicken et al. (2012) —. 2012, Astrophys. J. Suppl. Ser., 200, 12
- Hillebrandt et al. (2013) Hillebrandt, W., Kromer, M., Röpke, F. K., & Ruiter, A. J. 2013, Frontiers of Physics, 8, 116
- Hillebrandt et al. (2007) Hillebrandt, W., Sim, S. A., & Röpke, F. K. 2007, Astron. Astrophys., 465, L17
- Hillier & Dessart (2012) Hillier, D. J., & Dessart, L. 2012, Mon. Not. R. Astron. Soc., 424, 252
- Hoffmann et al. (2013) Hoffmann, T. L., Sauer, D. N., Pauldrach, A. W. A., & Hultzsch, P. J. N. 2013, ArXiv e-prints
- Höflich (2006) Höflich, P. 2006, Nuclear Physics A, 777, 579
- Höflich et al. (2002) Höflich, P., Gerardy, C. L., Fesen, R. A., & Sakai, S. 2002, Astrophys. J., 568, 791
- Hoflich et al. (1995) Hoflich, P., Khokhlov, A. M., & Wheeler, J. C. 1995, Astrophys. J., 444, 831
- Höflich et al. (1998) Höflich, P., Wheeler, J. C., & Thielemann, F. K. 1998, Astrophys. J., 495, 617
- Höflich et al. (2010) Höflich, P., et al. 2010, Astrophys. J., 710, 444
- Hogg et al. (2002) Hogg, D. W., Baldry, I. K., Blanton, M. R., & Eisenstein, D. J. 2002, ArXiv Astrophysics e-prints
- Hole et al. (2010) Hole, K. T., Kasen, D., & Nordsieck, K. H. 2010, Astrophys. J., 720, 1500
- Horesh et al. (2012) Horesh, A., et al. 2012, Astrophys. J., 746, 21
- Howell (2001) Howell, D. A. 2001, Astrophys. J. Lett., 554, L193
- Howell et al. (2001) Howell, D. A., Höflich, P., Wang, L., & Wheeler, J. C. 2001, Astrophys. J., 556, 302
- Howell et al. (2007) Howell, D. A., Sullivan, M., Conley, A., & Carlberg, R. 2007, Astrophys. J. Lett., 667, L37
- Howell et al. (2005) Howell, D. A., et al. 2005, Astrophys. J., 634, 1190
- Howell et al. (2006) —. 2006, Nature, 443, 308
- Howell et al. (2009) —. 2009, Astrophys. J., 691, 661
- Hsiao et al. (2007) Hsiao, E. Y., Conley, A., Howell, D. A., Sullivan, M., Pritchet, C. J., Carlberg, R. G., Nugent, P. E., & Phillips, M. M. 2007, Astrophys. J., 663, 1187
- Hsiao et al. (2013) Hsiao, E. Y., et al. 2013, Astrophys. J., 766, 72
- Hughes et al. (2007) Hughes, J. P., Chugai, N., Chevalier, R., Lundqvist, P., & Schlegel, E. 2007, Astrophys. J., 670, 1260
- Humason (1936) Humason, M. L. 1936, Publ. Astron. Soc. Pac., 48, 110
- Hummer (1976) Hummer, D. G. 1976, in IAU Symposium, Vol. 70, Be and Shell Stars, ed. A. Slettebak, 281
- Hurst et al. (1998) Hurst, G. M., Armstrong, M., & Arbour, R. 1998, IAU Circ., 6875, 1
- Hutchings & Li (2002) Hutchings, D., & Li, W. D. 2002, IAU Circ., 7918, 1
- Iben & Tutukov (1984) Iben, Jr., I., & Tutukov, A. V. 1984, Astrophys. J. Suppl. Ser., 54, 335
- Immler (2006) Immler, S. 2006, The Astronomer’s Telegram, 751, 1
- Immler et al. (2006) Immler, S., et al. 2006, Astrophys. J. Lett., 648, L119
- Iwamoto et al. (1999) Iwamoto, K., Brachwitz, F., Nomoto, K., Kishimoto, N., Umeda, H., Hix, W. R., & Thielemann, F.-K. 1999, Astrophys. J. Suppl. Ser., 125, 439
- Jack et al. (2012) Jack, D., Hauschildt, P. H., & Baron, E. 2012, Astron. Astrophys., 538, A132
- Jackson et al. (2010) Jackson, A. P., Calder, A. C., Townsley, D. M., Chamulak, D. A., Brown, E. F., & Timmes, F. X. 2010, Astrophys. J., 720, 99
- James & Baron (2010) James, S., & Baron, E. 2010, Astrophys. J., 718, 957
- Jeffery & Branch (1990) Jeffery, D. J., & Branch, D. 1990, in Supernovae, Jerusalem Winter School for Theoretical Physics, ed. J. C. Wheeler, T. Piran, & S. Weinberg, 149
- Jeffery et al. (2006) Jeffery, D. J., Branch, D., & Baron, E. 2006, ArXiv Astrophysics e-prints
- Jeffery et al. (2007) Jeffery, D. J., Ketchum, W., Branch, D., Baron, E., Elmhamdi, A., & Danziger, I. J. 2007, Astrophys. J. Suppl. Ser., 171, 493
- Jeffery et al. (1992) Jeffery, D. J., Leibundgut, B., Kirshner, R. P., Benetti, S., Branch, D., & Sonneborn, G. 1992, Astrophys. J., 397, 304
- Jeffery & Mazzali (2007) Jeffery, D. J., & Mazzali, P. A. 2007, in American Institute of Physics Conference Series, Vol. 924, The Multicolored Landscape of Compact Objects and Their Explosive Origins, ed. T. di Salvo, G. L. Israel, L. Piersant, L. Burderi, G. Matt, A. Tornambe, & M. T. Menna, 401–406
- Jha et al. (2006a) Jha, S., Branch, D., Chornock, R., Foley, R. J., Li, W., Swift, B. J., Casebeer, D., & Filippenko, A. V. 2006a, Astron. J., 132, 189
- Jha et al. (2001) Jha, S., Matheson, T., Challis, P., Kirshner, R., & Berlind, P. 2001, IAU Circ., 7585, 1
- Jha et al. (2007) Jha, S., Riess, A. G., & Kirshner, R. P. 2007, Astrophys. J., 659, 122
- Jha et al. (1999) Jha, S., et al. 1999, Astrophys. J. Suppl. Ser., 125, 73
- Jha et al. (2006b) —. 2006b, Astron. J., 131, 527
- Ji et al. (2013) Ji, S., et al. 2013, Astrophys. J., 773, 136
- Johansson et al. (2013) Johansson, J., Amanullah, R., & Goobar, A. 2013, Mon. Not. R. Astron. Soc.
- Johansson et al. (2014) Johansson, J., Woods, T. E., Gilfanov, M., Sarzi, M., Chen, Y.-M., & Oh, K. 2014, ArXiv e-prints
- Jones et al. (2013) Jones, D. O., et al. 2013, ArXiv e-prints
- Jordan et al. (2009) Jordan, G. C., Meakin, C. A., Hearn, N., Fisher, R. T., Townsley, D. M., Lamb, D. Q., & Truran, J. W. 2009, in Astronomical Society of the Pacific Conference Series, Vol. 406, Numerical Modeling of Space Plasma Flows: ASTRONUM-2008, ed. N. V. Pogorelov, E. Audit, P. Colella, & G. P. Zank, 92
- Jordan et al. (2012) Jordan, IV, G. C., Perets, H. B., Fisher, R. T., & van Rossum, D. R. 2012, Astrophys. J. Lett., 761, L23
- Justham (2011) Justham, S. 2011, Astrophys. J. Lett., 730, L34
- Kamiya et al. (2012) Kamiya, Y., Tanaka, M., Nomoto, K., Blinnikov, S. I., Sorokina, E. I., & Suzuki, T. 2012, Astrophys. J., 756, 191
- Kandrashoff et al. (2012) Kandrashoff, M., et al. 2012, Central Bureau Electronic Telegrams, 3111, 1
- Kasen (2006) Kasen, D. 2006, Astrophys. J., 649, 939
- Kasen (2010) —. 2010, Astrophys. J., 708, 1025
- Kasen et al. (2002) Kasen, D., Branch, D., Baron, E., & Jeffery, D. 2002, Astrophys. J., 565, 380
- Kasen et al. (2009) Kasen, D., Röpke, F. K., & Woosley, S. E. 2009, Nature, 460, 869
- Kasen et al. (2006) Kasen, D., Thomas, R. C., & Nugent, P. 2006, Astrophys. J., 651, 366
- Kasen et al. (2008) Kasen, D., Thomas, R. C., Röpke, F., & Woosley, S. E. 2008, Journal of Physics Conference Series, 125, 012007
- Kasen & Woosley (2007) Kasen, D., & Woosley, S. E. 2007, Astrophys. J., 656, 661
- Kasen et al. (2003) Kasen, D., et al. 2003, Astrophys. J., 593, 788
- Kasliwal et al. (2008) Kasliwal, M. M., et al. 2008, Astrophys. J. Lett., 683, L29
- Kasliwal et al. (2012) —. 2012, Astrophys. J., 755, 161
- Kattner et al. (2012) Kattner, S., et al. 2012, Publ. Astron. Soc. Pac., 124, 114
- Kerzendorf & Sim (2014) Kerzendorf, W. E., & Sim, S. A. 2014, ArXiv e-prints
- Ketchum et al. (2008) Ketchum, W., Baron, E., & Branch, D. 2008, Astrophys. J., 674, 371
- Khan et al. (2011a) Khan, R., Stanek, K. Z., Stoll, R., & Prieto, J. L. 2011a, Astrophys. J. Lett., 737, L24
- Khan et al. (2011b) Khan, R., et al. 2011b, Astrophys. J., 726, 106
- Khokhlov et al. (1993) Khokhlov, A., Mueller, E., & Höflich, P. 1993, Astron. Astrophys., 270, 223
- Khokhlov (1991a) Khokhlov, A. M. 1991a, Astron. Astrophys., 245, 114
- Khokhlov (1991b) —. 1991b, Astron. Astrophys., 245, L25
- Khokhlov (1995) —. 1995, Astrophys. J., 449, 695
- Khokhlov (2000) —. 2000, ArXiv Astrophysics e-prints
- Khokhlov et al. (1997) Khokhlov, A. M., Oran, E. S., & Wheeler, J. C. 1997, Astrophys. J., 478, 678
- Kilic et al. (2012) Kilic, M., Brown, W. R., Allende Prieto, C., Kenyon, S. J., Heinke, C. O., Agüeros, M. A., & Kleinman, S. J. 2012, Astrophys. J., 751, 141
- Kilic et al. (2013) Kilic, M., et al. 2013, ArXiv e-prints
- Kim et al. (2014) Kim, A. G., et al. 2014, ArXiv e-prints
- Kirshner et al. (1973a) Kirshner, R. P., Oke, J. B., Penston, M. V., & Searle, L. 1973a, Astrophys. J., 185, 303
- Kirshner et al. (1973b) Kirshner, R. P., Willner, S. P., Becklin, E. E., Neugebauer, G., & Oke, J. B. 1973b, Astrophys. J. Lett., 180, L97
- Kirshner et al. (1993) Kirshner, R. P., et al. 1993, Astrophys. J., 415, 589
- Kistler et al. (2013) Kistler, M. D., Stanek, K. Z., Kochanek, C. S., Prieto, J. L., & Thompson, T. A. 2013, Astrophys. J., 770, 88
- Kleiser et al. (2009) Kleiser, I., Cenko, S. B., Li, W., & Filippenko, A. V. 2009, Central Bureau Electronic Telegrams, 1918, 1
- Klotz et al. (2012) Klotz, A., et al. 2012, Central Bureau Electronic Telegrams, 3275, 1
- Knop et al. (2003) Knop, R. A., et al. 2003, Astrophys. J., 598, 102
- Knop et al. (2009) Knop, S., Hauschildt, P. H., & Baron, E. 2009, Astron. Astrophys., 501, 813
- Kotak et al. (2004) Kotak, R., Meikle, W. P. S., Adamson, A., & Leggett, S. K. 2004, Mon. Not. R. Astron. Soc., 354, L13
- Kotak et al. (2005) Kotak, R., et al. 2005, Astron. Astrophys., 436, 1021
- Kowal (1968) Kowal, C. T. 1968, Astron. J., 73, 1021
- Kozma & Fransson (1992) Kozma, C., & Fransson, C. 1992, Astrophys. J., 390, 602
- Kozma et al. (2005) Kozma, C., Fransson, C., Hillebrandt, W., Travaglio, C., Sollerman, J., Reinecke, M., Röpke, F. K., & Spyromilio, J. 2005, Astron. Astrophys., 437, 983
- Krisciunas (2005) Krisciunas, K. 2005, in Astronomical Society of the Pacific Conference Series, Vol. 339, Observing Dark Energy, ed. S. C. Wolff & T. R. Lauer, 75
- Krisciunas et al. (2000) Krisciunas, K., Hastings, N. C., Loomis, K., McMillan, R., Rest, A., Riess, A. G., & Stubbs, C. 2000, Astrophys. J., 539, 658
- Krisciunas et al. (2006) Krisciunas, K., Prieto, J. L., Garnavich, P. M., Riley, J.-L. G., Rest, A., Stubbs, C., & McMillan, R. 2006, Astron. J., 131, 1639
- Krisciunas et al. (2003) Krisciunas, K., et al. 2003, Astron. J., 125, 166
- Krisciunas et al. (2004) —. 2004, Astron. J., 128, 3034
- Krisciunas et al. (2007) —. 2007, Astron. J., 133, 58
- Krisciunas et al. (2009) —. 2009, Astron. J., 138, 1584
- Krisciunas et al. (2011) —. 2011, Astron. J., 142, 74
- Kromer et al. (2010) Kromer, M., Sim, S. A., Fink, M., Röpke, F. K., Seitenzahl, I. R., & Hillebrandt, W. 2010, Astrophys. J., 719, 1067
- Kromer et al. (2013a) Kromer, M., et al. 2013a, Mon. Not. R. Astron. Soc., 429, 2287
- Kromer et al. (2013b) —. 2013b, ArXiv e-prints
- Krueger et al. (2010) Krueger, B. K., Jackson, A. P., Townsley, D. M., Calder, A. C., Brown, E. F., & Timmes, F. X. 2010, Astrophys. J. Lett., 719, L5
- Krughoff et al. (2011) Krughoff, K. S., Connolly, A. J., Frieman, J., SubbaRao, M., Kilper, G., & Schneider, D. P. 2011, Astrophys. J., 731, 42
- Kurucz & Bell (1995) Kurucz, R., & Bell, B. 1995, Atomic Line Data (R.L. Kurucz and B. Bell) Kurucz CD-ROM No. 23. Cambridge, Mass.: Smithsonian Astrophysical Observatory, 1995., 23
- Kushnir et al. (2013) Kushnir, D., Katz, B., Dong, S., Livne, E., & Fernández, R. 2013, Astrophys. J. Lett., 778, L37
- Leaman et al. (2011) Leaman, J., Li, W., Chornock, R., & Filippenko, A. V. 2011, Mon. Not. R. Astron. Soc., 412, 1419
- Lee & Li (2006) Lee, E., & Li, W. 2006, Central Bureau Electronic Telegrams, 485, 1
- Lee & Jang (2012) Lee, M. G., & Jang, I. S. 2012, Astrophys. J. Lett., 760, L14
- Leibundgut et al. (1991) Leibundgut, B., Kirshner, R. P., Filippenko, A. V., Shields, J. C., Foltz, C. B., Phillips, M. M., & Sonneborn, G. 1991, Astrophys. J. Lett., 371, L23
- Leibundgut et al. (1993) Leibundgut, B., et al. 1993, Astron. J., 105, 301
- Leighly et al. (2009) Leighly, K. M., Hamann, F., Casebeer, D. A., & Grupe, D. 2009, Astrophys. J., 701, 176
- Leloudas et al. (2009) Leloudas, G., et al. 2009, Astron. Astrophys., 505, 265
- Leloudas et al. (2013) —. 2013, ArXiv e-prints
- Lentz et al. (2001a) Lentz, E. J., Baron, E., Branch, D., & Hauschildt, P. H. 2001a, Astrophys. J., 557, 266
- Lentz et al. (2001b) —. 2001b, Astrophys. J., 547, 402
- Lentz et al. (2000) Lentz, E. J., Baron, E., Branch, D., Hauschildt, P. H., & Nugent, P. E. 2000, Astrophys. J., 530, 966
- Leonard et al. (2005) Leonard, D. C., Li, W., Filippenko, A. V., Foley, R. J., & Chornock, R. 2005, Astrophys. J., 632, 450
- Li et al. (2011a) Li, W., Chornock, R., Leaman, J., Filippenko, A. V., Poznanski, D., Wang, X., Ganeshalingam, M., & Mannucci, F. 2011a, Mon. Not. R. Astron. Soc., 412, 1473
- Li et al. (2001) Li, W., et al. 2001, Publ. Astron. Soc. Pac., 113, 1178
- Li et al. (2003) —. 2003, Publ. Astron. Soc. Pac., 115, 453
- Li et al. (2011b) —. 2011b, Nature, 480, 348
- Li et al. (2011c) —. 2011c, Mon. Not. R. Astron. Soc., 412, 1441
- Li et al. (2011d) —. 2011d, Mon. Not. R. Astron. Soc., 412, 1441
- Li et al. (1997) Li, W.-D., Qiu, Y.-L., Qiao, Q.-Y., Zhang, Y., Zhou, W., & Hu, J.-Y. 1997, IAU Circ., 6661, 1
- Li et al. (1999) Li, W. D., et al. 1999, Astron. J., 117, 2709
- Liebert et al. (2005) Liebert, J., Bergeron, P., & Holberg, J. B. 2005, Astrophys. J. Suppl. Ser., 156, 47
- Lira (1995) Lira, P. 1995, Master’s thesis, University of Chile
- Lira et al. (1998) Lira, P., et al. 1998, Astron. J., 115, 234
- Livio & Pringle (2011) Livio, M., & Pringle, J. E. 2011, Astrophys. J. Lett., 740, L18
- Lundqvist et al. (2013) Lundqvist, P., et al. 2013, Mon. Not. R. Astron. Soc., 435, 329
- Macri et al. (2001) Macri, L. M., Stetson, P. B., Bothun, G. D., Freedman, W. L., Garnavich, P. M., Jha, S., Madore, B. F., & Richmond, M. W. 2001, Astrophys. J., 559, 243
- Maeda et al. (2009) Maeda, K., Kawabata, K., Li, W., Tanaka, M., Mazzali, P. A., Hattori, T., Nomoto, K., & Filippenko, A. V. 2009, Astrophys. J., 690, 1745
- Maeda et al. (2010a) Maeda, K., Röpke, F. K., Fink, M., Hillebrandt, W., Travaglio, C., & Thielemann, F.-K. 2010a, Astrophys. J., 712, 624
- Maeda et al. (2010b) Maeda, K., et al. 2010b, Nature, 466, 82
- Maeda et al. (2011) —. 2011, Mon. Not. R. Astron. Soc., 413, 3075
- Maguire et al. (2011) Maguire, K., et al. 2011, Mon. Not. R. Astron. Soc., 418, 747
- Maguire et al. (2012) —. 2012, Mon. Not. R. Astron. Soc., 426, 2359
- Mandel et al. (2011) Mandel, K. S., Narayan, G., & Kirshner, R. P. 2011, Astrophys. J., 731, 120
- Mannucci (2005) Mannucci, F. 2005, in Astronomical Society of the Pacific Conference Series, Vol. 342, 1604-2004: Supernovae as Cosmological Lighthouses, ed. M. Turatto, S. Benetti, L. Zampieri, & W. Shea, 140
- Maoz & Badenes (2010) Maoz, D., & Badenes, C. 2010, Mon. Not. R. Astron. Soc., 407, 1314
- Maoz et al. (2012) Maoz, D., Mannucci, F., & Brandt, T. D. 2012, Mon. Not. R. Astron. Soc., 426, 3282
- Maoz et al. (2013) Maoz, D., Mannucci, F., & Nelemans, G. 2013, ArXiv e-prints
- Maoz et al. (2010) Maoz, D., Sharon, K., & Gal-Yam, A. 2010, Astrophys. J., 722, 1879
- Margutti et al. (2012) Margutti, R., et al. 2012, Astrophys. J., 751, 134
- Marion et al. (2009a) Marion, G. H., Höflich, P., Gerardy, C. L., Vacca, W. D., Wheeler, J. C., & Robinson, E. L. 2009a, Astron. J., 138, 727
- Marion et al. (2003) Marion, G. H., Höflich, P., Vacca, W. D., & Wheeler, J. C. 2003, Astrophys. J., 591, 316
- Marion et al. (2006) Marion, G. H., Höflich, P., Wheeler, J. C., Robinson, E. L., Gerardy, C. L., & Vacca, W. D. 2006, Astrophys. J., 645, 1392
- Marion et al. (2012) Marion, G. H., Kirshner, R. P., Foley, R. J., Challis, P., & Irwin, J. 2012, Central Bureau Electronic Telegrams, 3111, 3
- Marion et al. (2013) Marion, G. H., et al. 2013, ArXiv e-prints
- Marion et al. (2009b) Marion, H., Garnavich, P., Challis, P., Calkins, M., & Peters, W. 2009b, Central Bureau Electronic Telegrams, 1776, 1
- Matheson et al. (2008) Matheson, T., et al. 2008, Astron. J., 135, 1598
- Matheson et al. (2012) —. 2012, Astrophys. J., 754, 19
- Mattila et al. (2005) Mattila, S., Lundqvist, P., Sollerman, J., Kozma, C., Baron, E., Fransson, C., Leibundgut, B., & Nomoto, K. 2005, Astron. Astrophys., 443, 649
- Maund et al. (2010a) Maund, J. R., et al. 2010a, Astrophys. J., 722, 1162
- Maund et al. (2010b) —. 2010b, Astrophys. J. Lett., 725, L167
- Maund et al. (2013) —. 2013, Mon. Not. R. Astron. Soc., 433, L20
- Maza et al. (1994) Maza, J., Hamuy, M., Phillips, M. M., Suntzeff, N. B., & Aviles, R. 1994, Astrophys. J. Lett., 424, L107
- Maza et al. (1999) Maza, J., Hamuy, M., Wischnjewsky, M., Gonzalez, L., Candia, P., & Lidman, C. 1999, IAU Circ., 7172, 1
- Mazzali et al. (2013) Mazzali, P., et al. 2013, ArXiv e-prints
- Mazzali (2000) Mazzali, P. A. 2000, Astron. Astrophys., 363, 705
- Mazzali et al. (2005a) Mazzali, P. A., Benetti, S., Stehle, M., Branch, D., Deng, J., Maeda, K., Nomoto, K., & Hamuy, M. 2005a, Mon. Not. R. Astron. Soc., 357, 200
- Mazzali et al. (1998) Mazzali, P. A., Cappellaro, E., Danziger, I. J., Turatto, M., & Benetti, S. 1998, Astrophys. J. Lett., 499, L49
- Mazzali et al. (1997) Mazzali, P. A., Chugai, N., Turatto, M., Lucy, L. B., Danziger, I. J., Cappellaro, E., della Valle, M., & Benetti, S. 1997, Mon. Not. R. Astron. Soc., 284, 151
- Mazzali & Lucy (1993) Mazzali, P. A., & Lucy, L. B. 1993, Astron. Astrophys., 279, 447
- Mazzali et al. (1993) Mazzali, P. A., Lucy, L. B., Danziger, I. J., Gouiffes, C., Cappellaro, E., & Turatto, M. 1993, Astron. Astrophys., 269, 423
- Mazzali et al. (2011) Mazzali, P. A., Maurer, I., Stritzinger, M., Taubenberger, S., Benetti, S., & Hachinger, S. 2011, Mon. Not. R. Astron. Soc., 416, 881
- Mazzali et al. (2008) Mazzali, P. A., Sauer, D. N., Pastorello, A., Benetti, S., & Hillebrandt, W. 2008, Mon. Not. R. Astron. Soc., 386, 1897
- Mazzali et al. (2005b) Mazzali, P. A., et al. 2005b, Astrophys. J. Lett., 623, L37
- McClelland et al. (2013) McClelland, C. M., Garnavich, P. M., Milne, P. A., Shappee, B. J., & Pogge, R. W. 2013, ArXiv e-prints
- McClelland et al. (2010) McClelland, C. M., et al. 2010, Astrophys. J., 720, 704
- McLaughlin (1959) McLaughlin, D. B. 1959, Astron. J., 64, 130
- McLaughlin (1960) —. 1960, Astron. J., 65, 54
- McLaughlin (1963) —. 1963, Publ. Astron. Soc. Pac., 75, 133
- Meikle et al. (2002) Meikle, P., Mattila, S., Glasse, A., Buckle, J., & Adamson, A. 2002, IAU Circ., 7911, 2
- Meikle et al. (1996) Meikle, W. P. S., et al. 1996, Mon. Not. R. Astron. Soc., 281, 263
- Meng et al. (2010) Meng, X., Yang, W., & Geng, X. 2010, New Astron., 15, 343
- Meng et al. (2011) Meng, X. C., Li, Z. M., & Yang, W. M. 2011, Publ. Astron. Soc. Jpn., 63, L31
- Milisavljevic et al. (2013a) Milisavljevic, D., et al. 2013a, Astrophys. J., 767, 71
- Milisavljevic et al. (2013b) —. 2013b, Astrophys. J. Lett., 770, L38
- Milne et al. (2013) Milne, P. A., Brown, P. J., Roming, P. W. A., Bufano, F., & Gehrels, N. 2013, ArXiv e-prints
- Minkowski (1939) Minkowski, R. 1939, Astrophys. J., 89, 156
- Minkowski (1940) —. 1940, Publ. Astron. Soc. Pac., 52, 206
- Minkowski (1941) —. 1941, Publ. Astron. Soc. Pac., 53, 224
- Minkowski (1963) —. 1963, Publ. Astron. Soc. Pac., 75, 505
- Misra et al. (2005) Misra, K., Kamble, A. P., Bhattacharya, D., & Sagar, R. 2005, Mon. Not. R. Astron. Soc., 360, 662
- Modjaz et al. (1999) Modjaz, M., King, J. Y., Papenkova, M., Friedman, A., Johnson, R. A., Li, W. D., Treffers, R. R., & Filippenko, A. V. 1999, IAU Circ., 7114, 1
- Modjaz et al. (2005) Modjaz, M., Kirshner, R., Challis, P., & Hao, H. 2005, Central Bureau Electronic Telegrams, 112, 1
- Modjaz et al. (2001) Modjaz, M., Li, W., Filippenko, A. V., King, J. Y., Leonard, D. C., Matheson, T., Treffers, R. R., & Riess, A. G. 2001, Publ. Astron. Soc. Pac., 113, 308
- Mohlabeng & Ralston (2013) Mohlabeng, G. M., & Ralston, J. P. 2013, ArXiv e-prints
- Moll et al. (2013) Moll, R., Raskin, C., Kasen, D., & Woosley, S. 2013, ArXiv e-prints
- Monard et al. (2001) Monard, A. G., Bock, G., Wassilieff, A., & Biggs, J. 2001, IAU Circ., 7720, 1
- Morrell et al. (2005) Morrell, N., Folatelli, G., Phillips, M., Contreras, C., & Hamuy, M. 2005, Central Bureau Electronic Telegrams, 139, 1
- Motohara et al. (2006) Motohara, K., et al. 2006, Astrophys. J. Lett., 652, L101
- Mueller & Eriguchi (1985) Mueller, E., & Eriguchi, Y. 1985, Astron. Astrophys., 152, 325
- Munari et al. (2013) Munari, U., Henden, A., Belligoli, R., Castellani, F., Cherini, G., Righetti, G. L., & Vagnozzi, A. 2013, New Astron., 20, 30
- Mustel (1971) Mustel, É. R. 1971, Soviet Astron., 15, 1
- Nakano et al. (2004) Nakano, S., Itagaki, K., & The. 2004, Central Bureau Electronic Telegrams, 88, 1
- Nakar & Sari (2012) Nakar, E., & Sari, R. 2012, Astrophys. J., 747, 88
- Napiwotzki et al. (2005) Napiwotzki, R., et al. 2005, in Astronomical Society of the Pacific Conference Series, Vol. 334, 14th European Workshop on White Dwarfs, ed. D. Koester & S. Moehler, 375
- Napiwotzki et al. (2007) Napiwotzki, R., et al. 2007, in Astronomical Society of the Pacific Conference Series, Vol. 372, 15th European Workshop on White Dwarfs, ed. R. Napiwotzki & M. R. Burleigh, 387
- Narayan et al. (2011) Narayan, G., et al. 2011, Astrophys. J. Lett., 731, L11
- Navasardyan et al. (2009) Navasardyan, H., Cappellaro, E., & Benetti, S. 2009, Central Bureau Electronic Telegrams, 1918, 2
- Nelemans et al. (2013) Nelemans, G., Toonen, S., & Bours, M. 2013, in IAU Symposium, Vol. 281, IAU Symposium, 225–231
- Nicolas & Prosperi (2009) Nicolas, J., & Prosperi, E. 2009, Central Bureau Electronic Telegrams, 1776, 2
- Niemeyer & Hillebrandt (1995) Niemeyer, J. C., & Hillebrandt, W. 1995, Astrophys. J., 452, 769
- Nobili et al. (2005) Nobili, S., et al. 2005, Astron. Astrophys., 437, 789
- Nomoto et al. (2013) Nomoto, K., Kamiya, Y., & Nakasato, N. 2013, in IAU Symposium, Vol. 281, IAU Symposium, 253–260
- Nomoto & Kondo (1991) Nomoto, K., & Kondo, Y. 1991, Astrophys. J. Lett., 367, L19
- Nomoto & Sugimoto (1977) Nomoto, K., & Sugimoto, D. 1977, Publ. Astron. Soc. Jpn., 29, 765
- Nomoto et al. (1984) Nomoto, K., Thielemann, F., & Yokoi, K. 1984, Astrophys. J., 286, 644
- Nomoto et al. (2003) Nomoto, K., Uenishi, T., Kobayashi, C., Umeda, H., Ohkubo, T., Hachisu, I., & Kato, M. 2003, in From Twilight to Highlight: The Physics of Supernovae, ed. W. Hillebrandt & B. Leibundgut, 115–+
- Nugent et al. (2002) Nugent, P., Kim, A., & Perlmutter, S. 2002, Publ. Astron. Soc. Pac., 114, 803
- Nugent et al. (1995) Nugent, P., Phillips, M., Baron, E., Branch, D., & Hauschildt, P. 1995, Astrophys. J. Lett., 455, L147+
- Nugent et al. (2011) Nugent, P. E., et al. 2011, Nature, 480, 344
- Oke & Searle (1974) Oke, J. B., & Searle, L. 1974, Annu. Rev. Astron. Astrophys., 12, 315
- Paczynski (1985) Paczynski, B. 1985, in Astrophysics and Space Science Library, Vol. 113, Cataclysmic Variables and Low-Mass X-ray Binaries, ed. D. Q. Lamb & J. Patterson, 1–12
- Pakmor et al. (2010) Pakmor, R., Kromer, M., Röpke, F. K., Sim, S. A., Ruiter, A. J., & Hillebrandt, W. 2010, Nature, 463, 61
- Pakmor et al. (2013) Pakmor, R., Kromer, M., Taubenberger, S., & Springel, V. 2013, Astrophys. J. Lett., 770, L8
- Pan et al. (2013) Pan, Y.-C., et al. 2013, ArXiv e-prints
- Panagia (2007) Panagia, N. 2007, in American Institute of Physics Conference Series, Vol. 937, Supernova 1987A: 20 Years After: Supernovae and Gamma-Ray Bursters, ed. S. Immler, K. Weiler, & R. McCray, 236–245
- Parodi et al. (2000) Parodi, B. R., Saha, A., Sandage, A., & Tammann, G. A. 2000, Astrophys. J., 540, 634
- Parrent et al. (2007) Parrent, J., et al. 2007, Publ. Astron. Soc. Pac., 119, 135
- Parrent et al. (2011) Parrent, J. T., et al. 2011, Astrophys. J., 732, 30
- Parrent et al. (2012) —. 2012, Astrophys. J. Lett., 752, L26
- Parthasarathy et al. (2007) Parthasarathy, M., Branch, D., Jeffery, D. J., & Baron, E. 2007, New Astron. Rev., 51, 524
- Pastorello et al. (2007a) Pastorello, A., et al. 2007a, Mon. Not. R. Astron. Soc., 377, 1531
- Pastorello et al. (2007b) —. 2007b, Mon. Not. R. Astron. Soc., 376, 1301
- Patat et al. (2009) Patat, F., Baade, D., Höflich, P., Maund, J. R., Wang, L., & Wheeler, J. C. 2009, Astron. Astrophys., 508, 229
- Patat et al. (1996) Patat, F., Benetti, S., Cappellaro, E., Danziger, I. J., della Valle, M., Mazzali, P. A., & Turatto, M. 1996, Mon. Not. R. Astron. Soc., 278, 111
- Patat et al. (2011) Patat, F., Chugai, N. N., Podsiadlowski, P., Mason, E., Melo, C., & Pasquini, L. 2011, Astron. Astrophys., 530, A63
- Patat et al. (2010) Patat, F., Cox, N. L. J., Parrent, J., & Branch, D. 2010, Astron. Astrophys., 514, A78
- Patat et al. (2012) Patat, F., Höflich, P., Baade, D., Maund, J. R., Wang, L., & Wheeler, J. C. 2012, Astron. Astrophys., 545, A7
- Patat et al. (2007) Patat, F., et al. 2007, Science, 317, 924
- Patat et al. (2013) —. 2013, Astron. Astrophys., 549, A62
- Pauldrach et al. (2013) Pauldrach, A. W. A., Hoffmann, T. L., & Hultzsch, P. J. N. 2013, ArXiv e-prints
- Payne-Gaposchkin & Whipple (1940) Payne-Gaposchkin, C., & Whipple, F. L. 1940, Proceedings of the National Academy of Science, 26, 264
- Pereira et al. (2013) Pereira, R., et al. 2013, ArXiv e-prints
- Perets et al. (2010) Perets, H. B., et al. 2010, Nature, 465, 322
- Perlmutter et al. (1999) Perlmutter, S., et al. 1999, Astrophys. J., 517, 565
- Pfannes et al. (2010) Pfannes, J. M. M., Niemeyer, J. C., & Schmidt, W. 2010, Astron. Astrophys., 509, A75
- Phillips (1993) Phillips, M. M. 1993, Astrophys. J. Lett., 413, L105
- Phillips (2012) —. 2012, Proc. Astron. Soc. Aust., 29, 434
- Phillips et al. (1999) Phillips, M. M., Lira, P., Suntzeff, N. B., Schommer, R. A., Hamuy, M., & Maza, J. 1999, Astron. J., 118, 1766
- Phillips et al. (2006) Phillips, M. M., et al. 2006, Astron. J., 131, 2615
- Phillips et al. (2007) —. 2007, Publ. Astron. Soc. Pac., 119, 360
- Phillips et al. (2013) —. 2013, ArXiv e-prints
- Piersanti et al. (2003) Piersanti, L., Gagliardi, S., Iben, Jr., I., & Tornambé, A. 2003, Astrophys. J., 598, 1229
- Pignata et al. (2004) Pignata, G., et al. 2004, Mon. Not. R. Astron. Soc., 355, 178
- Pignata et al. (2008) —. 2008, Mon. Not. R. Astron. Soc., 388, 971
- Pinto & Eastman (2000a) Pinto, P. A., & Eastman, R. G. 2000a, Astrophys. J., 530, 744
- Pinto & Eastman (2000b) —. 2000b, Astrophys. J., 530, 757
- Piro (2011) Piro, A. L. 2011, Astrophys. J. Lett., 738, L5
- Piro (2012) —. 2012, Astrophys. J., 759, 83
- Piro & Nakar (2013) Piro, A. L., & Nakar, E. 2013, Astrophys. J., 769, 67
- Pollas & Klotz (2007) Pollas, C., & Klotz, A. 2007, Central Bureau Electronic Telegrams, 1121, 1
- Popper (1937) Popper, D. M. 1937, Publ. Astron. Soc. Pac., 49, 283
- Prieto et al. (2006a) Prieto, J. L., Depoy, D., & Garnavich, P. 2006a, Central Bureau Electronic Telegrams, 651, 1
- Prieto et al. (2006b) Prieto, J. L., Rest, A., & Suntzeff, N. B. 2006b, Astrophys. J., 647, 501
- Prieto et al. (2007) Prieto, J. L., et al. 2007, ArXiv e-prints
- Pskovskii (1969) Pskovskii, Y. P. 1969, Soviet Astron., 12, 750
- Puckett et al. (2008) Puckett, T., Moore, C., Newton, J., & Orff, T. 2008, Central Bureau Electronic Telegrams, 1567, 1
- Puckett et al. (2009) Puckett, T., Moore, R., Newton, J., & Orff, T. 2009, Central Bureau Electronic Telegrams, 1762, 1
- Quimby et al. (2006a) Quimby, R., Brown, P., Gerardy, C., Odewahn, S. C., & Rostopchin, S. 2006a, Central Bureau Electronic Telegrams, 393, 1
- Quimby et al. (2005) Quimby, R., Höflich, P., Kannappan, S. J., Burket, J., & Li, W. 2005, IAU Circ., 8625, 2
- Quimby et al. (2006b) Quimby, R., Höflich, P., Kannappan, S. J., Rykoff, E., Rujopakarn, W., Akerlof, C. W., Gerardy, C. L., & Wheeler, J. C. 2006b, Astrophys. J., 636, 400
- Quimby et al. (2007) Quimby, R., Höflich, P., & Wheeler, J. C. 2007, Astrophys. J., 666, 1083
- Raskin & Kasen (2013) Raskin, C., & Kasen, D. 2013, ArXiv e-prints
- Raskin et al. (2013) Raskin, C., Kasen, D., Moll, R., Schwab, J., & Woosley, S. 2013, ArXiv e-prints
- Reinecke et al. (2002a) Reinecke, M., Hillebrandt, W., & Niemeyer, J. C. 2002a, Astron. Astrophys., 386, 936
- Reinecke et al. (2002b) —. 2002b, Astron. Astrophys., 391, 1167
- Richardson et al. (2001) Richardson, D., Thomas, R. C., Casebeer, D., Blankenship, Z., Ratowt, S., Baron, E., & Branch, D. 2001, in Bulletin of the American Astronomical Society, Vol. 33, American Astronomical Society Meeting Abstracts, 1428
- Richmond & Smith (2012) Richmond, M. W., & Smith, H. A. 2012, Journal of the American Association of Variable Star Observers (JAAVSO), 40, 872
- Richmond et al. (1995) Richmond, M. W., et al. 1995, Astron. J., 109, 2121
- Riess et al. (1996) Riess, A. G., Press, W. H., & Kirshner, R. P. 1996, Astrophys. J., 473, 88
- Riess et al. (1999) Riess, A. G., et al. 1999, Astron. J., 118, 2675
- Riess et al. (2001) —. 2001, Astrophys. J., 560, 49
- Riess et al. (2004) —. 2004, Astrophys. J., 607, 665
- Riess et al. (2007) —. 2007, Astrophys. J., 659, 98
- Rodney & Tonry (2009) Rodney, S. A., & Tonry, J. L. 2009, Astrophys. J., 707, 1064
- Roelofs et al. (2008) Roelofs, G., Bassa, C., Voss, R., & Nelemans, G. 2008, Mon. Not. R. Astron. Soc., 391, 290
- Röpke et al. (2005) Röpke, F. K., Gieseler, M., & Hillebrandt, W. 2005, in Astronomical Society of the Pacific Conference Series, Vol. 342, 1604-2004: Supernovae as Cosmological Lighthouses, ed. M. Turatto, S. Benetti, L. Zampieri, & W. Shea, 397
- Röpke et al. (2006) Röpke, F. K., Hillebrandt, W., Niemeyer, J. C., & Woosley, S. E. 2006, Astron. Astrophys., 448, 1
- Röpke et al. (2012) Röpke, F. K., et al. 2012, Astrophys. J. Lett., 750, L19
- Rubin et al. (2013) Rubin, D., et al. 2013, Astrophys. J., 763, 35
- Rudy et al. (2002) Rudy, R. J., Lynch, D. K., Mazuk, S., Venturini, C. C., Puetter, R. C., & Höflich, P. 2002, Astrophys. J., 565, 413
- Ruiter et al. (2009) Ruiter, A. J., Belczynski, K., & Fryer, C. 2009, Astrophys. J., 699, 2026
- Ruiz-Lapuente (1997) Ruiz-Lapuente, P. 1997, The Observatory, 117, 312
- Ruiz-Lapuente & Lucy (1992) Ruiz-Lapuente, P., & Lucy, L. B. 1992, Astrophys. J., 400, 127
- Sadakane et al. (1996) Sadakane, K., et al. 1996, Publ. Astron. Soc. Jpn., 48, 51
- Saffer et al. (1998) Saffer, R. A., Livio, M., & Yungelson, L. R. 1998, Astrophys. J., 502, 394
- Saha et al. (1996) Saha, A., Sandage, A., Labhardt, L., Tammann, G. A., Macchetto, F. D., & Panagia, N. 1996, Astrophys. J., 466, 55
- Saha et al. (1997) —. 1997, Astrophys. J., 486, 1
- Saha et al. (2001a) Saha, A., Sandage, A., Tammann, G. A., Dolphin, A. E., Christensen, J., Panagia, N., & Macchetto, F. D. 2001a, Astrophys. J., 562, 314
- Saha et al. (1999) Saha, A., Sandage, A., Tammann, G. A., Labhardt, L., Macchetto, F. D., & Panagia, N. 1999, Astrophys. J., 522, 802
- Saha et al. (2001b) Saha, A., Sandage, A., Thim, F., Labhardt, L., Tammann, G. A., Christensen, J., Panagia, N., & Macchetto, F. D. 2001b, Astrophys. J., 551, 973
- Sahu et al. (2008) Sahu, D. K., et al. 2008, Astrophys. J., 680, 580
- Saio & Nomoto (1985) Saio, H., & Nomoto, K. 1985, Astron. Astrophys., 150, L21
- Saio & Nomoto (2004) —. 2004, Astrophys. J., 615, 444
- Salvo et al. (2001) Salvo, M. E., Cappellaro, E., Mazzali, P. A., Benetti, S., Danziger, I. J., Patat, F., & Turatto, M. 2001, Mon. Not. R. Astron. Soc., 321, 254
- Sauer et al. (2006) Sauer, D. N., Hoffmann, T. L., & Pauldrach, A. W. A. 2006, Astron. Astrophys., 459, 229
- Sauer et al. (2008) Sauer, D. N., et al. 2008, Mon. Not. R. Astron. Soc., 391, 1605
- Scalzo et al. (2012) Scalzo, R., et al. 2012, Astrophys. J., 757, 12
- Scalzo et al. (2010) Scalzo, R. A., et al. 2010, Astrophys. J., 713, 1073
- Scannapieco & Bildsten (2005) Scannapieco, E., & Bildsten, L. 2005, Astrophys. J. Lett., 629, L85
- Schaefer (2011) Schaefer, B. E. 2011, Astrophys. J., 742, 112
- Schmidt (2004) Schmidt, B. P. 2004, Bulletin of the Astronomical Society of India, 32, 269
- Seitenzahl et al. (2009) Seitenzahl, I. R., Taubenberger, S., & Sim, S. A. 2009, Mon. Not. R. Astron. Soc., 400, 531
- Seitenzahl et al. (2013) Seitenzahl, I. R., et al. 2013, Mon. Not. R. Astron. Soc., 429, 1156
- Shappee et al. (2013) Shappee, B. J., Stanek, K. Z., Pogge, R. W., & Garnavich, P. M. 2013, Astrophys. J. Lett., 762, L5
- Shen et al. (2013) Shen, K. J., Guillochon, J., & Foley, R. J. 2013, ArXiv e-prints
- Shen et al. (2010) Shen, K. J., Kasen, D., Weinberg, N. N., Bildsten, L., & Scannapieco, E. 2010, Astrophys. J., 715, 767
- Silverman & Filippenko (2012) Silverman, J. M., & Filippenko, A. V. 2012, Mon. Not. R. Astron. Soc., 425, 1917
- Silverman et al. (2013a) Silverman, J. M., Ganeshalingam, M., & Filippenko, A. V. 2013a, Mon. Not. R. Astron. Soc., 430, 1030
- Silverman et al. (2012a) Silverman, J. M., Ganeshalingam, M., Li, W., & Filippenko, A. V. 2012a, Mon. Not. R. Astron. Soc., 425, 1889
- Silverman et al. (2011) Silverman, J. M., Ganeshalingam, M., Li, W., Filippenko, A. V., Miller, A. A., & Poznanski, D. 2011, Mon. Not. R. Astron. Soc., 410, 585
- Silverman et al. (2012b) Silverman, J. M., Kong, J. J., & Filippenko, A. V. 2012b, Mon. Not. R. Astron. Soc., 425, 1819
- Silverman et al. (2012c) Silverman, J. M., et al. 2012c, Mon. Not. R. Astron. Soc., 425, 1789
- Silverman et al. (2012d) —. 2012d, Astrophys. J. Lett., 756, L7
- Silverman et al. (2013b) —. 2013b, Astrophys. J., 772, 125
- Silverman et al. (2013c) —. 2013c, Mon. Not. R. Astron. Soc.
- Silverman et al. (2013d) —. 2013d, Astrophys. J. Suppl. Ser., 207, 3
- Sim et al. (2012) Sim, S. A., Fink, M., Kromer, M., Röpke, F. K., Ruiter, A. J., & Hillebrandt, W. 2012, Mon. Not. R. Astron. Soc., 420, 3003
- Sim et al. (2010a) Sim, S. A., Kromer, M., Röpke, F. K., Sorokina, E. I., Blinnikov, S. I., Kasen, D., & Hillebrandt, W. 2010a, in Astronomical Society of the Pacific Conference Series, Vol. 429, Numerical Modeling of Space Plasma Flows, Astronum-2009, ed. N. V. Pogorelov, E. Audit, & G. P. Zank, 148
- Sim et al. (2010b) Sim, S. A., Röpke, F. K., Hillebrandt, W., Kromer, M., Pakmor, R., Fink, M., Ruiter, A. J., & Seitenzahl, I. R. 2010b, Astrophys. J. Lett., 714, L52
- Sim et al. (2013) Sim, S. A., et al. 2013, Mon. Not. R. Astron. Soc., 436, 333
- Simon et al. (2007) Simon, J. D., et al. 2007, Astrophys. J. Lett., 671, L25
- Simon et al. (2009) —. 2009, Astrophys. J., 702, 1157
- Smith et al. (2011) Smith, P. S., Williams, G. G., Smith, N., Milne, P. A., Jannuzi, B. T., & Green, E. M. 2011, ArXiv e-prints
- Soderberg (2009) Soderberg, A. 2009, The Astronomer’s Telegram, 1948, 1
- Soderberg et al. (2008) Soderberg, A. M., et al. 2008, Nature, 453, 469
- Soker et al. (2013) Soker, N., Garcia-Berro, E., & Althaus, L. G. 2013, ArXiv e-prints
- Sokoloski et al. (2006) Sokoloski, J. L., Luna, G. J. M., Mukai, K., & Kenyon, S. J. 2006, Nature, 442, 276
- Sollerman et al. (2004) Sollerman, J., et al. 2004, Astron. Astrophys., 428, 555
- Stanishev et al. (2007) Stanishev, V., et al. 2007, Astron. Astrophys., 469, 645
- Stehle et al. (2005) Stehle, M., Mazzali, P. A., Benetti, S., & Hillebrandt, W. 2005, Mon. Not. R. Astron. Soc., 360, 1231
- Steinmetz et al. (1992) Steinmetz, M., Muller, E., & Hillebrandt, W. 1992, Astron. Astrophys., 254, 177
- Sternberg et al. (2011) Sternberg, A., et al. 2011, Science, 333, 856
- Stockdale et al. (2006) Stockdale, C. J., Kelley, M., Sramek, R. A., van Dyk, S. D., Immler, S., Weiler, K. W., Williams, C. L. M., & Panagia, N. 2006, The Astronomer’s Telegram, 729, 1
- Stritzinger & Leibundgut (2005) Stritzinger, M., & Leibundgut, B. 2005, Astron. Astrophys., 431, 423
- Stritzinger et al. (2002) Stritzinger, M., et al. 2002, Astron. J., 124, 2100
- Stritzinger et al. (2013) Stritzinger, M. D., et al. 2013, ArXiv e-prints
- Strolger et al. (2010) Strolger, L.-G., Dahlen, T., & Riess, A. G. 2010, Astrophys. J., 713, 32
- Strolger et al. (2002) Strolger, L.-G., et al. 2002, Astron. J., 124, 2905
- Sullivan et al. (2006) Sullivan, M., et al. 2006, Astrophys. J., 648, 868
- Sullivan et al. (2010) —. 2010, Mon. Not. R. Astron. Soc., 406, 782
- Sullivan et al. (2011a) —. 2011a, Astrophys. J., 737, 102
- Sullivan et al. (2011b) —. 2011b, Astrophys. J., 732, 118
- Suzuki et al. (2012) Suzuki, N., et al. 2012, Astrophys. J., 746, 85
- Swift et al. (2001) Swift, B., Li, W. D., & Schwartz, M. 2001, IAU Circ., 7611, 1
- Taddia et al. (2012) Taddia, F., et al. 2012, Astron. Astrophys., 545, L7
- Takaki et al. (2013) Takaki, K., et al. 2013, Astrophys. J. Lett., 772, L17
- Tanaka et al. (2006) Tanaka, M., Mazzali, P. A., Maeda, K., & Nomoto, K. 2006, Astrophys. J., 645, 470
- Tanaka et al. (2011) Tanaka, M., Mazzali, P. A., Stanishev, V., Maurer, I., Kerzendorf, W. E., & Nomoto, K. 2011, Mon. Not. R. Astron. Soc., 410, 1725
- Tanaka et al. (2008) Tanaka, M., et al. 2008, Astrophys. J., 677, 448
- Tanaka et al. (2010) —. 2010, Astrophys. J., 714, 1209
- Taubenberger et al. (2008) Taubenberger, S., et al. 2008, Mon. Not. R. Astron. Soc., 385, 75
- Taubenberger et al. (2011) —. 2011, Mon. Not. R. Astron. Soc., 412, 2735
- Taubenberger et al. (2013) —. 2013, Mon. Not. R. Astron. Soc., 432, 3117
- Tauris et al. (2013) Tauris, T. M., Sanyal, D., Yoon, S.-C., & Langer, N. 2013, Astron. Astrophys., 558, A39
- Thomas et al. (2004) Thomas, R. C., Branch, D., Baron, E., Nomoto, K., Li, W., & Filippenko, A. V. 2004, Astrophys. J., 601, 1019
- Thomas et al. (2002) Thomas, R. C., Kasen, D., Branch, D., & Baron, E. 2002, Astrophys. J., 567, 1037
- Thomas et al. (2011a) Thomas, R. C., Nugent, P. E., & Meza, J. C. 2011a, Publ. Astron. Soc. Pac., 123, 237
- Thomas et al. (2007) Thomas, R. C., et al. 2007, Astrophys. J. Lett., 654, L53
- Thomas et al. (2011b) —. 2011b, Astrophys. J., 743, 27
- Thompson (2011) Thompson, T. A. 2011, Astrophys. J., 741, 82
- Thrasher et al. (2008) Thrasher, P., Li, W., & Filippenko, A. V. 2008, Central Bureau Electronic Telegrams, 1211, 1
- Timmes et al. (2003) Timmes, F. X., Brown, E. F., & Truran, J. W. 2003, Astrophys. J. Lett., 590, L83
- Timmes & Woosley (1992) Timmes, F. X., & Woosley, S. E. 1992, Astrophys. J., 396, 649
- Toonen et al. (2012) Toonen, S., Nelemans, G., & Portegies Zwart, S. 2012, Astron. Astrophys., 546, A70
- Tornambé & Piersanti (2013) Tornambé, A., & Piersanti, L. 2013, Mon. Not. R. Astron. Soc., 431, 1812
- Tripp (1998) Tripp, R. 1998, Astron. Astrophys., 331, 815
- Tripp & Branch (1999) Tripp, R., & Branch, D. 1999, Astrophys. J., 525, 209
- Tsvetkov et al. (2011) Tsvetkov, D. Y., et al. 2011, Astronomy Letters, 37, 775
- Turatto et al. (1996) Turatto, M., Benetti, S., Cappellaro, E., Danziger, I. J., Della Valle, M., Gouiffes, C., Mazzali, P. A., & Patat, F. 1996, Mon. Not. R. Astron. Soc., 283, 1
- Turatto et al. (1997) Turatto, M., Benetti, S., Pereira, C., & da Silva, L. 1997, IAU Circ., 6667, 1
- Turatto et al. (1998) Turatto, M., Piemonte, A., Benetti, S., Cappellaro, E., Mazzali, P. A., Danziger, I. J., & Patat, F. 1998, Astron. J., 116, 2431
- Umeda et al. (1999a) Umeda, H., Nomoto, K., Kobayashi, C., Hachisu, I., & Kato, M. 1999a, Astrophys. J. Lett., 522, L43
- Umeda et al. (1999b) Umeda, H., Nomoto, K., Yamaoka, H., & Wanajo, S. 1999b, Astrophys. J., 513, 861
- Vacca & Leibundgut (1996) Vacca, W. D., & Leibundgut, B. 1996, Astrophys. J. Lett., 471, L37
- Valentini et al. (2003) Valentini, G., et al. 2003, Astrophys. J., 595, 779
- van den Bergh et al. (2005) van den Bergh, S., Li, W., & Filippenko, A. V. 2005, Publ. Astron. Soc. Pac., 117, 773
- van Kerkwijk et al. (2010) van Kerkwijk, M. H., Chang, P., & Justham, S. 2010, Astrophys. J. Lett., 722, L157
- Vennes (1999) Vennes, S. 1999, Astrophys. J., 525, 995
- Vinkó et al. (2001) Vinkó, J., Kiss, L. L., Csák, B., Fűrész, G., Szabó, R., Thomson, J. R., & Mochnacki, S. W. 2001, Astron. J., 121, 3127
- Vinkó et al. (2003) Vinkó, J., et al. 2003, Astron. Astrophys., 397, 115
- Vinkó et al. (2012) —. 2012, Astron. Astrophys., 546, A12
- Voss & Nelemans (2008) Voss, R., & Nelemans, G. 2008, Nature, 451, 802
- Walter & Strohmeier (1937) Walter, K., & Strohmeier, W. 1937, Astronomische Nachrichten, 263, 399
- Wang & Han (2012) Wang, B., & Han, Z. 2012, New Astron. Rev., 56, 122
- Wang et al. (2013a) Wang, B., Justham, S., & Han, Z. 2013a, ArXiv e-prints
- Wang et al. (2006) Wang, L., Baade, D., Höflich, P., Wheeler, J. C., Kawabata, K., Khokhlov, A., Nomoto, K., & Patat, F. 2006, Astrophys. J., 653, 490
- Wang et al. (2004) Wang, L., Baade, D., Höflich, P., Wheeler, J. C., Kawabata, K., & Nomoto, K. 2004, Astrophys. J. Lett., 604, L53
- Wang et al. (2007) Wang, L., Baade, D., & Patat, F. 2007, Science, 315, 212
- Wang & Wheeler (2008) Wang, L., & Wheeler, J. C. 2008, Annu. Rev. Astron. Astrophys., 46, 433
- Wang et al. (2003) Wang, L., et al. 2003, Astrophys. J., 591, 1110
- Wang et al. (2013b) Wang, S., Geng, J.-J., Hu, Y.-L., & Zhang, X. 2013b, ArXiv e-prints
- Wang et al. (2008a) Wang, X., Li, W., Filippenko, A. V., Foley, R. J., Smith, N., & Wang, L. 2008a, Astrophys. J., 677, 1060
- Wang et al. (2013c) Wang, X., Wang, L., Filippenko, A. V., Zhang, T., & Zhao, X. 2013c, Science, 340, 170
- Wang et al. (2008b) Wang, X., et al. 2008b, Astrophys. J., 675, 626
- Wang et al. (2009a) —. 2009a, Astrophys. J. Lett., 699, L139
- Wang et al. (2009b) —. 2009b, Astrophys. J., 697, 380
- Wang et al. (2012) —. 2012, Astrophys. J., 749, 126
- Webbink (1984) Webbink, R. F. 1984, Astrophys. J., 277, 355
- Wellmann (1955) Wellmann, P. 1955, Z. Astrophys., 35, 205
- Wells et al. (1994) Wells, L. A., et al. 1994, Astron. J., 108, 2233
- Wheeler (2012) Wheeler, J. C. 2012, Astrophys. J., 758, 123
- Wheeler et al. (1995) Wheeler, J. C., Harkness, R. P., Khokhlov, A. M., & Höflich, P. 1995, Phys. Rep., 256, 211
- Wheeler et al. (1998) Wheeler, J. C., Höflich, P., Harkness, R. P., & Spyromilio, J. 1998, Astrophys. J., 496, 908
- Whelan & Iben (1973) Whelan, J., & Iben, Jr., I. 1973, Astrophys. J., 186, 1007
- Wood-Vasey et al. (2002a) Wood-Vasey, W. M., Aldering, G., & Nugent, P. 2002a, IAU Circ., 8019, 2
- Wood-Vasey et al. (2002b) Wood-Vasey, W. M., Aldering, G., Nugent, P., Helin, E. F., Pravdo, S., Hicks, M., & Lawrence, K. 2002b, IAU Circ., 7902, 3
- Wood-Vasey et al. (2002c) Wood-Vasey, W. M., Li, W. D., Swift, B., & Ganeshalingam, M. 2002c, IAU Circ., 7959, 1
- Wood-Vasey et al. (2004) Wood-Vasey, W. M., Wang, L., & Aldering, G. 2004, Astrophys. J., 616, 339
- Wood-Vasey et al. (2008) Wood-Vasey, W. M., et al. 2008, Astrophys. J., 689, 377
- Woods et al. (2011) Woods, T. E., Ivanova, N., van der Sluys, M., & Chaichenets, S. 2011, in Astronomical Society of the Pacific Conference Series, Vol. 447, Evolution of Compact Binaries, ed. L. Schmidtobreick, M. R. Schreiber, & C. Tappert, 127
- Woosley et al. (2007) Woosley, S. E., Kasen, D., Blinnikov, S., & Sorokina, E. 2007, Astrophys. J., 662, 487
- Yamanaka et al. (2009a) Yamanaka, M., et al. 2009a, Astrophys. J. Lett., 707, L118
- Yamanaka et al. (2009b) —. 2009b, Publ. Astron. Soc. Jpn., 61, 713
- Yamanaka et al. (2013) Yamanaka, M., et al. 2013, in IAU Symposium, Vol. 281, IAU Symposium, 319–321
- Yamaoka et al. (1992) Yamaoka, H., Nomoto, K., Shigeyama, T., & Thielemann, F.-K. 1992, Astrophys. J. Lett., 393, L55
- Yaron & Gal-Yam (2012) Yaron, O., & Gal-Yam, A. 2012, Publ. Astron. Soc. Pac., 124, 668
- Yoon & Langer (2004) Yoon, S.-C., & Langer, N. 2004, Astron. Astrophys., 419, 623
- Yoon & Langer (2005) —. 2005, Astron. Astrophys., 435, 967
- Yu et al. (2000) Yu, C., Modjaz, M., & Li, W. D. 2000, IAU Circ., 7458, 1
- Yuan et al. (2010) Yuan, F., et al. 2010, Astrophys. J., 715, 1338
- Yungelson & Livio (2000) Yungelson, L. R., & Livio, M. 2000, Astrophys. J., 528, 108
- Zhang (2011) Zhang, T.-M. 2011, Publ. Astron. Soc. Pac., 123, 251
- Zheng et al. (2013) Zheng, W., et al. 2013, Astrophys. J. Lett., 778, L15
- Zingale et al. (2011) Zingale, M., Nonaka, A., Almgren, A. S., Bell, J. B., Malone, C. M., & Woosley, S. E. 2011, Astrophys. J., 740, 8
- Zwicky (1936) Zwicky, F. 1936, Proceedings of the National Academy of Science, 22, 557
- Zwicky (1942) —. 1942, Astrophys. J., 96, 28
- Zwicky (1961) —. 1961, Publ. Astron. Soc. Pac., 73, 185