Circumstellar disks around binary stars in Taurus
Abstract
We have conducted a survey of 17 wide ( 100 AU) young binary systems in Taurus with the Atacama Large Millimeter Array (ALMA) at two wavelengths. The observations were designed to measure the masses of circumstellar disks in these systems as an aid to understanding the role of multiplicity in star and planet formation. The ALMA observations had sufficient resolution to localize emission within the binary system. Disk emission was detected around all primaries and ten secondaries, with disk masses as low as 10-4 M⊙. We compare the properties of our sample to the population of known disks in Taurus and find that the disks from this binary sample match the scaling between stellar mass and millimeter flux of F M to within the scatter found in previous studies. We also compare the properties of the primaries to those of the secondaries and find that the secondary/primary stellar and disk mass ratios are not correlated; in three systems, the circumsecondary disk is more massive than the circumprimary disk, counter to some theoretical predictions.
Subject headings:
binaries: general, protoplanetary disks, stars:formation1. Introduction
Most stars are formed in binary or multiple systems and remain in such systems for their main sequence lifetimes (e.g. Monin et al., 2007). Therefore, understanding the causes and effects of multiplicity is an essential ingredient of complete models of both star and planet formation. Circumstellar disks play a crucial role in both processes, tracing effects of different binary formation mechanisms, providing conduits for material to accrete onto the stars, and serving as the reservoir of raw material for planet formation.
At a given point in time, the distribution of observed disk masses is a function of the initial disk masses and disk evolution. For multiple systems, dynamical interactions between the stars, the circumstellar disks, and any circumbinary material will also impact both the disk formation and evolution. Models of binary star formation by Bate (2000) predict that the circumprimary disk, i.e. the disk around the more massive star, will have more mass than the circumsecondary disk; however, these models do not follow the viscous evolution of the disk after the formation stage. Observations to date largely support the prediction of a more massive circumprimary disk, although the sample of systems observed is relatively small and generally comprise only the brightest sources. Jensen & Akeson (2003) found that the primary star had the most massive disk in all four young binaries they observed; indeed in only one system was the secondary’s disk detected at all, despite most of the secondaries showing signs of accretion. More recent work by Harris et al. (2012) has expanded the number of observed binary systems and also found that when both components were detected, the primary had higher flux, but with sensitivity levels of a few mJy, many secondaries remained undetected.
Planet formation in these systems may also be impacted as models of the interactions of binary stars with their associated disks predict that the disks will be truncated somewhere between 0.2 and 0.5 times the binary separation, depending on the eccentricity of the system (Artymowicz & Lubow, 1996). However, these models do not address the surface density and evolution of the remaining disk material. If the secondary disks retain roughly the same surface density as the inner parts of disks around single stars, then they may still retain enough mass to form planets. Previous observations have not had the sensitivity to distinguish between disks that are simply truncated, and those that have been significantly depleted by further accretion. Disk models show that truncation effects can affect the observed flux for separations up to a few hundred AU (Jensen et al., 1996).
The essential question for planet formation, then, is whether or not the disks around individual components of close binary stars are similar to the inner regions of disks around single stars. Early observations demonstrated that the unresolved millimeter emission, which traces the dust in the outer regions of the disk, is indeed reduced, consistent with truncation (Beckwith et al., 1990; Osterloh & Beckwith, 1995; Jensen et al., 1996). But most observations of binaries with separations in the ranges of 50-100 AU have yielded upper limits rather than detections, and indeed only about half of all young binaries in Taurus have been detected at all at millimeter wavelengths, despite the fact that many more than half of them were detected by IRAS at 60 m. With the advent of ALMA observations, which provide a substantial increase in sensitivity at the required resolution, it is now possible to reach much lower disk surface densities, and possibly to detect very low mass protoplanetary disks.
To address these issues, we have obtained ALMA Cycle 0 observations of 17 young binary systems in Taurus for which the components can be resolved. In §2 we describe the sample selection and properties, in §3 we describe the ALMA observations and data reduction, in §4 we present the results, and we give our conclusions in §5.
| Source Name | Additional names | Separation | mm fluxaaMillimeter fluxes are single-dish fluxes at 850 m taken from Andrews & Williams (2005) except for HK Tau (Harris et al., 2012, 850 m, interferometry) and IRAS 04113+2758 (Harris et al., 2012, 1.3 mm, interferometry) | Spectral typesbbSpectral types from Andrews et al. (2013) | Previous mm |
|---|---|---|---|---|---|
| (AU) | (mJy) | detectioncc1 = primary, 2 = secondary | |||
| FV Tau | 101 | 485 | K5/K6 | 1,2 | |
| HBC 387 | FV Tau/c | 104 | 25 | M2.5/M3.5 | – |
| FQ Tau | 110 | 287 | M3/M3.5 | 1 | |
| UY Aur | 120 | 1026 | M0/M2.5 | 1,2 | |
| FX Tau | 130 | 173 | M1/M4 | 1 | |
| HBC 411 | CoKu Tau/3 | 290 | 8 | M1/M4.5 | – |
| IRAS 05022+2527 | CIDA 9 | 320 | 717 | K8/M1.5 | 1 |
| HK Tau | 340 | 1302 | M0.5/M2 | 1,2 | |
| IT Tau | 340 | 223 | K3/M4 | 1,2 | |
| DK Tau | 350 | 8010 | K8/M1 | 1 | |
| GK Tau | 340 | 337 | K7 | 1 | |
| HN Tau | 430 | 293 | K5/M4 | 1 | |
| V710 Tau | 450 | 1526 | M0.5 | 1 | |
| IRAS 04113+2758 | MHO 1/2 | 550 | 3803 | M2.5/M2.5 | 1,2 |
| IRAS 04298+2246 | JH 112 | 920 | 3010 | K6/M8.5 | 1 |
| HO Tau | 970 | 446 | M0.5 | 1 | |
| DS Tau | 990 | 394 | K5 | 1 |
2. Sample
We selected targets from a single star formation region, Taurus (distance 140 pc), so that effects such as age and cluster environment are kept constant as much as possible. Taurus is ideal in having a significant population of YSOs that have evolved into the disk-only state (with no remaining envelope) and is very well studied, containing both a well known set of single stars with disks for comparison and a significant population of binaries where both stellar components have been characterized in the optical or near-infrared. We started with the list of known Taurus binaries (Andrews & Williams, 2005; Kraus & Hillenbrand, 2009) and selected those with separations in the range of 07 (100 AU) to 10″ (1400 AU). The inner cutoff was selected such that the two components could be clearly resolved with the resolution offered in Cycle 0, while the outer cutoff was chosen to ensure that the systems are likely to be physically associated. We eliminated systems classified as Class I from their spectral energy distributions, as these systems often contain substantial envelope emission that must be disentangled from the disk emission, and we eliminated systems with no active accretion signatures that had not been previously detected at millimeter wavelengths. The resulting sample contains 17 systems (Table 1) and includes all Class II Taurus binaries with separations of 100 to 1400 AU from Andrews & Williams (2005) and Kraus & Hillenbrand (2009). Higher-order multiple systems were excluded where known at the time of our sample selection, although two were observed (see notes in §4.1).
3. Observations
The observations dates and ALMA data set names are given in Table 2. The correlator was configured with each of the four basebands covering a total bandwidth of 1.875 GHz with a channel spacing of 488 kHz. At 1.3 mm (Band 6), one of the correlator basebands was set to cover the CO(2-1) transition at 230.5 GHz, while at 850 m (Band 7), one baseband covered CO(3-2) at 345.8 GHz. Each target source was observed only once per band and was bracketed by observations of the gain calibrator, J051002+180041. Data for each band were calibrated separately using the CASA package and scripts provided by the NRAO ALMA center. The system temperature, water vapor phase corrections, and flagging were applied using the standard scripts. The amplitude and phase of the passband were calibrated against J0423-013. The absolute flux calibration used Callisto and the Butler-JPL-Horizons 2012 flux models, which resulted in a zero spacing flux of 8.54 Jy at 1.3 mm and 19.45 Jy at 850 m. The data taken in April 2012 at 1.3 mm showed a much lower gain stability than the other 1.3 mm data sets and are not used here.
| ALMA band/ | Data set | Observation | Sources |
|---|---|---|---|
| wavelength | Date (UT) | ||
| Band 7/ | 2011.0.00150.S_2012-12-05 | 11/16/2012 | FV Tau, HBC 387, FQ Tau, FX Tau, HK Tau, DK Tau, IRAS 04113+2758 |
| 850 m | 2011.0.00150.S_2012-12-06 | 11/16/2012 | HBC 411, IT Tau, GK Tau, HN Tau, V710 Tau, IRAS 04298+2246, HO Tau |
| 2011.0.00150.S_2012-12-07 | 11/16/2012 | UY Aur, IRAS 05022+2527, DS Tau | |
| Band 6/ | 2011.0.00150.S_2012-12-12 | 11/17/2012 | HBC 411, IT Tau, GK Tau, HN Tau, V710 Tau, IRAS 04298+2246, HO Tau |
| 1.3 mm | 2011.0.00150.S_2012-12-19 | 11/17/2012 | FV Tau, HBC 387, FQ Tau, FX Tau, HK Tau, DK Tau, IRAS 04113+2758 |
| 2011.0.00150.S_2012-12-20 | 11/17/2012 | UY Aur, IRAS 05022+2527, DS Tau | |
| 2011.0.00150.S_2013-01-26 | 4/22/2012 | FV Tau, HBC 387, FQ Tau, FX Tau, HBC 411 |
Continuum and CO images at each band were generated using the clean task within CASA, with a robust beam weighting of 0.5. Each data set had at least one target with sufficient continuum flux to allow phase-only self-calibration, which was applied after the other calibrations. For the 2012-12-05 and 2012-12-19 data sets, the self-calibration reference source was IRAS 04113+2758, except for HK Tau and DK Tau, which were used as their own reference. For the 2012-12-06 and 2012-12-12 data sets, the self-calibration reference source was V710 Tau and for 2012-12-07 and 2012-12-20, each source was used as its own self-calibration reference. Given the short time on source (60 sec at 1.3 mm and 90 sec at 850 m), the continuum data were time-averaged to a single point when calculating the self-calibration corrections. After the phase self-calibration was applied, images were generated interactively with 50 iterations per cycle and clean boxes placed only around emission visible in the dirty map. The cycles were stopped when the residuals in the clean boxes were at or below the rms in the rest of the image. Most sources required 2 cycles, while the brightest sources required 3 or 4. The primary beam correction was applied and the entire primary beam was mapped for each source; no continuum emission was detected away from the known source positions. FV Tau and HBC 387 (FV Tau/c) are separated by 12″, but were observed in two separate pointings. As HBC 387 was only marginally detected in its single pointing, we combined the two observations in a mosaic, increasing the sensitivity.
The 850 m continuum maps are shown in Figure 1. The images use the default restoring beam, which is a Gaussian fit to the dirty beam. These beam sizes are listed in Table 3. In every system, the primary component has been detected. The two wide components of IRAS 04298+2246 (JH 112) are each resolved into two close components and we treat this system as two separate binaries in §4. For systems where the secondary is not detected, its position is marked with a plus. The typical rms values achieved are 0.15-0.20 mJy/beam at 1.3 mm and 0.35-0.40 mJy/beam at 850 m, significantly more sensitive than previous surveys in Taurus. The images of the brightest source, IRAS 04113+2758, are dynamic range limited and have higher rms levels.

Examination of the CO images show that CO is detected for all sources except HBC 387 (CoKu Tau/3), FQ Tau, and IRAS 04298+2246. As seen in Table 3, these are the three weakest sources in continuum emission. In the detected sources, the integrated CO emission is not correlated with continuum flux but we also note that the cloud contamination varies considerably from source to source.
4. Results
The observational design of this program was to detect emission from circumstellar disks but not to characterize the physical parameters of the disks. Fitting detailed disk models to determine temperature, density, and other physical parameters is best done in the uv-plane (see the discussion in Dutrey et al., 2007). As our goal was to compare overall properties of the disks (flux and mass) and because CASA does not currently allow multiple component fitting in the uv-plane, we fit these data in the image plane to determine the total flux and size. The clean continuum maps at each band were fit with two-dimensional Gaussians for each source using the CASA routine imfit. The fitting results are presented in Tables 3 and 4. The positions and binary separations were measured from the 850 m images before self-calibration while the total flux and deconvolved size were determined from fits to the self-calibrated maps. If the uncertainty on the major axis was larger than the fit size, we list that object as a point source. For the resolved disks, we include the position angle from the Gaussian fit and the derived inclination angle. Upper limits given on the flux are 3.
| Source | Peak flux | Beam size | Total flux | Deconvolved size | Position angle | Inclination | |
|---|---|---|---|---|---|---|---|
| (mJy) | (mJy) | (arcsec) | (mJy) | (mas) | (deg) | (deg) | |
| 1.3 mm | |||||||
| FV Tau A | 7.0 | 0.15 | 1.12x0.74 | 6.170.16 | point source | — | — |
| FV Tau B | 6.0 | 0.15 | 1.12x0.74 | 5.930.18 | point source | — | — |
| HBC 387 A | 0.5 | 0.12 | 1.10x0.73 | 0.760.17 | point source | — | — |
| HBC 387 B | 0.5 | 0.12 | 1.10x0.73 | 0.400.07 | point source | — | — |
| FQ Tau A | 2.7 | 0.15 | 1.14x0.72 | 3.100.21 | point source | — | — |
| FQ Tau B | 2.5 | 0.15 | 1.14x0.72 | 1.630.13 | point source | — | — |
| FX Tau A | 7.1 | 0.15 | 1.05x0.73 | 7.030.15 | point source | — | — |
| FX Tau B | 0.45 | 0.15 | 1.05x0.73 | not detected | — | — | — |
| HK Tau A | 33.0 | 0.15 | 1.06x0.73 | 33.800.20 | point source | — | — |
| HK Tau B | 12.6 | 0.15 | 1.06x0.73 | 16.010.24 | point source | — | — |
| DK Tau A | 29.7 | 0.14 | 1.09x0.72 | 30.300.18 | point source | — | — |
| DK Tau B | 2.7 | 0.14 | 1.09x0.72 | 2.880.19 | 365 46 x 120 70 | 26.6 1.2 | 7013 |
| IRAS 04113+2758 A | 179.0 | 0.54 | 1.15x0.73 | 216.740.76 | 403 8 x 397 8 | 175.0 94.0 | 10 2 |
| IRAS 04113+2758 B | 106.0 | 0.54 | 1.15x0.73 | 133.340.79 | 472 14 x 384 17 | 126.4 8.5 | 35 3 |
| UY Aur A | 19.9 | 0.20 | 1.24x0.74 | 20.830.23 | 336 33 x 184 73 | 177.0 11.0 | 5616 |
| UY Aur B | 8.4 | 0.20 | 1.24x0.74 | 7.870.25 | point source | — | — |
| IRAS 05022+2527 A | 28.7 | 0.19 | 1.09x0.76 | 35.220.26 | 473 16 x 324 23 | 106.1 6.4 | 46 4 |
| IRAS 05022+2527 B | 0.57 | 0.19 | 1.09x0.76 | not detected | — | — | — |
| DS Tau A | 17.1 | 0.18 | 1.21x0.76 | 19.940.25 | 581 23 x 203 76 | 154.1 3.0 | 69 8 |
| DS Tau B | 0.54 | 0.18 | 1.21x0.76 | not detected | — | — | — |
| HBC 411 A | 1.8 | 0.27 | 1.23x0.74 | 1.840.30 | point source | — | — |
| HBC 411 B | 5.8 | 0.27 | 1.23x0.74 | 5.790.29 | point source | — | — |
| IT Tau A | 7.1 | 0.21 | 1.26x0.74 | 7.000.24 | point source | — | — |
| IT Tau B | 4.0 | 0.21 | 1.26x0.74 | 4.170.27 | point source | — | — |
| GK Tau A | 5.2 | 0.22 | 1.20x0.74 | 5.330.56 | 205 77 x 58126 | 93.1 3.7 | 7359 |
| GK Tau B | 0.66 | 0.22 | 1.20x0.74 | not detected | — | — | — |
| HN Tau A | 12.8 | 0.20 | 1.05x0.74 | 13.460.26 | point source | — | — |
| HN Tau B | 0.60 | 0.20 | 1.05x0.74 | not detected | — | — | — |
| V710 Tau A | 52.4 | 0.21 | 1.06x0.74 | 59.180.33 | 343 16 x 264 22 | 77.0 12.0 | 39 5 |
| V710 Tau B | 0.63 | 0.21 | 1.06x0.74 | not detected | — | — | — |
| IRAS 04298+2246 Aa | 3.7 | 0.19 | 1.14x0.75 | 3.530.23 | point source | — | — |
| IRAS 04298+2246 Ab | 3.1 | 0.19 | 1.14x0.75 | 3.060.24 | point source | — | — |
| IRAS 04298+2246 Ba | 0.4 | 0.19 | 1.14x0.75 | 0.250.08 | point source | — | — |
| IRAS 04298+2246 Bb | 1.6 | 0.19 | 1.14x0.75 | 2.300.24 | 655210 x 464438 | 124.0 71.0 | 44115 |
| HO Tau A | 16.2 | 0.21 | 1.13x0.75 | 17.060.27 | point source | — | — |
| HO Tau B | 0.63 | 0.21 | 1.13x0.75 | not detected | — | — | — |
| 850 m | |||||||
| FV Tau A | 14.4 | 0.53 | 0.73x0.50 | 13.760.52 | point source | — | — |
| FV Tau B | 11.8 | 0.53 | 0.73x0.50 | 12.100.56 | point source | — | — |
| HBC 387 A | 1.3 | 0.31 | 0.72x0.50 | 1.380.40 | point source | — | — |
| HBC 387 B | 1.2 | 0.31 | 0.72x0.50 | 0.940.40 | point source | — | — |
| FQ Tau A | 5.3 | 0.42 | 0.76x0.50 | 5.420.48 | point source | — | — |
| FQ Tau B | 4.3 | 0.42 | 0.76x0.50 | 4.240.47 | point source | — | — |
| FX Tau A | 14.7 | 0.49 | 0.70x0.50 | 15.650.54 | point source | — | — |
| FX Tau B | 1.47 | 0.49 | 0.70x0.50 | not detected | — | — | — |
| HK Tau A | 79.3 | 0.40 | 0.69x0.51 | 73.601.30 | 188 35 x 130 62 | 11.0 85.0 | 4629 |
| HK Tau B | 41.1 | 0.40 | 0.69x0.51 | 56.501.80 | point source | — | — |
| DK Tau A | 70.1 | 0.40 | 0.71x0.50 | 67.250.47 | 165 15 x 123 22 | 15.0 18.0 | 4111 |
| DK Tau B | 6.5 | 0.40 | 0.71x0.50 | 5.810.45 | point source | — | — |
| IRAS 04113+2758 A | 317.0 | 1.95 | 0.72x0.50 | 476.703.20 | 409 7 x 397 7 | 112.0 48.0 | 13 2 |
| IRAS 04113+2758 B | 185.0 | 1.95 | 0.72x0.50 | 295.203.30 | 488 12 x 344 16 | 117.2 4.7 | 45 2 |
| UY Aur A | 43.7 | 0.37 | 0.75x0.49 | 48.400.66 | 270 21 x 170 36 | 176.5 9.2 | 5010 |
| UY Aur B | 15.7 | 0.37 | 0.75x0.49 | 18.270.72 | 366 49 x 228 91 | 174.0 26.0 | 5120 |
| IRAS 05022+2527 A | 50.1 | 0.33 | 0.69x0.50 | 74.402.00 | 481 28 x 352 32 | 99.9 6.9 | 42 6 |
| IRAS 05022+2527 B | 0.99 | 0.33 | 0.69x0.50 | not detected | — | — | — |
| DS Tau A | 32.3 | 0.39 | 0.73x0.50 | 41.301.80 | 614 37 x 251 95 | 164.6 4.3 | 6510 |
| DS Tau B | 1.17 | 0.39 | 0.73x0.50 | not detected | — | — | — |
| HBC 411 A | 3.0 | 0.44 | 0.93x0.47 | 3.320.55 | point source | — | — |
| HBC 411 B | 13.2 | 0.44 | 0.93x0.47 | 14.290.56 | point source | — | — |
| IT Tau A | 15.2 | 0.44 | 0.94x0.47 | 15.820.56 | 120 17 x 88 33 | 105.8 1.8 | 4223 |
| IT Tau B | 9.2 | 0.44 | 0.94x0.47 | 8.790.52 | point source | — | — |
| GK Tau A | 13.1 | 0.41 | 0.89x0.47 | 14.720.60 | point source | — | — |
| GK Tau B | 1.23 | 0.41 | 0.89x0.47 | not detected | — | — | — |
| HN Tau A | 31.3 | 0.47 | 0.77x0.47 | 34.320.60 | 225 41 x 136113 | 65.0154.0 | 5244 |
| HN Tau B | 1.41 | 0.47 | 0.77x0.47 | not detected | — | — | — |
| V710 Tau A | 109.0 | 0.49 | 0.76x0.48 | 143.500.79 | 368 8 x 262 11 | 81.7 4.1 | 44 2 |
| V710 Tau B | 1.47 | 0.49 | 0.76x0.48 | not detected | — | — | — |
| IRAS 04298+2246 Aa | 8.7 | 0.41 | 0.82x0.48 | 8.850.49 | point source | — | — |
| IRAS 04298+2246 Ab | 6.5 | 0.41 | 0.82x0.48 | 7.750.61 | point source | — | — |
| IRAS 04298+2246 Ba | 2.2 | 0.41 | 0.82x0.48 | 3.101.90 | point source | — | — |
| IRAS 04298+2246 Bb | 2.8 | 0.41 | 0.82x0.48 | 3.530.60 | point source | — | — |
| HO Tau A | 33.1 | 0.45 | 0.80x0.47 | 36.501.10 | point source | — | — |
| HO Tau B | 1.35 | 0.45 | 0.80x0.47 | not detected | — | — | — |
| Binary System | Primary RA | Primary dec | Secondary RA | Secondary dec | Separation | Position angle |
|---|---|---|---|---|---|---|
| (J2000) | (J2000) | (J2000) | (J2000) | (arcsec) | (deg) | |
| FV Tau | 4:26:53.550 0.019 | 26:06:53.903 0.025 | 4:26:53.498 0.021 | 26:06:53.956 0.027 | 0.696 0.046 | 274.4 3.0 |
| HBC 387 (FV Tau/c) | 4:26:54.142 0.070 | 26:06:51.947 0.096 | 4:26:54.070 0.104 | 26:06:51.504 0.143 | 1.534 0.303 | 245.5 8.7 |
| FQ Tau | 4:19:12.807 0.045 | 28:29:32.512 0.065 | 4:19:12.853 0.042 | 28:29:32.819 0.062 | 0.682 0.109 | 63.1 7.1 |
| FX Tau | 4:30:29.659 0.015 | 24:26:44.667 0.019 | — | — | — | — |
| HK Tau | 4:31:50.580 0.011 | 24:24:17.378 0.014 | 4:31:50.610 0.019 | 24:24:15.065 0.025 | 2.349 0.036 | 170.1 0.5 |
| DK Tau | 4:30:44.252 0.010 | 26:01:24.506 0.014 | 4:30:44.407 0.019 | 26:01:23.363 0.027 | 3.404 0.047 | 118.3 0.6 |
| IRAS 04113+2758 | 4:14:26.411 0.031 | 28:05:59.377 0.045 | 4:14:26.276 0.018 | 28:06:02.967 0.026 | 4.010 0.063 | 333.5 0.6 |
| HBC 411 | 4:35:40.954 0.097 | 24:11:08.589 0.108 | 4:35:40.975 0.021 | 24:11:06.578 0.024 | 2.828 0.203 | 171.6 2.9 |
| IT Tau | 4:33:54.722 0.020 | 26:13:27.201 0.023 | 4:33:54.594 0.030 | 26:13:25.494 0.036 | 2.426 0.056 | 225.3 0.9 |
| GK Tau | 4:33:34.572 0.022 | 24:21:05.571 0.025 | — | — | — | — |
| HN Tau | 4:33:39.376 0.011 | 17:00:00.000 0.012 | — | — | — | — |
| V710 Tau | 4:31:57.793 0.008 | 18:21:37.655 0.009 | — | — | — | — |
| IRAS 04298+2246 A | 4:32:49.120 0.027 | 22:53:02.594 0.033 | 4:32:49.232 0.042 | 22:53:02.007 0.050 | 1.653 0.078 | 110.8 2.0 |
| IRAS 04298+2246 B | 4:32:49.433 0.045 | 22:53:08.005 0.054 | 4:32:49.433 0.045 | 22:53:08.005 0.054 | 0.525 0.220 | 334.2 16.0 |
| HO Tau | 4:35:20.218 0.009 | 22:32:14.312 0.011 | — | — | — | — |
| UY Aur | 4:51:47.406 0.010 | 30:47:13.234 0.016 | 4:51:47.356 0.027 | 30:47:12.693 0.042 | 0.840 0.054 | 230.0 2.7 |
| IRAS 05022+2527 | 5:05:22.824 0.007 | 25:31:30.542 0.009 | — | — | — | — |
| DS Tau | 4:47:48.609 0.011 | 29:25:10.884 0.016 | — | — | — | — |
4.1. Notes on individual sources
In this section, we discuss individual sources that were further examined or treated differently during the analysis of the binary sample. After our observations were obtained, we found that two objects in our sample were known to be higher order multiples: IRAS 04298+2246 (JH 112) and IRAS 04133+2758 (MHO 1/2), which are discussed further below. We also reviewed the evidence of youth for the undetected secondaries (GK Tau, HO Tau, DS Tau, V710 Tau, FX Tau, HN Tau and IRAS 05022+2527) and conclude that in three of these systems (GK Tau, HO Tau and DS Tau) the observed companion is unlikely to be a young stellar object physically associated with the primary star. These three systems are not include in the analysis of binary properties in §4.3; further details are given below.
IRAS 04298+2246 (JH 112): This source was confirmed as a binary by Kraus & Hillenbrand (2009) with a separation of 66 but later work (Kraus et al., 2011) identifies four components: Aa, Ab, Ba and Bb. The ALMA observations detect all four components, resolving both IRAS 04298+2246 A and B into two sources with separations of 17 and 05 respectively. For the B pair, the near-infrared position angle of 88° (White et al., in prep) indicates that the secondary in this pair is brighter in the mm than the primary. We treat this quadruple system as two binaries (A and B) in the analysis of binary systems. To assign stellar luminosities to the individual components, we use the A and B luminosities from Andrews et al. (2013) and scale as , using the mass ratio from Kraus et al. (2011) for Aa and Ab and assuming an equal mass ratio for Ba and Bb.
IRAS 04113+2758 (MHO 1/2): Following the WDS catalog component names and positions for the source WDS 04144+2806 AB (Mason et al., 2001), we associate IRAS 04113+2758 A with MHO 1 and IRAS 04113+2758 B with MHO 2, which is itself a close binary (005; Kraus et al., 2011). We detect both of the widely spaced components, but we do not have the resolution to resolve the components of IRAS 04113+2758 B. Given the many close T Tauri binaries with substantial circumbinary disks, e.g. GG Tau (Simon & Guilloteau, 1992), UZ Tau E (Jensen et al., 1996), GW Ori (Mathieu et al., 1995), and DQ Tau (Mathieu et al., 1997), we include IRAS 04113+2758 in the binary sample, even though it is a multiple, due to the very small separation of the close pair. In §4.2 the adopted stellar mass is higher for IRAS 04113+2758 B than for A, so we designate B as the primary star in this system. With this assignment, the secondary flux for this system is higher than the primary flux. However, we note that the stellar mass ratio is within 1 of unity and the stellar mass estimation for B adopted from Andrews et al. (2013) treated B as a single star and did not derive separate stellar masses for Ba and Bb.
GK Tau: This source was first identified as a binary by Reipurth & Zinnecker (1993) where the companion is seen in CCD imaging; Hartigan et al. (1994) provided colors for both sources. Although Duchêne et al. (1999) measured an H equivalent width of 45 Å, they note that the spectrum has a poor signal-to-noise ratio. Recently, Kraus (2014, in prep) identified GK Tau B as a background star. We did not detect the secondary source and do not include this source in the analysis of binary systems.
HO Tau: Hartigan et al. (1994) were not successful in imaging the companion and conclude that the companion is likely to be a background star given its relative faintness and colors. We did not detect the secondary source and do not include this source in the analysis of binary systems.
DS Tau: Moneti & Zinnecker (1991) did not detect H from the companion and find that it is too faint to be a T Tauri star in Taurus. This is supported by the 2MASS colors, which are not red enough to be those of a young star (J-K=0.5 mag). We did not detect the secondary source and do not include this source in the analysis of binary systems.
V710 Tau: McCabe et al. (2006) detected both components in the mid-IR, the colors of both components are consistent with other T Tauri stars, and H has been detected for both components (White & Ghez, 2001). We did not detect the secondary source, but do include the mass limit in the analysis of binary systems. We use the Kraus et al. (2011) mass ratio for this system.
FX Tau: McCabe et al. (2006) detected both components in the mid-IR and the colors of both components are consistent with other T Tauri stars. We did not detect the secondary source, but we do include the mass limit in the analysis of binary systems.
HN Tau: Woitas et al. (2001) measured resolved near-infrared photometry for both components, which are consistent with other T Tauri stars. We did not detect the secondary source, but we do include the mass limit in the analysis of binary systems.
IRAS 05022+2527 (CIDA 9): Kraus & Hillenbrand (2007) fit 2MASS images to obtain near-infrared magnitudes for the secondary component and the colors are consistent with a location in Taurus. We did not detect the secondary source, but we do include the mass limit in the analysis of binary systems.
4.2. Stellar properties and disk mass
We adopt the stellar luminosities and masses from Andrews et al. (2013) for our sources, with the exception of V710 Tau B and IRAS 04298+2246 B as noted in the previous section; these stars were not included in Andrews et al. (2013). Andrews et al. (2013) derived luminosities by assuming an effective temperature from the spectral type and fitting the SED for the stellar luminosity and extinction, and derived masses by fitting to three different pre-main sequence stellar evolution grids. Here we have selected their fits from the Siess et al. (2000) grids, as Andrews et al. (2013) found that these model masses were closest to predicting the masses of those stars with dynamically determined masses. The adopted stellar luminosities and masses are given in Table 5. Assuming the dust is optically thin and isothermal, the conversion from flux () to disk mass () is
| (1) |
For comparison to the Taurus sample results of Andrews et al. (2013), we use the same constants of 140 pc, dust-to-gas ratio = 0.01, dust opacity = 2.3 cm2g-1 at 1.3 mm, and we use our 1.3 mm measured fluxes. The uncertainty used for the flux measurement includes both the fit uncertainty in Table 3 and a 5% absolute flux calibration uncertainty (ALMA memo 594). For the mean dust temperature , we also adopt the Andrews et al. (2013) scaling of K. The resulting disk masses are given in Table 5.
| Source | L∗ | M∗ | Disk mass |
|---|---|---|---|
| (L⊙) | (M⊙) | (M⊙) | |
| FV Tau A | |||
| FV Tau B | |||
| HBC 387 A | |||
| HBC 387 B | |||
| FQ Tau A | |||
| FQ Tau B | |||
| FX Tau A | |||
| FX Tau B | |||
| HK Tau A | |||
| HK Tau B | |||
| DK Tau A | |||
| DK Tau B | |||
| IRAS 04113+2758 A | |||
| IRAS 04113+2758 B | |||
| UY Aur A | |||
| UY Aur B | |||
| IRAS 05022+2527 A | |||
| IRAS 05022+2527 B | |||
| HBC 411 A | |||
| HBC 411 B | |||
| IT Tau A | |||
| IT Tau B | |||
| HN Tau A | |||
| HN Tau B | |||
| V710 Tau A | |||
| V710 Tau B | |||
| IRAS 04298+2246 Aa | |||
| IRAS 04298+2246 Ab | |||
| IRAS 04298+2246 Ba | |||
| IRAS 04298+2246 Bb |
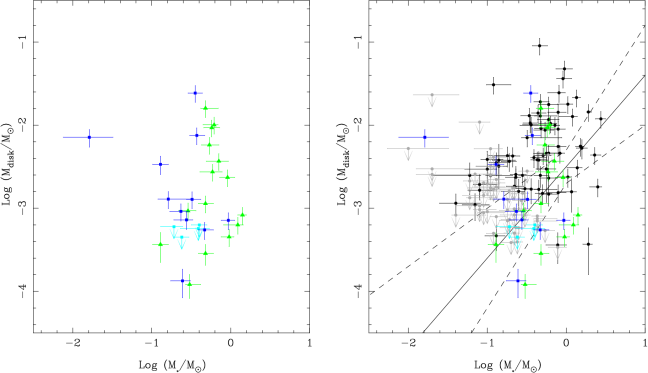
To probe some of the issues of disk formation and evolution in binary systems raised in §1, we first compared the fluxes and disk masses of the primaries to those of the secondaries. As can be seen in the left-hand panels of Figures 2 and 3, the spread in flux and disk mass is larger than the spread in stellar mass. To assemble a set of comparison single stars in Taurus, we used the sample in Andrews et al. (2013, their Table 2), and removed all known multiple sources using the list in Kraus et al. (2011). As pointed out by Andrews et al. (2013), there are likely to be some sources labeled as single that in fact have close companions, as multiplicity surveys are not complete at the lowest stellar masses and closest separations, but we do not attempt to correct for this. The right panels of Fig. 2 and 3 compare our measured 1.3 mm fluxes and derived disk masses to the sample of single Taurus stars. The higher sensitivity of our observations reveals several detections and upper limits significantly below the limits of previous work, suggesting that a population of lower mass disks remains to be detected, particularly around the lower mass stellar hosts.
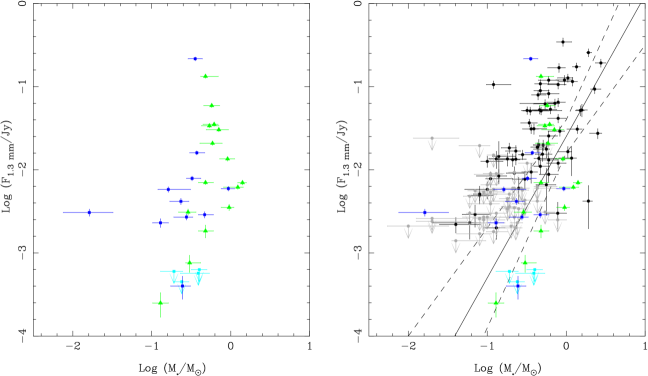
To quantitatively compare our sample to previous work, we used the survival analysis methods described in Feigelson & Nelson (1985) and Isobe et al. (1986) as implemented in the ASURV package (Lavalley et al., 1992) to calculate the correlation probabilities in the presence of upper limits. As recommended in Feigelson & Nelson (1985), we ran multiple versions of the relevant tests to compare the measurements. When comparing the measured flux, we used the univariate two-sample test methods Gehan, Peto and Peto, and Peto and Prentice from ASURV (Lavalley et al., 1992). These tests show that the probability of the primary and the single stars coming from the same population is 20-60% while the probability that the secondaries and singles are drawn from the same population is low (8-17%). The strongest result was for the test that the primaries and secondaries came from the same population, which has a probability of only 3-4%. However, given the limited sample size, the comparison of the primaries and secondaries may be significantly biased by the lower stellar mass for the secondaries. These results are similar to those found by Harris et al. (2012) in comparison of fluxes from singles, primaries, and secondaries. We also calculated the linear regression between the stellar mass and the disk mass for the primaries and secondaries as separated samples using ASURV (Lavalley et al., 1992). The resulting fits (using both the parametric EM algorithm and the Buckley-James method) are not well constrained, but agree within the uncertainties with the slope of log disk mass to log stellar mass found for all Taurus disks by Andrews et al. (2013).
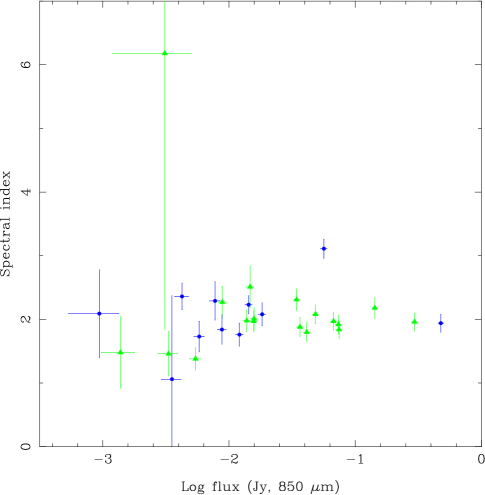
As all detected sources were detected in both bands, we calculated the spectral index between 1.3 mm and 850 m, where (Fig. 4). The spectral index values calculated for both the primaries and secondaries have an average of 2.1 and are similar to previous surveys of T Tauri stars (Andrews & Williams, 2005).
4.3. Binary comparisons
We have also compared the disks within each binary system for the 15 systems where we are confident of the pre-main sequence status of each component. In Fig. 5, we plot the secondary/primary flux and disk mass ratios as a function of the secondary/primary stellar mass ratio and in Fig. 6, we plot the flux ratio as a function of projected separation and primary flux. The previous surveys by Jensen & Akeson (2003) and Harris et al. (2012) both found that if two components were detected, the primary always had the higher flux. In this larger and more sensitive sample, we always detect the primary disk, but we find two systems, IRAS 04298+2246 B and HBC 411, where the secondary flux is significantly (i.e. ) higher (discounting IRAS 04113+2758 given the issues discussed in §4.1). We note that we have assumed an equal stellar mass ratio for the components of IRAS 04298+2246 B, where the primary status is assigned on the basis of the near-infrared flux ratio. If the primary has a higher stellar mass than the secondary, then the stellar mass ratio will be less than one and this system will be even more discrepant. In the comparison of the disk mass, where the stellar luminosity is factored in via the derived dust temperature (§4.2), a third system, IRAS 04298+2246 A, also has a significantly higher secondary disk mass.


We can use these results to examine predictions for binary disk masses. The observational result that the primary always has a disk if the system is detected is consistent with the predictions of binary formation models by Bate & Bonnell (1997) and Bate (2000). A second test of these models is the ratio of the disk masses within the binary system. Bate (2000) find that the primary disk should be more massive unless the circumprimary disk accretes on a shorter time-scale or the ongoing accretion is due to material from a circumbinary disk; however, Ochi et al. (2005) use a different numerical viscosity and find that the primary accretion from the circumbinary material is always higher than the secondary rate. Although the ALMA observations were not designed for sensitivity to extended emission, there is no evidence for substantial circumbinary emission in any of these systems. In the extended configuration used for these observations, the maximum scale for extended emission to be detected was 30 at 850 m and 44 at 1.3 mm. While no circumbinary emission is detected, this material may have dissipated more quickly than the circumstellar disks, so we cannot constrain whether there could be disk mass differences due to differential accretion from a circumbinary envelope.
While the binary disk formation models of Bate & Bonnell (1997), Bate (2000), and Ochi et al. (2005) address the formation of circumprimary and circumsecondary disks, they do not cover the subsequent viscous evolution and dissipation in the disk, which may be a factor for our sample as the mean age for Class II sources in Taurus was estimated to be 2.5-3 Myr by Andrews et al. (2013). Disk evolution has been shown to be dependent on stellar mass in other star formation regions. Two studies of clusters aged 5 Myr showed similar results; in Upper Sco, Carpenter et al. (2006) found 20% of K and M stars retained their disks while none of the F and G stars did, and in NGC 2362, Dahm & Hillenbrand (2007) found a disk fraction of 19% for stellar masses less than 1.2 M⊙, while none of the more massive stars still had a disk. While the stars in our sample range from 0.02 to 1.4 M⊙, with only IT Tau A above the 1.2 M⊙ cutoff found in the studies of older clusters, the general trend of faster dissipation for higher mass stars would affect our comparison of primary and secondary disk masses, as by definition the primary always has a higher stellar mass. To disentangle the separate roles of stellar mass and multiplicity in the evolution of the disk mass, a comparison of the single, primary, and secondary disk masses as a function of stellar mass is needed. As Fig. 3 shows, most of the stars with masses less than 0.6 M⊙ remain undetected in Taurus and more observations are needed before these dependencies can be quantified.
As Fig. 3 demonstrates, at a given stellar mass, there is a large scatter in disk mass; Andrews et al. (2013) measured a standard deviation of 0.7 dex in the log disk mass around the best linear fit as a function of stellar mass. If this scatter is due to initial conditions and/or disk evolution factors that vary on scales greater than the binary systems, i.e. are similar for a given primary and secondary, we would expect the disk mass ratios to be correlated with the stellar mass ratios. Using the ASURV survival analysis code (Lavalley et al., 1992) the probability that the log of the stellar mass ratio and the log of the disk mass ratio are correlated is 8-65% (for the Cox proportional hazard and Kendall’s tau tests), while Andrews et al. (2013) found a correlation in log stellar mass/log disk mass of for their entire sample of Taurus objects. This suggests that the factors which determined the disk masses for these binaries, both initial conditions and disk evolution, are not constant between the components. As discussed above, there is a known impact of stellar mass on the disk evolution and if this could be quantified, these binary systems could then be used as probe of other effects such as initial conditions and dynamical interactions.
5. Conclusions
We obtained ALMA observations of 17 young stellar multiples in Taurus and the sensitivity achieved resulted in several new detections of disks. Two of these new detections are of primaries and six are secondaries. Disks around all of the primary stars are detected, but four of the secondaries that show other signatures of youth and inner disk accretion (§4.1) remain undetected and are shown to have disk masses less than M⊙ for standard disk parameters. The new ALMA detections are generally at flux levels less than 5 mJy at 1.3 mm, below the limits of previous surveys, suggesting that many undetected objects in Taurus may simply have disk masses below M⊙ and a more sensitive, systematic survey of the Taurus population is needed to further quantify the stellar to disk mass relation seen by Andrews et al. (2013) for the lowest mass stars. We also examined the properties of the binary systems and have the following conclusions:
-
•
The majority of our new detections were for secondary sources and for these wide binaries ( AU), the secondary disk fraction is somewhat higher than shown in previous studies. We found 11 of the 15 bona fide young stellar binaries have disks with masses M⊙ around both stars, while Jensen & Akeson (2003) detected a circumsecondary disk in 1 of 4 systems and Harris et al. (2012) detected a circumsecondary disk in 6 of 12 systems where the components were resolved. There is significant overlap in the samples between these studies and the new detections are primarily due to the higher sensitivity of the ALMA observations. The newly detected primary disk masses and most of the secondary disk masses are considerably smaller than the minimum mass solar nebula, but this is not surprising given that the host stars are generally less than 1 M⊙. While it may be difficult for massive planets to form in these less massive disks, models of core accretion around lower-mass stars show that they may be able to form cores for lower-mass planets (e.g. Laughlin et al., 2004) and if the disk mass has evolved, larger planets may have formed earlier when the disk was more massive.
-
•
In two binary systems the secondary disk has a higher mm flux than the primary disk. This has not been seen in previous, smaller surveys and is counter to predictions of formation models where the infalling material is directly accreted onto the primary or secondary disk as opposed to accreting onto a circumbinary structure. This result could be explained by faster dissipation of the primary disk, which has been shown to be a function of stellar mass.
-
•
For this sample of wide binaries, the secondary/primary disk mass ratio is not correlated with the secondary/primary stellar mass ratio. This suggests that for these binary systems, any environmental factors shared between the two components that could affect the initial disk mass and disk evolution are not the dominant factor in determining the range of disk masses for a given stellar mass.
From these conclusions, it is clear that binaries do not follow a simple pattern of primary/secondary disk mass distribution; therefore, care should be taken when assigning flux to components in unresolved systems.
References
- Andrews et al. (2013) Andrews, S. M., Rosenfeld, K. A., Kraus, A. L., & Wilner, D. J. 2013, ApJ, 771, 129
- Andrews & Williams (2005) Andrews, S. M., & Williams, J. P. 2005, ApJ, 631, 1134
- Artymowicz & Lubow (1996) Artymowicz, P., & Lubow, S. H. 1996, ApJ, 467, L77
- Bate (2000) Bate, M. R. 2000, MNRAS, 314, 33
- Bate & Bonnell (1997) Bate, M. R., & Bonnell, I. A. 1997, MNRAS, 285, 33
- Beckwith et al. (1990) Beckwith, S. V. W., Sargent, A. I., Chini, R. S., & Guesten, R. 1990, AJ, 99, 924
- Carpenter et al. (2006) Carpenter, J. M., Mamajek, E. E., Hillenbrand, L. A., & Meyer, M. R. 2006, ApJ, 651, L49
- Dahm & Hillenbrand (2007) Dahm, S. E., & Hillenbrand, L. A. 2007, AJ, 133, 2072
- Duchêne et al. (1999) Duchêne, G., Monin, J.-L., Bouvier, J., & Ménard, F. 1999, A&A, 351, 954
- Dutrey et al. (2007) Dutrey, A., Guilloteau, S., & Ho, P. 2007, Protostars and Planets V, 495
- Feigelson & Nelson (1985) Feigelson, E. D., & Nelson, P. I. 1985, ApJ, 293, 192
- Harris et al. (2012) Harris, R. J., Andrews, S. M., Wilner, D. J., & Kraus, A. L. 2012, ApJ, 751, 115
- Hartigan et al. (1994) Hartigan, P., Strom, K. M., & Strom, S. E. 1994, ApJ, 427, 961
- Isobe et al. (1986) Isobe, T., Feigelson, E. D., & Nelson, P. I. 1986, ApJ, 306, 490
- Jensen & Akeson (2003) Jensen, E. L. N., & Akeson, R. L. 2003, ApJ, 584, 875
- Jensen et al. (1996) Jensen, E. L. N., Mathieu, R. D., & Fuller, G. A. 1996, ApJ, 458, 312
- Jensen et al. (1996) Jensen, E. L. N., Koerner, D. W., & Mathieu, R. D. 1996, AJ, 111, 2431
- Kraus & Hillenbrand (2007) Kraus, A. L., & Hillenbrand, L. A. 2007, ApJ, 662, 413
- Kraus & Hillenbrand (2009) Kraus, A. L., & Hillenbrand, L. A. 2009, ApJ, 703, 1511
- Kraus et al. (2011) Kraus, A. L., Ireland, M. J., Martinache, F., & Hillenbrand, L. A. 2011, ApJ, 731, 8
- Laughlin et al. (2004) Laughlin, G., Bodenheimer, P., & Adams, F. C. 2004, ApJ, 612, L73
- Lavalley et al. (1992) Lavalley, M. P., Isobe, T., & Feigelson, E. D. 1992, BAAS, 24, 839
- Mason et al. (2001) Mason, B. D., Wycoff, G. L., Hartkopf, W. I., Douglass, G. G., & Worley, C. E. 2001, AJ, 122, 3466
- McCabe et al. (2006) McCabe, C., Ghez, A. M., Prato, L., et al. 2006, ApJ, 636, 932
- Mathieu et al. (1995) Mathieu, R. D., Adams, F. C., Fuller, G. A., et al. 1995, AJ, 109, 2655
- Mathieu et al. (1997) Mathieu, R. D., Stassun, K., Basri, G., et al. 1997, AJ, 113, 1841
- Monin et al. (2007) Monin, J.-L., Clarke, C. J., Prato, L., & McCabe, C. 2007, Protostars and Planets V, 395
- Moneti & Zinnecker (1991) Moneti, A., & Zinnecker, H. 1991, A&A, 242, 428
- Ochi et al. (2005) Ochi, Y., Sugimoto, K., & Hanawa, T. 2005, ApJ, 623, 922
- Osterloh & Beckwith (1995) Osterloh, M., & Beckwith, S. V. W. 1995, ApJ, 439, 288
- Reipurth & Zinnecker (1993) Reipurth, B., & Zinnecker, H. 1993, A&A, 278, 81
- Siess et al. (2000) Siess, L., Dufour, E., & Forestini, M. 2000, A&A, 358, 593
- Simon & Guilloteau (1992) Simon, M., & Guilloteau, S. 1992, ApJ, 397, L47
- White & Ghez (2001) White, R. J., & Ghez, A. M. 2001, ApJ, 556, 265
- Woitas et al. (2001) Woitas, J., Leinert, C., & Koumlhler, R. 2001, A&A, 376, 982