Galaxies in H i 21-cm absorption at 3.5–LABEL:lastpage
Galaxies in H i 21-cm absorption at 3.5
Abstract
We present recent results from our searches of 21-cm absorption using GBT, GMRT, VLBA and WSRT to trace the evolution of cold gas in galaxies. Using 130 sight lines with 21-cm absorption measurements, we find that within the measurement uncertainty, the 21-cm detection rate in strong Mg ii systems is constant over . Since stellar feedback processes are expected to diminish the filling factor of CNM over , this lack of evolution in the 21-cm detection rate in Mg ii absorbers is intriguing. Further, we find that if majority of 21-cm absorbers arise from DLAs then the cross-section of 21-cm absorbing gas i.e. cold neutral medium amongst DLAs has increased from to . In a sample of 13 DLAs with both 21-cm and H2 (another tracer of cold gas) absorption measurements, we report two new H2 detections and find that in 8/13 cases neither 21-cm nor H2 is detected. This confirms that the H i gas in DLAs is predominantly warm. Interestingly, there are two cases where 21-cm absorption is not detected despite the presence of H2 with evidence for the presence of cold gas. This can be explained if H2 components seen in DLA are compact (15 pc) and contain 10% of the total N(H i). We briefly discuss results from our ongoing survey to identify 21-cm absorbers at low- to establish connection between 21-cm absorbers and galaxies, and constrain the extent of absorbing gas.
keywords:
quasars: absorption lines - galaxies: evolution - galaxies: ISM1 Introduction
It is well known that physical conditions in the diffuse interstellar medium (ISM) of galaxies are influenced by various radiative and mechanical feedback processes associated with in-situ star formation. Therefore, volume-filling factors of different phases of gas in a galaxy are expected to depend on its star formation history. Of particular interest is the evolution of the volume-filling factor of cold neutral medium (CNM) phase that also serves as a gaseous reservoir for star formation in galaxies. Systematic searches of high- intervening 21-cm absorbers in samples of Mg ii systems and damped Ly systems (DLAs) towards QSOs to measure CNM filling factor of galaxies have resulted in detections of 21-cm absorption towards 10-20% of Mg ii systems and DLAs. However, establishing a connection between the redshift evolution of 21-cm absorbers and global star formation rate (SFR) density is not straight forward due to (i) small number statistics of 21-cm absorbers; (ii) ambiguities regarding the origin of absorbing gas; and (iii) issues related to the small scale structure in absorbing gas and the extent of radio source. Here we present a summary of our recent results to constrain the evolution of cold gas in galaxies using 21-cm absorption and address issues related to partial coverage of absorbing gas.
2 21-cm absorption detection rate and CNM filling factor
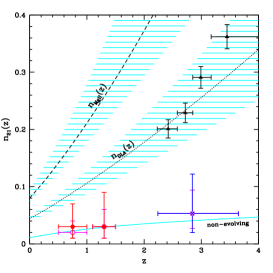
The availability of large samples of low resolution quasar spectra from the Sloan Digital Sky Survey (SDSS) has led to compilations of large homogeneous catalogues of Mg ii absorbers at and DLAs at . We have been carrying out systematic searches of 21-cm absorption in samples of strong Mg ii systems (rest equivalent width1Å) and DLAs towards radio sources brighter than 50 mJy at 1.4 GHz. These searches using the Green Bank Telescope (GBT), the Giant Metrewave Radio Telescope (GMRT) and the Westerbork Synthesis Radio Telescope (WSRT) have resulted in detection of 13 new 21-cm absorbers at (Gupta et al. 2007, 2009, 2012) and one new absorber at (Srianand et al. 2010). We have also complemented these observations with milliarcsecond scale imaging at 20-cm using Very Long Baseline Array (VLBA) to correct for the partial coverage of absorbing gas. Based on 21-cm optical depth measurements of 75 sight lines from our survey and 55 sight lines from the literature, we have constrained number per unit redshift range of 21-cm absorbers (n21) at (Fig. 1). We find that within the measurement uncertainty, the 21-cm detection rate in strong Mg ii systems is constant over 0.51.5, i.e., over 30% of the total age of universe. Since stellar feedback processes are expected to diminish the filling factor of CNM over 0.51, this lack of evolution in the 21-cm detection rate in strong Mg ii absorbers is intriguing.
Since the fraction of strong Mg ii absorbers that are likely to be DLAs is known from HST surveys at , it is possible to determine 21-cm detection rate amongst DLAs at . We find that the 21-cm absorption detection rate in the DLAs at is lower by at most a factor 3 compared to the upper limits we obtained using the strong Mg ii absorbers at . If the majority of 21-cm absorbers arise from DLAs then this would imply that the cross-section of the 21-cm absorbing gas i.e. CNM amongst DLAs has increased from to (Gupta et al. 2012).
3 21-cm absorption and H2
As the interpretation of 21-cm absorption measurements is often complicated by more than one unknown amongst spin temperature, N(H i) and covering factor, it is useful to constrain physical conditions in absorbers with 21-cm absorption measurements using other tracers of cold gas such as H2. In our sample of 28 DLAs at presented in Srianand et al. (2012), we find that there are 13 DLAs for which high-resolution optical spectra covering the expected wavelength range of H2 absorption are available. We report the detection of H2 molecules in the = 3.4 21-cm absorber towards J0203+1134 (PKS 0201+113; Srianand et al. 2012), and absorber towards J1337+3152 (Srianand et al. 2010). In eight cases, neither H2 (with molecular fraction f(H2)10-6) nor 21-cm absorption is detected. The lack of 21-cm and H2 absorption in these systems can be explained if most of the H i in these DLAs originates from low-density high-temperature gas. In one case we have a DLA with 21-cm absorption not showing H2 absorption. In the remaining two cases 21-cm absorption is not detected despite the presence of H2 with evidence for the presence of cold gas. All this combined with the constraints on density of gas from [C ii]* implies that the H2 components seen in DLAs are compact (with sizes of 15 pc) and contain only a small fraction (i.e. typically 10 per cent) of the total N(H i) measured in the DLAs (Srianand et al. 2012).
4 Partial coverage of background radio source
In a sample of 54 quasars with 21-cm absorption measurements at and milliarcsecond-scale VLBA images, we find 70% of 21-cm detections to be towards quasars with linear sizes 100 pc (Gupta et al. 2012). This suggests that 21-cm absorbing gas has a typical correlation length of 100 pc. We use VLBA images to correct 21-cm optical depths for partial coverage. We find that the 21-cm detection rates can be underestimated by up to a factor 2 if 21-cm optical depths are not corrected for the partial coverage.
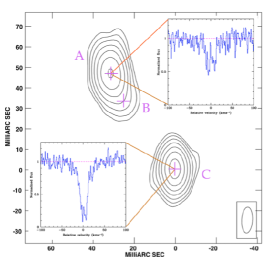
Unfortunately due to the unavailability of suitable low-frequency (1 GHz) receivers at VLBI stations it is not possible to perform milliarcsecond-scale spectroscopy and directly constrain the extent of absorbing gas. To summarize, milliarcsecond-scale 21-cm absorption spectroscopy has been done only in 5 cases. A lower limit of 2-30 pc has been inferred for the absorber sizes from these observations. For example, see the case of absorber towards J1639+1127 shown in Fig. 2 (Srianand et al. 2013). A systematic large survey to identify new 21-cm absorbers at low-redshift to establish the connection of 21-cm absorbers with galaxies (Gupta et al. 2010, 2013) and suitable for milliarcsecond-scale spectroscopy with VLBA is in progress. Finally, 21-cm detections of the order of DLA sample based on SDSS Data Release 9 will be possible with our MeerKAT Absorption Line Survey (MALS). Blind searches of 21-cm absorption lines with MeerKAT and other SKA pathfinders will provide a complete view of the evolution of cold gas in galaxies and shed light on the nature of Mg ii systems and DLAs, and their relationship with stellar feedback processes.
Acknowledgements
We thank GBT, GMRT, VLBA and WSRT staff for their support during the observations of data used in the work presented here. We also acknowledge the use of SDSS spectra and images.
References
- (1) Gupta, N., Srianand, R., Petitjean, P., et al. 2007, ApJ, 654, L111
- (2) Gupta, N., Srianand, R., Petitjean, P., Noterdaeme, P., et al. 2009, MNRAS, 398, 201
- (3) Gupta, N., Srianand, R., Bowen, D. V., York, D. G., et al. 2010, MNRAS, 408, 849
- (4) Gupta, N., Srianand, R., Petitjean, P., Bergeron, J., Noterdaeme, P., et al. 2012, A&A, 544, 21
- (5) Gupta, N., Srianand, R., Noterdaeme, P., Petitjean, P., Muzahid, S., 2013, A&A, 558, 84
- (6) Srianand, R., Gupta, N., Petitjean, P., et al. 2012, MNRAS, 421, 651
- (7) Srianand, R., Gupta, N., Rahmani, H., Momjian, E., et al. 2013, MNRAS, 428, 2198
- (8)