The Revised IRAS-FSC Redshift Catalogue (RIFSCz)
Abstract
We present a Revised IRAS-FSC Redshift Catalogue (RIFSCz) of 60,303 galaxies selected at 60 from the IRAS Faint Source Catalogue (FSC). This revision merges in data from the WISE All-Sky Data Release, the Tenth SDSS Data Release (DR10), the GALEX All-Sky Survey Source Catalog (GASC), the 2MASS Redshift Survey (2MRS) and the Planck Catalogue of Compact Sources (PCCS). The RIFSCz consists of accurate position, ultra-violet (UV), optical, near-, mid- and far-infrared, sub-millimetre (sub-mm) and/or radio identifications, spectroscopic redshift (if available) or photometric redshift (if possible), predicted far-infrared and sub-mm fluxes ranging from 12 to 1380 based upon the best-fit infrared template. We also provide stellar masses, star-formation rates and dust masses derived from the optical and infrared template fits, where possible. of the galaxies in the RIFSCz have spectroscopic redshifts and a further have photometric redshifts obtained through the template-fitting method. At S60 0.36 Jy, the 90 completeness limit of the FSC, of the sources in the RIFSCz have either spectroscopic or photometric redshifts. An interesting subset of the catalogue is the sources detected by Planck at sub-mm wavelengths. 1200 sources have a detection at better than 5- in at least one Planck band and a further 1186 sources have detections at 3-5 in at least one Planck band.
keywords:
catalogues – surveys – galaxies: distances and redshifts –infrared: galaxies – quasars: general – large-scale structure of Universe.1 INTRODUCTION
The IRAS Faint Source Catalog (FSC; Moshir et al. 1992) contains 173,044 sources reaching a depth of 0.2 Jy at 12, 25 and 60 . It is limited to in unconfused regions at 60 . For sources with high-quality flux density111In the IRAS FSC, the flux density quality (FQUAL) is classified as high (=3), moderate (=2) or upper limit (=1), reliability is at 12 and 25 and at 60 . Around 41 of the FSC sources are detected at 60 m (FQUAL 1). The construction of the Imperial IRAS-FSC Redshift Catalogue (IIFSCz; Wang & Rowan-Robinson 2009) was made possible by overlaps (in terms of depth and area) with various imaging and/or redshift surveys, such as the Sloan Digital Sky Survey (SDSS; York et al. 2000), the Two Micron All Sky Survey (2MASS; Skrutskie et al. 2006) and the 6dF Galaxy Survey (Jones et al. 2004, 2005). However, the large positional error of the IRAS sources has meant in particular that the cross-identification between IRAS and the deep optical data SDSS is very challenging. The completion and/or release of several major surveys in the last few years, including the Wide-field Infrared Survey Explorer (WISE; Wright et al. 2010) All-Sky Survey, the GALEX All-Sky Survey Source Catalog (GASC; Seibert et al., in prep.), the 2MASS Redshift Survey (2MRS; Huchra et al. 2012), the Tenth SDSS Data Release (DR10; Ahn et al. 2013) and the Planck all-sky survey (Planck Collaboration I 2013) in the microwave and sub-millimetre (sub-mm), has made it imperative to revise the IIFSCz. In particular, the imaging depth and sky coverage of WISE are such that the WISE all-sky source catalogue provides counterparts for the majority of sources in the IIFSCz and thereby improves the positional accuracy of these sources by a factor of 10. Using the WISE positions, cross-identification between IRAS sources and sources detected at UV, optical and near-infrared becomes much easier and much more reliable.
The layout of this paper is as follows. In Section 2, first we cross-identify IRAS FSC sources with their mid-infrared (MIR) WISE counterparts using a likelihood ratio technique. Then, using their WISE positions, we cross-match FSC sources with sources detected in other wavebands including the ultra-violet (UV), optical, near-infrared (NIR) and sub-mm. Spectroscopic redshifts are collected from a number of databases, e.g., SDSS DR10, 2MRS and NED. In Section 3, we estimate photometric redshift using a template-fitting method for sources matched with WISE, SDSS and/or 2MASS counterparts but do not have spectroscopic redshifts. In Section 4, infrared templates are fitted to the mid- and far-infrared data from IRAS and WISE as well as sub-mm data from Planck for FSC sources with WISE and Planck associations. Once a best-fit infrared template is found, we make flux predictions at far-infrared and sub-mm wavelengths. Finally, discussions and conclusions of the overall properties of the revised IRAS-FSC Redshift catalogue (RIFSCz) are given in Section 5. Throughout the paper, we adopt a flat cosmological model with and and a Salpeter initial mass function (Salpeter et al. 1955). Unless otherwise stated, we use the AB magnitude system, and .
2 SOURCE IDENTIFICATION
Our starting point is the complete sample of galaxies selected at 60 from the IRAS FSC, presented in Wang & Rowan-Robinson (2009). For the sake of completeness, we briefly summarise our selection criteria here: (1) To ensure reliability, we select sources with FQUAL and SNR at 60 ; (2) To exclude cirrus, we require (S100/S60) if FQUAL at 100 ; (3) To discriminate against stars, we firstly require (S60/S25) if FQUAL at 25 and then (S60/S12) if FQUAL 2 at 12 .
2.1 Cross-match with WISE
The Wide-field Infrared Survey Explorer (WISE; Wright et al. 2010) mapped the sky at 3.4, 4.6, 12, and 22 (W1, W2, W3, W4) with an angular resolution of 6.1″, 6.4″, 6.5″and 12.0″respectively. The All-Sky Release includes all data taken during the full cryogenic mission phase and the All-Sky Source Catalog contains the properties of over 563 million point-like and resolved objects. To ensure a high degree of reliability, sources are required to meet SNR 5 in at least one WISE band and other criteria. Photometry is presented in the form of point source profile-fitting measurement and multi-aperture photometry. WISE 5 photometric sensitivity is estimated to be 0.068, 0.098, 0.86 and 5.4 mJy at 3.4, 4.6, 12 and 22 in unconfused regions on the ecliptic plane (Wright et al. 2010). Sensitivity is better in regions at higher ecliptic latitudes with deeper coverage and lower zodiacal background, and worse in regions with high source density or complex background. WISE provides Vega magnitudes and we have taken the corrections to AB magnitudes to be 2.683, 3.319, 5.242 and 6.604 mags at 3.4, 4.6, 12 and 22 .
2.1.1 The likelihood ratio technique


We use the likelihood ratio technique (LR; Sutherland & Saunders 1992; Brusa et al. 2007; Wang & Rowan-Robinson 2010; Chapin et al. 2011; Wang et al. 2013) to cross-match FSC sources with counterparts at 3.4 which is the most sensitive WISE band. The LR technique compares the probability of a true counterpart with the probability of a chance association, as a function of 60-to-3.4 flux ratio and radial offset . Assuming the probability of true counterpart and random association is separable in (or as a shorthand) and , we can write
| (1) |
where and are the colour distributions of the true counterparts and random matches respectively, and and are the positional distributions of the true counterparts and random associations respectively. To derive the positional distribution of the true counterparts , we assume a symmetric Gaussian distribution as a function of orthogonal positional coordinates. Therefore, can be written as a Rayleigh radial distribution,
| (2) |
where the scale parameter of the Rayleigh distribution is where peaks and . The positional distribution of random associations can be written as
| (3) |
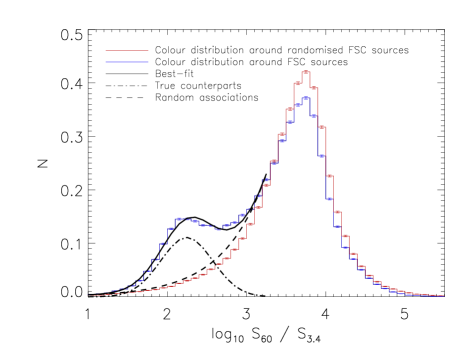
assuming a constant surface density of random background 3.4 sources uncorrelated with FSC sources. In the top panel in Fig. 1, we plot the average distribution of radial offsets between FSC and WISE sources per FSC source, which contains both the true counterparts and the random associations. We fit our model
| (4) |
to the observed histogram to determine the best-fit parameters to be , , and arc sec-2. Consequently, the best-fit radial distribution of the true counterparts and that of the random associations can be characterised using our model, which are plotted as the thick solid line and the dotted line in the top panel in Fig. 1. In the bottom panel in Fig. 1, we plot the average 60-to-3.4 colour distribution of all FSC-WISE matches per FSC source and per randomised FSC source. The former contains both real FSC-WISE matches and random associations. The latter contains only random 3.4 sources uncorrelated with FSC sources. We generate the randomised FSC catalogue by locally randomising the IRAS positions and randomly swapping the 60 flux densities. The colour distribution per randomised FSC source can be characterised by an exponential increase towards larger values of (fainter 3.4 flux densities) followed by an exponential decrease due to incompleteness. The colour distribution per FSC source can be characterised by a Gaussian distribution of the true counterparts and the double exponential form of the random associations. Consequently, we fit a Gaussian and an exponential function to the colour distribution per FSC source at .
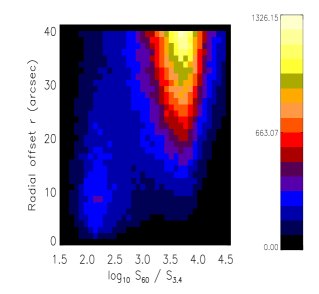
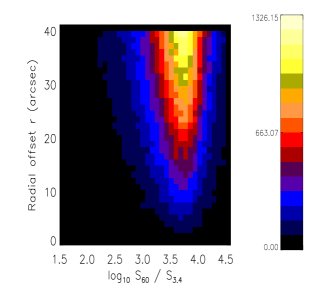
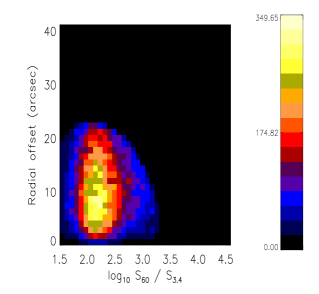
We can now calculate the likelihood ratio for every possible match between FSC and WISE sources. The exact value of the likelihood ratio is not important, only the relative ordering matters. In Fig. 2, we plot the LR distribution of all matches between FSC and WISE (the solid histogram) and the LR distribution of all matches between the randomised FSC and WISE (the dashed histogram). At , the solid histogram becomes indistinguishable from the dashed histogram, which indicates that the vast majority of the real matches between FSC and WISE have . It is clear that real matches between FSC and WISE sources form a peak at high LR values. We select FSC-WISE matches with which corresponds to 4% false identification rate222The false identification rate is the ratio of the number of matches between the randomised FSC and WISE above the chosen LR threshold to the total number of matches.. In cases where there are more than one candidate WISE source matched to the same FSC source333For all FSC sources matched with WISE counterparts with , of them have more than one WISE match. However, we emphasise that this percentage depends on the chosen LR threshold., the one with the highest likelihood ratio is selected. In total, 48,603 IRAS sources ( of the RIFSCz catalogue) are matched with a WISE 3.4 counterpart. In Fig. 3, we plot the 2D distribution in and radial offset of all matches between FSC and WISE (left panel), all matches between randomised FSC and WISE (middle), and the final matched FSC-WISE catalogue using the likelihood ratio technique (right).
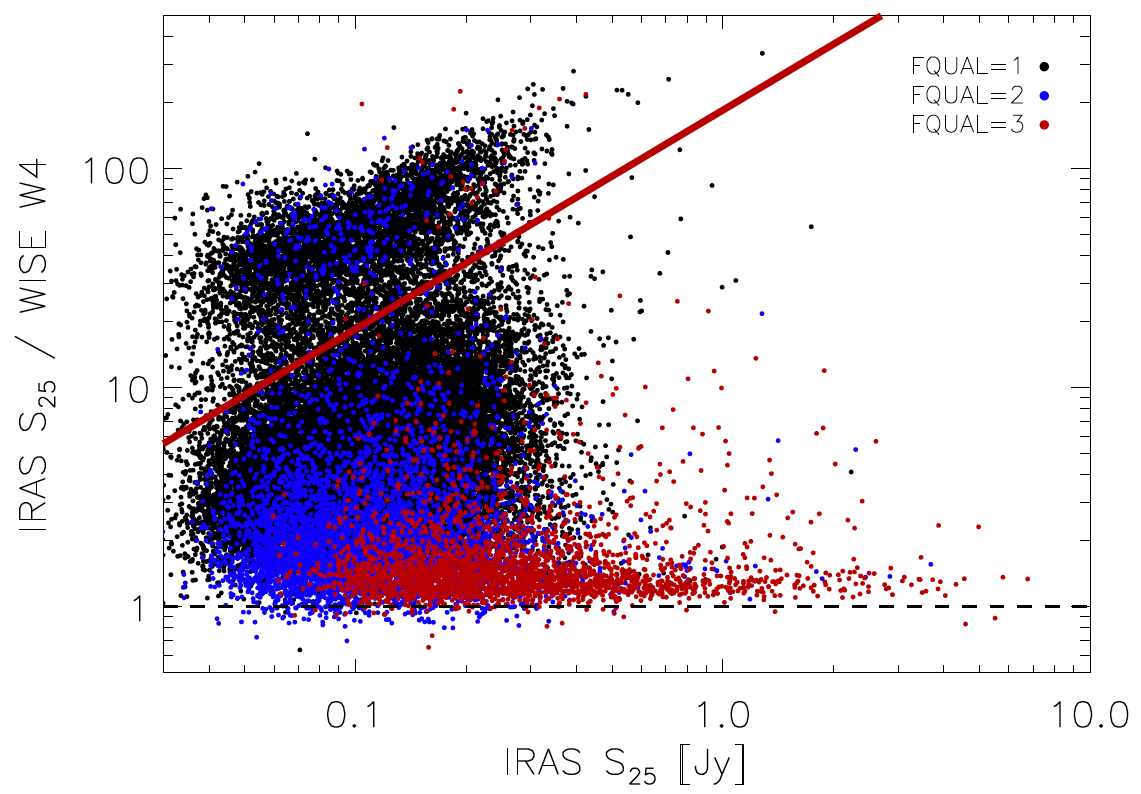
We can also check the degree of agreement between IRAS 25 and WISE 22 detections. In Fig. 4, we plot the IRAS 25 flux density to WISE 22 flux density ratio versus the IRAS 25 flux density for FSC-WISE matched sources with SNR 2 in the WISE 22 band and FQUAL in the IRAS 25 band = 1, 2 or 3. A good agreement between WISE and IRAS can be seen for sources with high quality IRAS flux density measurements (FQUAL ). WISE fluxes are systematically below the IRAS fluxes even after taking into account the band difference. This systematic trend can be removed after making aperture correction at the WISE bands (see Section 3.1). A similar comparison between the IRAS 12 fluxes and the WISE 12 fluxes can be made. However, the number of IRAS sources with high quality flux measurement at 12 is very small. Therefore, we do not show a plot of the 12 flux comparison here.
2.2 Cross-match with GALEX
GALEX has undertaken a number of surveys covering large areas of sky at a variety of depths. The largest two are the All-Sky (AIS) and Medium Imaging Surveys (MIS). The AIS is much shallower than the MIS but it covers a much larger area of sky. The standard GALEX database contains all of the detected sources which include many duplicate observations of the same source as well as numerous spurious sources. To address these problems, two catalogues of GALEX measurements, namely the GALEX All-Sky Survey Source Catalog (GASC) and the GALEX Medium Imaging Survey Catalog (GMSC), have been constructed (Seibert et al. in prep.). Sources are selected if they are detected in the NUV with SNR . Covering a total of 26,300 deg2 of sky, the GASC consists of all GALEX observations reaching a depth of NUV 21 (AB mag) and a total of 40 million unique sources. Following Budavári et al. (2009) and Heinis et al. (2009), we match GALEX sources with FSC sources which have received accurate positions from WISE, using a search radius of 5″. A total of 31,552 matches are found which correspond to 31,537 unique FSC sources. Only about 10 FSC sources have multiple GALEX matches. For these 10 sources, we simply select the closest GALEX source as the correct association.
2.3 Cross-match with SDSS DR10
The original IIFSCz cross-matched IRAS FSC with SDSS DR6. The source identification process was complicated as the probability of chance association is , where n is the number density of background optical objects and is the cross-matching radius. The positional uncertainty of the FSC sources matched with WISE improved drastically thanks to the much higher WISE angular resolution. Following Yan et al. (2013), we carried out source matching between IRAS sources with WISE positions and SDSS DR10 using a matching radius of 3″. The SDSS photometric DR10 survey has covered a total unique area of 14,555 deg2 (Ahn et al. 2013). In total, 25,553 SDSS sources are found within 3″ of the IRAS sources matched with WISE. Only primary SDSS objects444Whenever the SDSS makes multiple observations of the same object, the one with the best photometry will be assigned as the ‘primary’ observation. are selected. 20,277 FSC sources have unique SDSS association within 3″, 2,531 FSC sources have multiple SDSS matches. We simply assign the closest SDSS object as the correct optical association for FSC sources with multiple SDSS matches. For some large, nearby galaxies this procedure can lead to association with the wrong SDSS source. We have corrected this where possible.
2.4 Cross-match with 2MASS
The 2MASS survey has imaged the whole sky in the J (1.24 ), H (1.66 ) and Ks (2.16 ) near-infrared wavebands (Skrutskie et al. 2006). The 2MASS All-Sky Release Point Source Catalog (PSC) contains attributes in the three survey bands for over 470 million sources. The 2MASS All-Sky Data Release Extended Source Catalog (XSC; Jarrett et al. 2000) contains properties for over 1.6 million objects which are resolved relative to a single point-spread-function. The PSC contains point-source processed photometry for almost all of the resolved sources in the XSC.
Association information cross-referencing WISE sources with the 2MASS PSC is provided in the WISE All-Sky Source Catalog. In total, there are 45,892 sources in the 2MASS PSC matched to the 48,603 FSC sources which have received WISE positions. We also matched the 48,603 FSC sources with the 2MASS XSC. In total, 35,772 out of the 48,603 FSC sources found a 2MASS XSC counterpart.
2.5 Cross-match with Planck
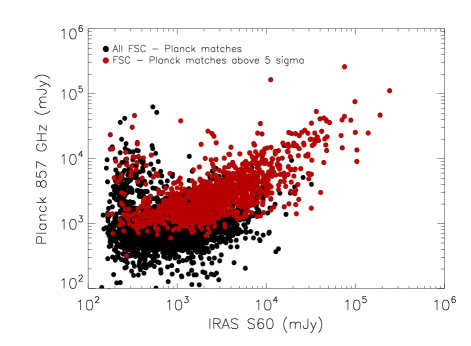
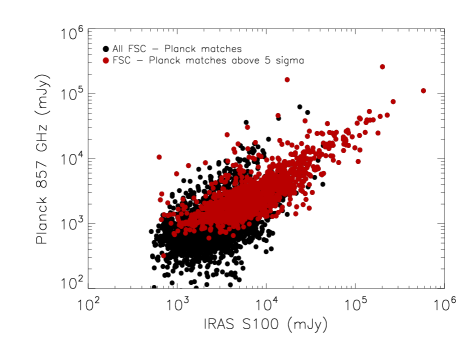
The first public release (PR1) of the Planck Catalogue of Compact Sources (PCCS; Planck Collaboration XXVIII 2013) consists of nine single-frequency catalogues of compact sources over the entire sky, covering the frequency range from 30 to 857 GHz (10561 to 350 ). We cross-match the Planck PR1 catalogue at 857 GHz with the IIFSCz catalogue using a matching radius of 3′. The full width at half maximum (FWHM) of the Planck beam at 857 GHz is 4.33′. The 857 GHz catalogue also includes aperture photometry at 217 (1382 ), 353 (850 ) and 545 GHz (550 ). In total, there are 4,136 matched sources. Only about 30 Planck sources have more than one FSC sources within 3′. The histogram of positional differences between IRAS and Planck positions peaks at 40″. The comparison between the Planck 857 GHz flux densities and the IRAS 100 or 60 flux densities exhibits a good general correlation as shown in Fig. 5.
There are 1,200 IIFSCz sources with a Planck detection better than 5 in at least one of the 350, 550, 850 or 1382 bands (and 2,364 sources with a planck detection better than 3). These are the most reliable Planck point-sources at , since for Planck sources unassociated with an IRAS extragalactic source there is a strong possibility that the source is due to cirrus.
2.6 Spectroscopic redshift compilation
The SDSS spectroscopic DR10 survey has covered a total unique area of 9274 deg2 (Ahn et al. 2013). We get 11,749 redshift by cross-matching IRAS sources with WISE positions and SDSS objects. The 2MASS Redshift Survey (2MRS; Huchra et al. 2012) ultimately aims to determine the redshifts of all galaxies in the 2MASS XSC to a magnitude of K=12.2 mag and to within 5 deg of the Galactic plane. The second phase of 2MRS is now complete, providing an all-sky survey of 45,000 galaxies to a limiting magnitude of K=11.75 mag. We retrieve 9, 264 redshifts by cross-matching IRAS sources with WISE positions and 2MASS sources. An NED all-sky query of FSC sources at with available redshift and S60 0.1 Jy returned 64,219 objects. 9,523 new redshifts (not included in SDSS DR10 or 2MRS) are obtained. We also managed to get 4,557 spectroscopic redshifts from the PSC Redshift Survey (PSCz; Saunders et al. 2000), the 6dF Galaxy Survey, and the FSS redshift survey (FSSz; Oliver, PhD thesis). To summarise, we have obtained 33, 956 spectroscopic redshifts from SDSS DR10, 2MRS, NED, FSSz, PSCz and 6dF, which comprises of our base catalogue.
Table 1 shows a breakdown of the multi-wavelength photometric data (from GALEX, SDSS, 2MASS, WISE, IRAS, Planck and NVSS) for the RIFSCz. Table 2 shows a summary of spectroscopic redshift data (from SDSS, 2MRS, NED, FSSz, PSCz and 6dF) for the RIFSCz.
| Source | Number |
|---|---|
| GALEX NUV, FUV | 31,537/25,074 |
| SDSS u,g,r,i,z | 21,503 |
| 2MASS PSC J, H, K | 45,892 |
| WISE W1, W2, W3, W4 | 48,603/48,603/48,591/48,588 |
| IRAS 12, 25, 100 | 4,476/9,606/30,942 |
| Planck 217, 353, 545, 857 GHz | 150/616/1,152/2,275 |
| NVSS 1.4 GHz | 23,703 |
| Source of | Number | Fraction |
|---|---|---|
| SDSS DR10 | 11,749 | |
| 2MRS | 9,264 | |
| NED | 26,953 | |
| IRAS FSSz | 568 | |
| IRAS PSCz | 1,972 | |
| 6dF Galaxy Survey | 2,794 | |
| Total | 33,956 |
3 PHOTOMETRIC REDSHIFT
We apply a template-fitting method that has been used to construct the SWIRE Photometric Redshift Catalogue (Rowan-Robinson et al. 2008 and references therein) to the revised IIFSCz galaxies with either optical or near-infrared photometry. Initially we use only a single pass through the data and a resolution of 0.002 in . We use six galaxy templates (E, Sab, Sbc, Scd, Sdm and starburst) and three QSO templates, as in Rowan-Robinson et al. (2008).
Our starting point is the revised IIFSCz sample of 60,303 sources associated with GALEX, SDSS, 2MASS, WISE, Planck and NVSS, and with obvious stars and cirrus sources removed. 33,956 sources now have spectroscopic redshifts through a compilation of several major spectroscopic surveys and the NED database. We estimate photometric redshifts for the remainder using the available 0.361 - 4.6 photometric data. We use SDSS model magnitudes and 2MASS extended fluxes, where available.
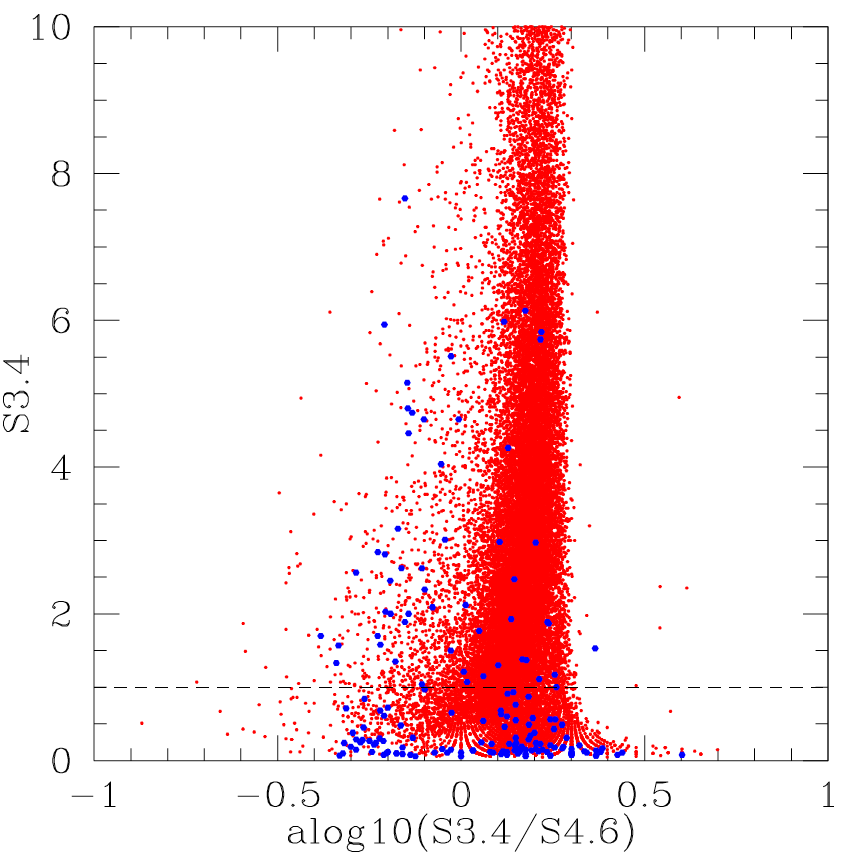
Fig. 6 shows the WISE 3.44.6 colour versus 3.4 flux density S3.4. There is clearly increased scatter at the faintest 3.4 fluxes. Thus, we only use WISE 3.4 and 4.6 fluxes in the photometric redshift estimation if S3.4 1 mJy and S4.6 1 mJy. We also require S12 1 mJy, S24 5 mJy (corresponding roughly to the 5- WISE limits).
3.1 Aperture corrections
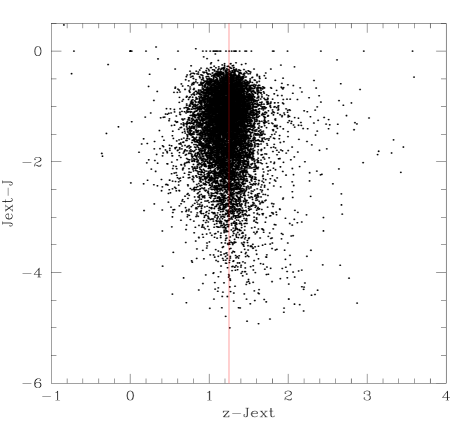
The left panel in Fig. 7 shows the J-band aperture correction () versus (), illustrating that the SDSS model magnitudes and 2MASS extended magnitudes have well-matched aperture corrections. However a similar plot for () shows a strong dependence of colour on J-band aperture correction, suggesting that the WISE 3.4 and 4.6 magnitudes need to be aperture corrected. The right panel in Fig. 7 shows () versus ()), illustrating that the WISE 3.4 magnitudes need an aperture correction = 0.6 the 2MASS J-band aperture correction, delmag = . We have applied this same aperture correction to the WISE 4.6 data.

We have also explored whether the WISE 12 and 22 fluxes need aperture correction, and found optimum results with
| (5) |
and
| (6) |
where delmag is the J-band aperture correction, .
The left panel in Fig. 8 shows the IRAS 12 flux versus the aperture corrected WISE 12 flux. The right panel in Fig. 8 shows the IRAS 25 flux versus the aperture corrected WISE 22 flux. The agreement is good in both cases, except for a tail of sources where the WISE fluxes appear to be underestimated. The alternative interpretation, that the IRAS fluxes are overestimated does not fit in well with SED modelling of these sources.


3.2 Stellarity
To distinguish reliably between galaxies and QSOs without generating excessive aliasing, a measure of stellarity is required. SDSS sources with sdsstyp = “STAR” are given a stellar flag, as are NED sources with nedtp = “QSO”. In addition we have assumed that sources with are stellar.
3.3 Identification of AGN dust tori
A feature of the codes developed for estimating photometric redshifts for Spitzer galaxies (Rowan-Robinson et al 2005, 2008, 2012) is the use of 3.6 and 4.5 data to constrain redshift. This is very effective in reducing the number of catastrophic outliers. However it becomes important to identify those galaxies with significant AGN dust tori, whether QSOs or Seyferts, since the dust torus can dominate over starlight (or AGN continuum) at wavelengths down to 1 .
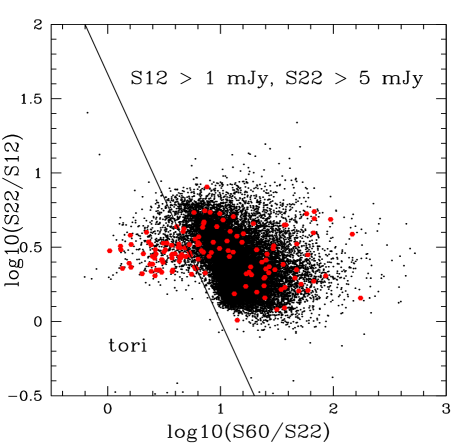
If we want to use the WISE 3.4 and 4.6 fluxes (and the J, H, and Ks fluxes) in the redshift solution, we have to find a way of identifying the AGN dust tori. We have chosen to use a key diagnostic diagram introduced by Rowan-Robinson and Crawford (1969), the 12-25-60 colour-colour diagram. Fig. 9 shows a plot of versus for the RIFSCz sample, with 12 and 22 fluxes taken from WISE and the 60 flux taken from IRAS. Sources to the left of the sloping line in Fig. 9 are assumed to have significant dust tori and these (together with all sources identified as QSOs on the first pass) go through a second photometric redshift pass in which, following Rowan-Robinson et al (2012), each galaxy or QSO template has added to it ten different possible amplitudes of an AGN dust torus. WISE 3.4 and 4.6 data are used only in the second pass, for the sources suspected to contain AGN dust tori. For galaxies without AGN dust tori, the 3.4 and 4.6 did not improve the redshift solution, perhaps because of inadequate aperture correction of extended sources.
3.4 Performance
The top panel in Fig. 10 shows a comparison of photometric and spectroscopic redshifts for sources with at least 8 photometric bands and with reduced . The percentage of catastrophic outliers, i.e. () differs from () by more than 15, is 0.17, 3.4 and 3.5 for sources with 8, 5 and 3 photometric bands, respectively. The rms accuracy, after exclusion of these outliers, is 3.5, 4.0 and 3.8 for sources with 8, 5 and 3 photometric bands, respectively. These represent a good photometric redshift performance (cf Rowan-Robinson et al 2008, 2013). The bottom panel in Fig. 10 shows a comparison of spectroscopic and photometric redshifts for QSOs with at least 3 photometric bands and reduced . The approximately power-law form of the optical continua of QSOs leads to some redshift aliasing. To summarise, we have 33,956 spectroscopic redshifts, 15,406 photometric redshifts, 37 sources with photometry but no successful redshift due to inconsistencies among the photometry data, and 10,941 sources with no spectroscopic or photometric redshift.
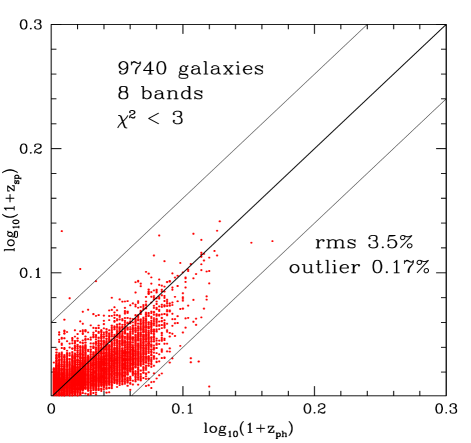
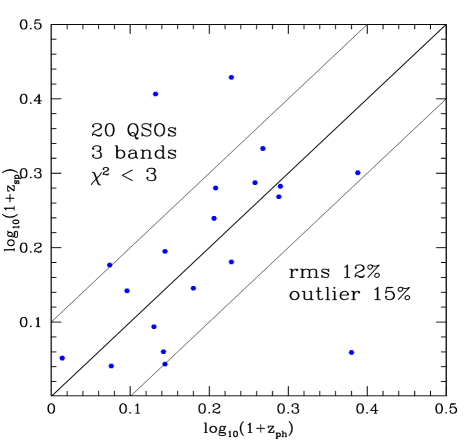
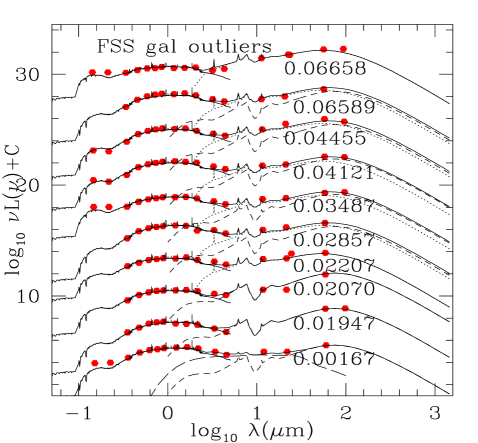
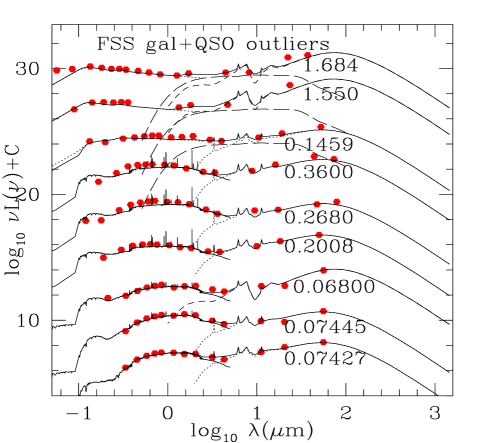
Fig. 11 shows SEDs of galaxies (and one QSO) which are outliers with (i.e. ) in Fig. 10. Galex data have been used in the SED plots, where available, but not in the photometric redshift solution. The spectroscopic redshifts, as indicated near each object, look plausible in all cases. The photometric redshift appears to be pulled away from the correct value by small mismatches in the SDSS and 2MASS aperture corrections, and by aliasing caused by dust extinction. Where the aperture corrected SDSS and 2MASS fluxes are highly discrepant we have used only 2MASS fluxes in the redshift solution.
4 Infrared template fits
Mid- and far-infrared data from IRAS and WISE (12, 22, 25, 60 and 100 ) and sub-mm data from Planck (350, 550 and 850 ) were fitted initially, following the methodology of Rowan-Robinson et al (2005, 2008) and as in Wang & Rowan-Robinson (2009a), with a combination of four infrared templates (cirrus, M82 and Arp220 starbursts, or AGN dust torus). However while the four standard infrared templates work well for many sources, the 350 - 850 fluxes often require the presence of colder dust than is incorporated into our four basic templates. The two new templates used here are taken from the range of optically thin interstellar medium (“cirrus”) templates developed by Rowan-Robinson (1992) and Efstathiou & Rowan-Robinson (2003). The key parameter determining the temperature of the dust grains is the intensity of the radiation field, which we can characterise by the ratio of intensity of radiation field to the local interstellar radiation field, . The standard cirrus template corresponds to = 5, and this is the value used by Rowan-Robinson (1992) to fit the central regions of our Galaxy. = 1 corresponds to the interstellar radiation field in the vicinity of the Sun. We also find that some galaxies need a much lower intensity radiation field than this, with = 0.1. The corresponding grain temperatures in the dust model of Rowan-Robinson (1992) for the two new template are in the ranges 14.5 - 19.7 K and 9.8 - 13.4 K respectively. Full details of the templates used are given at http://astro.ic.ac.uk/mrr/swirephotzcat/templates/readme.
Following the analysis of Rowan-Robinson & Efstathiou (2009) of the Spoon et al (2008) IRS diagnostic diagram, we have also introduced a young starburst (ysb) template, more extreme than the Arp220 template. This was found to be necessary by Rowan-Robinson et al (2010) in their analysis of the SEDs of a preliminary sample of 68 Lockman-SPIRE sources. Another template considered, following Rowan-Robinson & Efstathiou (2009), was an old starburst template, but we found that the SED for this was too similar to a pure cirrus template to be a worthwhile addition.
Our automatic SED fitting code uses two cirrus templates ( = 5, 1), one of three starburst templates (M82, Arp220, ysb), and an AGN dust torus template. These infrared SED templates provide a good fit to the mid- and far-infrared, and sub-mm, data for most sources. Fig. 12 shows the 25 (or 22) - 60 - 100 colour-colour diagram, colour-coded by the infrared template making the dominant contribution to the infrared luminosity. Sources whose SEDs are dominated by standard cirrus () or cool cirrus () have colder 60-100 colours, while starburst or AGN dominated sources have warmer 60-100 colours.
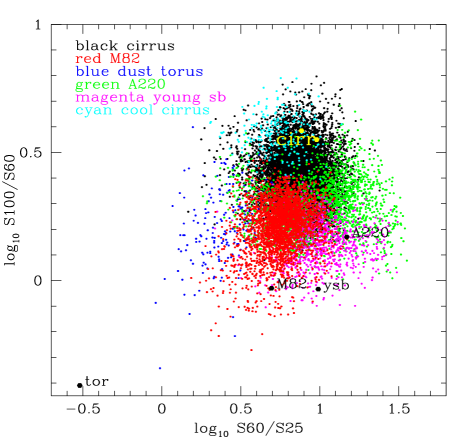
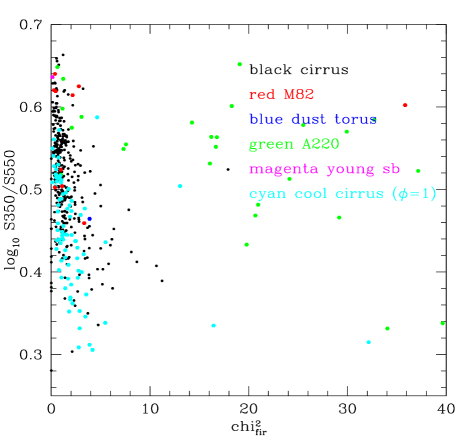
Fig. 13 shows the Plankc 350500 flux-ratio versus the reduced for the infrared and sub-mm fit. This illustrates that the reduced is good for most sources, and especially for warmer sources. We have modelled the SEDs of all sources with sub-mm data for which . For many cases the poor is simply due to incorrect aperture corrections, especially for the WISE fluxes. For very large galaxies which are in the IRAS Large Optical Galaxy Catalog (Rice et al 1988), or which have delmag -3, we do not use the WISE fluxes in the redshift or infrared template fit solutions.
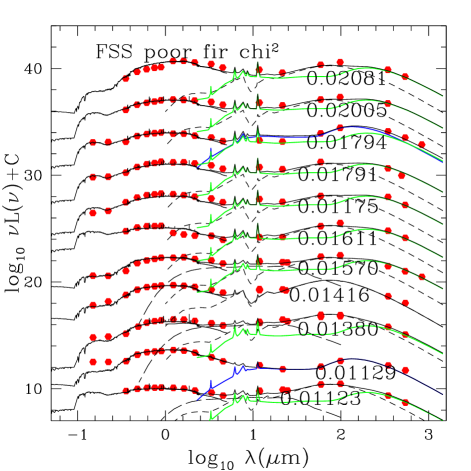
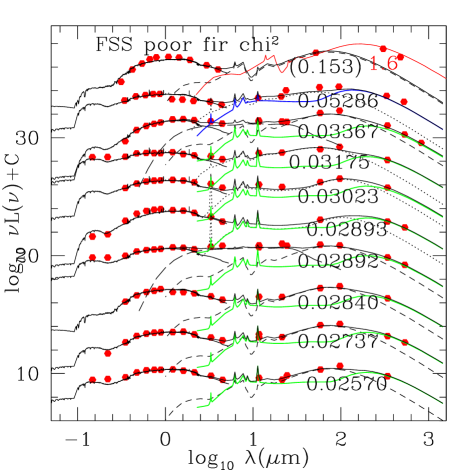
In most cases there is a need for the cold cirrus component ( = 0.1), as found previously by Rowan-Robinson et al (2010) and Planck Collaboration XVI (2011). Fig. 14 shows SEDs for 21 sources with good 350 detections, , 8 optical and near-infrared photometric bands and . A further 2 (not shown) are QSOs (3C273, OJ287), which we do not expect to be fitted by our templates. For 19 of these sources the fit is improved by adding a cold cirrus component. One source (F01464+1954) is a candidate to be a lensed galaxy.
4.1 The IRAS-Planck sources
There are 1,200 RIFSCz sources which have been matched to a Planck detection better than in at least one of the 350, 550, 850 and 1382 bands (and 2,386 sources with a planck detection in at least one band). They are also of great interest because for these sources we have the strongest constraints on their far-infrared and sub-mm spectrum.
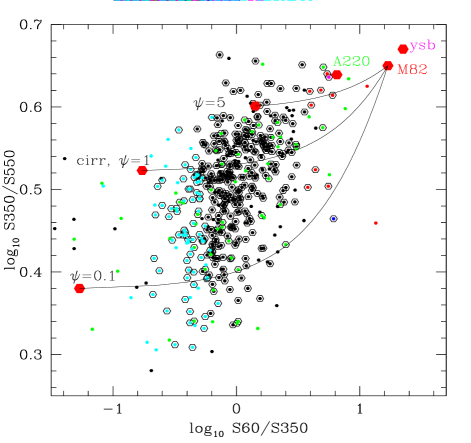
The left panel in Fig. 15 shows the 60 - 350 - 550 colour-colour diagram (S350S550 versus S60S350) for 5 Planck sources, with locations of our infrared model templates indicated. A further illustration of the need for a cold cirrus component is proved by this figure. The location of the different templates (at ) are indicated, together with a mixture line between an M82 starburst and the cold cirrus ( = 0.1) template.
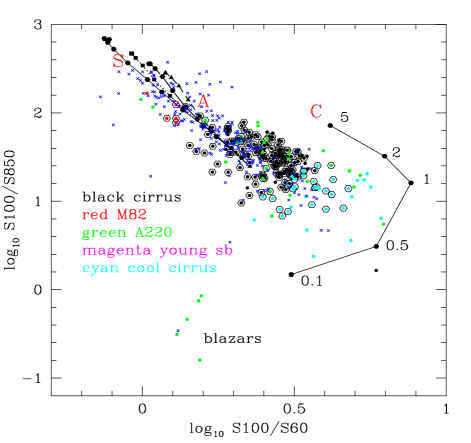
The right panel in Fig. 15 shows S100S850 versus S100S60 for RIFSCz galaxies and for a compilation of ground-based 850 detections (P. Chanial personal communication), together with model sequences of starburst and cirrus templates. The group of 6 sources at the bottom of the plot are known blazers. This figure again illustrates the need for cooler cirrus templates to explain the observed sub-millimetre fluxes.
4.2 Infrared luminosity, star-formation rate, stellar mass and dust mass
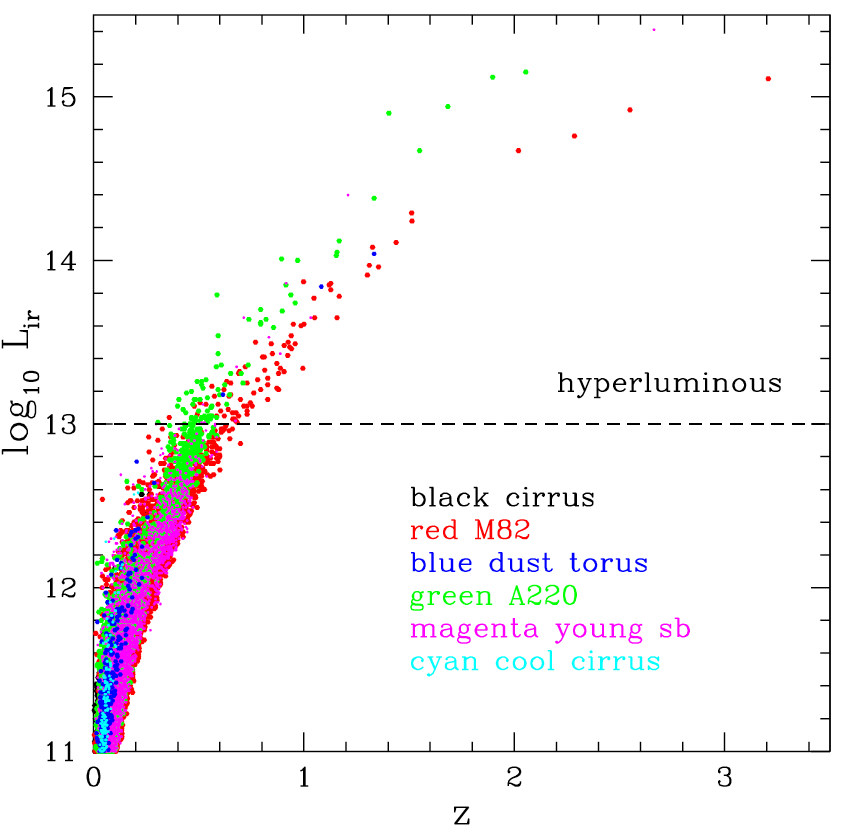
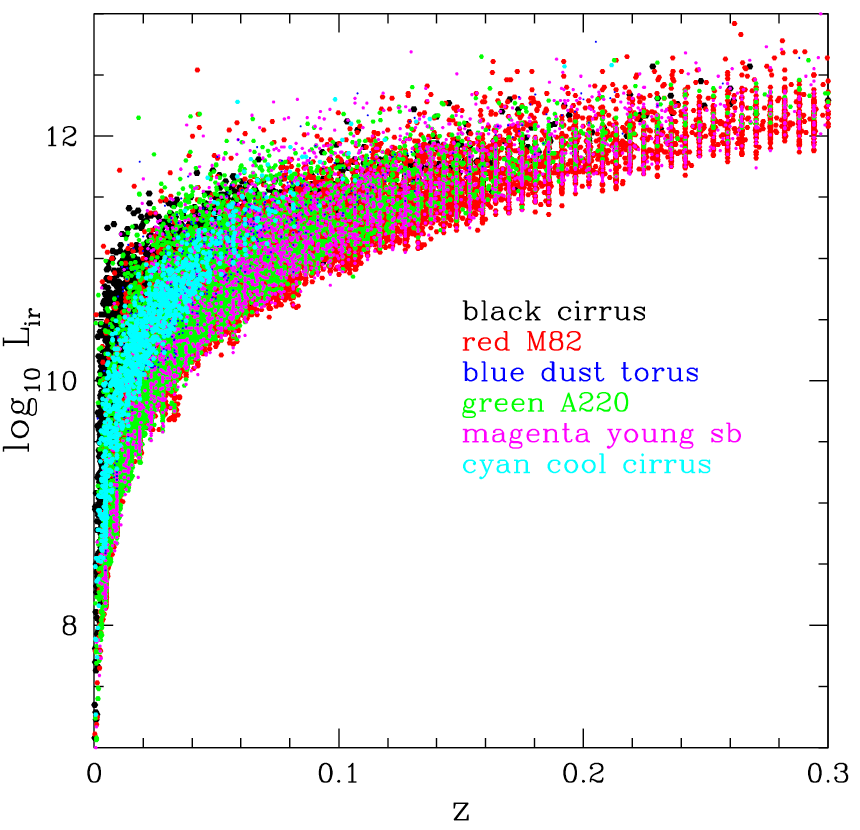
Fig. 16 shows the infrared luminosity versus redshift for the RIFSCz sources, colour-coded by infrared template type. Where sources selected cirrus templates with , or have , sources were put through a second pass with such unphysical cirrus luminosities not permitted. Many sources found acceptable fits with other templates. Those that had poor reduced in the infrared template fit may be a consequence of mis-association of the IRAS source with other catalogues, or of incorrect redshifts, or may be candidate of gravitationally lensed objects.
178 galaxies are found to by hyper-luminous () (cf Rowan-Robinson 2000), of which 61 have spectroscopic redshifts. This is very similar to the 179 found by Rowan-Robinson & Wang (2010) in the earlier version of the IIFSCz Catalogue. It would be worthwhile to obtain redshifts for the remaining 118 candidate hyper-luminous objects.
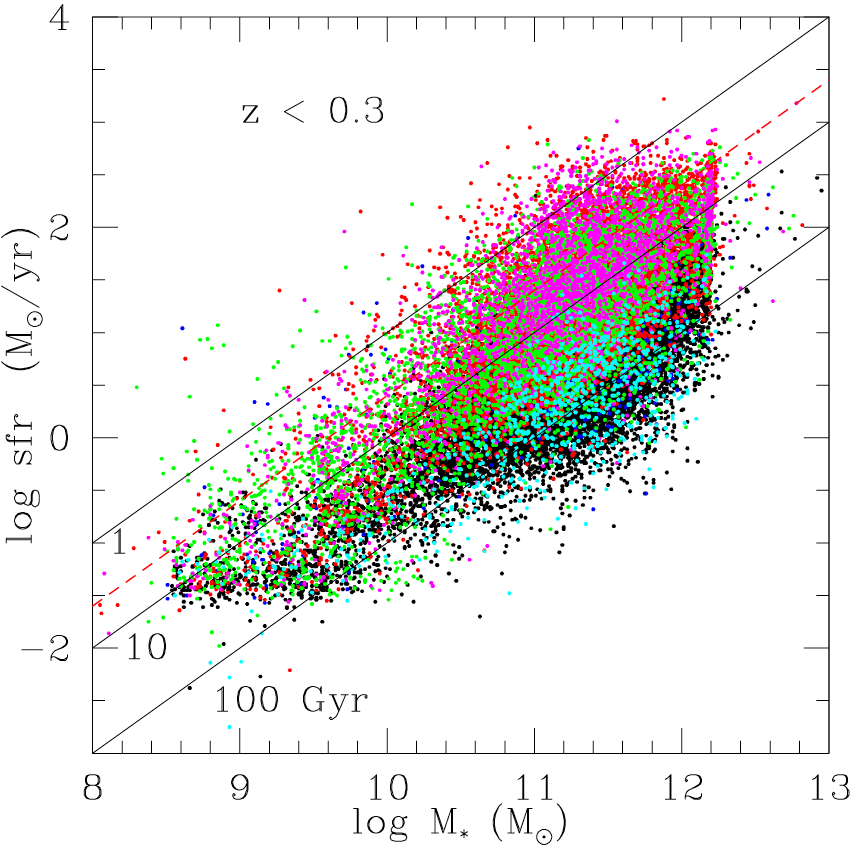
We have followed the methodology of Rowan-Robinson et al (2008) to calculate stellar masses, star-formation rates (SFR) and dust masses for the sources in our catalogue. For the sake of completeness, we briefly summarise our methodology here. We estimate the rest-frame 3.6 luminosity which is then converted to stellar mass using the ratio derived from stellar synthesis models. To estimate star-formation rate, we use the conversion recipes of Rowan-Robinson et al. (1997) and Rowan-Robinson (2001),
| (7) |
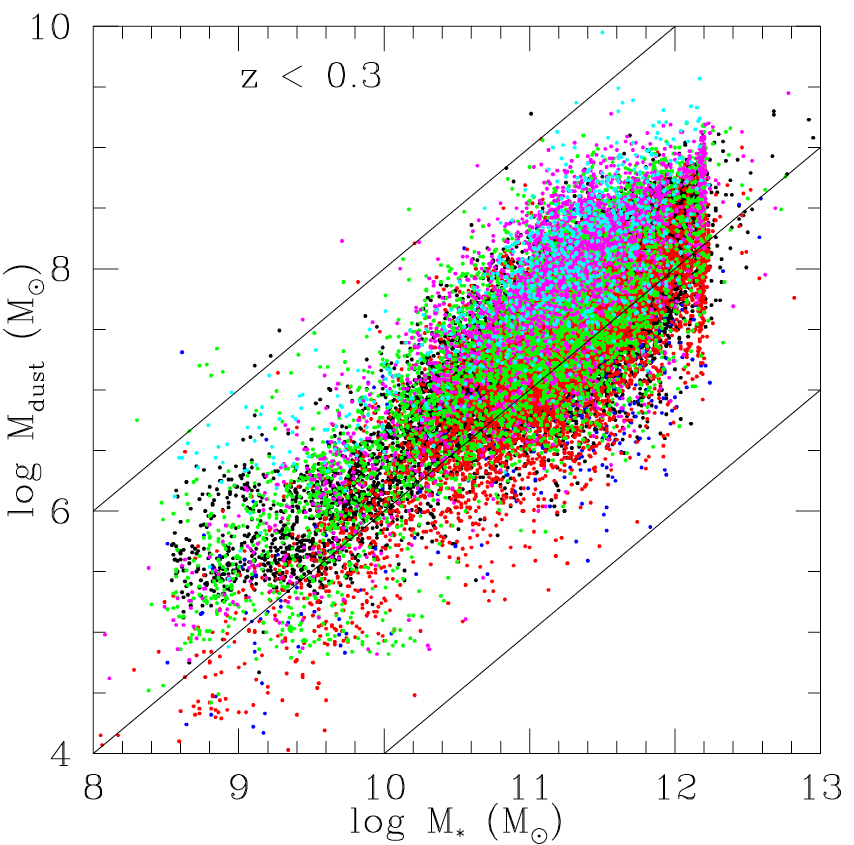
where is the fraction of UV light absorbed by dust, taken as 2/3. To estimate the approximate dust mass for each galaxy, we use radiative transfer models for cirrus, M82 and A220 starburst components and the recipe
| (8) |
where , and for cirrus, M82 and A220 respectively (A. Efstathiou, 2007, private communication). The left panel in Fig. 17 shows a plot of SFR () versus stellar mass (). Straight line loci correspond to the time-scales to make this mass of stars, forming stars at this rate. While many galaxies are forming stars at a rate broadly consistent with that required to generate the observed stellar mass over 10 Gyr, most local galaxies lie to the right of the 10 Gyr line and must have formed stars at a higher rate at some time in the past. The zone occupied by our complete and all-sky sample of local quiescent galaxies, lies to the right of the “main-sequence” locus of Elbaz et al (2011) and of the 10 Gyr line, consistent with the fact that these galaxies are forming stars at a much lower rate than they did in the past (at ). Galaxies in Fig. 17 have been colour-coded by their dominant infrared template type as in Fig. 13. The quiescent, optically thin galaxies, i.e. those whose SEDs are dominated by cirrus, lie on the right edge of the distribution, while galaxies whose infrared SEDs are dominated by starbursts lie to the left, with higher specific star-formation rate. The right panel in Fig. 17 shows dust mass versus stellar mass, with most galaxies having in the range to . Galaxies dominated by cool cirrus templates tend to require higher specific dust masses.
5 Conclusions and discussions
To summarise, the RIFSCz contains a total of 60,303 galaxies, of which have spectroscopic redshifts from NED, FSSz, PSCz, 6dF and the SDSS spectroscopic DR10 survey and of which have photometric redshifts from the template-fitting method. At a flux limit of S60 = 0.36 Jy which is the completeness limit of the FSC, more than of the galaxies in the RIFSCz have either spectroscopic or photometric redshifts.The RIFSCz covers about of the whole sky. In Fig. 18, the sky distribution in Galactic coordinates is plotted for all galaxies in the RIFSCz with either spectroscopic or photometric redshift and galaxies without any redshift estimate.
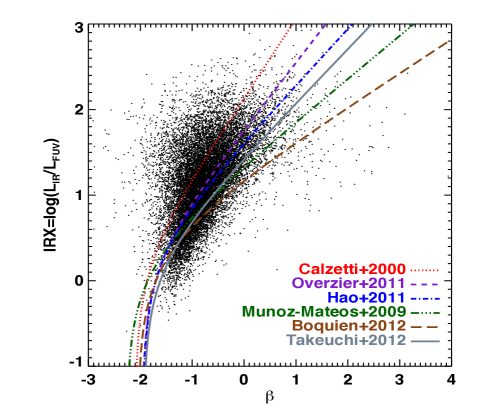
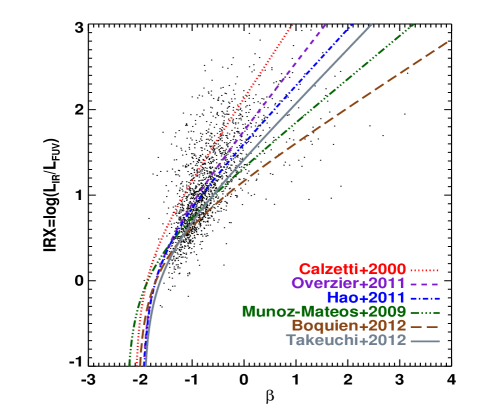
The RIFSCz catalogue represents the best all-sky far-infrared (60 ) selected galaxy catalogue with multi-wavelength photometric information. As a result, several extragalactic science programmes can be carried out with the RIFSCz dataset. For example, we can examine the relation between the ratio of the infrared to UV luminosity (the infrared excess: IRX) and the slope of the UV spectrum (). This relation is critical to estimating the dust attenuation in galaxies and hence the true star-formation rate. In the top panel in Fig. 19, we plot IRX versus for RIFSCz galaxies with GALEX UV detections at SNR and the reduced of the infrared SED fit . The typical statistical error of the infrared luminosity () for these galaxies is about 0.3 dex. In the bottom panel in Fig. 19, we plot IRX versus for a subset of the galaxies in the top panel which are detected at 350 by Planck. The typical statistical error of for this subset of galaxies with 350 is around 0.1 dex. Our values are derived using the recipe from Kong et al. (2004). A compilation of the IRX - relations published in the literature is also plotted. The Calzetti et al. (2000) and Overzier et al. (2011) relations are derived from UV-selected samples. The Boquien et al. (2012) relation is derived from a -band selected sample. The Muñoz-Mateos et al. (2009) relation is derived from the SINGS sample (Kennicutt et al. 2003) which consists of 75 local galaxies spanning a large range in morphology, luminosity, SFR and opacity. The Hao et al. (2011) relation is derived from the SINGS sample combined with a sample of local galaxies covering the full range of optical spectral characteristics (Moustakas & Kennicutt 2006). It is clear that there is a large dispersion among the different relations derived from samples with different selection criteria and our far-infrared selected sample show a general good agreement with these relations. In addition, our far-infrared selected sample also seems to cover regions with high IRX but low values which are not represented in other relations. Detailed investigations are required to fully understand the causes of the difference between our IRX - relation based on far-infrared selection and the other relations. However, it is beyond the scope of this paper.
We provide a long version and a short version of the RIFSCz to the public, available from http://astro.ic.ac.uk/public/mrr/fss/readme and http://www.astro.dur.ac.uk/~lwang83/RIFSCz.tar.gz. The long version contains all the information (e.g. positional, photometric or spectroscopic) we have either assembled or derived in the process of constructing the RIFSCz. Then short version contains the most important information of the sources in the RIFSCz and should suffice for most users. The format of the long and short version of the RIFSCz catalogue is explained in detail in the Appendix.
We have presented the revised IRAS-FSC Redshift Catalogue (RIFSCz). It contains 60,303 galaxies selected at 60 from the IRAS Faint Source Catalog, covering around of the whole sky. The process of retrieving spectroscopic redshifts, multi-wavelength source identification and photometric redshift estimation is described in detail. Users should be aware of issues such as the intrinsic IRAS FSC completeness limit, the redshift completeness variations across the sky and the varying quality of photometric redshifts derived for different subsets of the catalogue.


ACKNOWLEDGEMENTS
LW and PN acknowledge support from an ERC StG grant (DEGAS-259586). PN also acknowledges the support of the Royal Society through the award of a University Research Fellowship.
The NASA/IPAC EXTRAGALACTIC DATABASE (NED) is operated by the JET PROPULSION LABORATORY, CALTECH, under contract with the NATIONAL AERONAUTICS AND SPACE ADMINISTRATION.
Funding for the Sloan Digital Sky Survey (SDSS) and SDSS-II has been provided by the Alfred P. Sloan Foundation, the Participating Institutions, the National Science Foundation, the U.S. Department of Energy, the National Aeronautics and Space Administration, the Japanese Monbukagakusho, and the Max Planck Society, and the Higher Education Funding Council for England. The SDSS Web site is http://www.sdss.org/.
The SDSS is managed by the Astrophysical Research Consortium (ARC) for the Participating Institutions. The Participating Institutions are the American Museum of Natural History, Astrophysical Institute Potsdam, University of Basel, University of Cambridge, Case Western Reserve University, The University of Chicago, Drexel University, Fermilab, the Institute for Advanced Study, the Japan Participation Group, The Johns Hopkins University, the Joint Institute for Nuclear Astrophysics, the Kavli Institute for Particle Astrophysics and Cosmology, the Korean Scientist Group, the Chinese Academy of Sciences (LAMOST), Los Alamos National Laboratory, the Max-Planck-Institute for Astronomy (MPIA), the Max-Planck-Institute for Astrophysics (MPA), New Mexico State University, Ohio State University, University of Pittsburgh, University of Portsmouth, Princeton University, the United States Naval Observatory, and the University of Washington.
Funding for SDSS-III has been provided by the Alfred P. Sloan Foundation, the Participating Institutions, the National Science Foundation, and the U.S. Department of Energy Office of Science. The SDSS-III web site is http://www.sdss3.org/.
SDSS-III is managed by the Astrophysical Research Consortium for the Participating Institutions of the SDSS-III Collaboration including the University of Arizona, the Brazilian Participation Group, Brookhaven National Laboratory, Carnegie Mellon University, University of Florida, the French Participation Group, the German Participation Group, Harvard University, the Instituto de Astrofisica de Canarias, the Michigan State/Notre Dame/JINA Participation Group, Johns Hopkins University, Lawrence Berkeley National Laboratory, Max Planck Institute for Astrophysics, Max Planck Institute for Extraterrestrial Physics, New Mexico State University, New York University, Ohio State University, Pennsylvania State University, University of Portsmouth, Princeton University, the Spanish Participation Group, University of Tokyo, University of Utah, Vanderbilt University, University of Virginia, University of Washington, and Yale University.
This publication makes use of data products from the Two Micron All Sky Survey, which is a joint project of the University of Massachusetts and the Infrared Processing and Analysis Center/California Institute of Technology, funded by the National Aeronautics and Space Administration and the National Science Foundation.
This publication makes use of data products from the Wide-field Infrared Survey Explorer, which is a joint project of the University of California, Los Angeles, and the Jet Propulsion Laboratory/California Institute of Technology, funded by the National Aeronautics and Space Administration.
Appendix A The long version of the RIFSCz catalogue
Notes on the catalogue columns for the long version:
Col 1 - 7. IRAS FSC source name, GALEX source ID, SDSS object ID, 2MASS XSC source designation, WISE source designation, Planck source name and NED source name.
Col 8 - 10. SDSS type, NED type, stellar flag (1= galaxy/extended, -1 = stellar/QSO, and 0 = unknown).
Col 11 - 22. IRAS FSC positions, SDSS positions, 2MASS XSC positions, WISE positions, Planck positions and NED positions.
Col 23 - 25. Recommended position and positional flag (1=SDSS, 2=2MASS, 3=WISE, 4=NED, 5=FSC and prioritised in the same order).
Col 26 - 28. SDSS spectroscopic redshift, 2MRS redshift, and NED redshift.
Col 29 - 30. Recommended spectroscopic redshift and flag (1SDSS, 2PSCz, 3FSSz, 46dF, 5NED and 62MRS). The priority order is NEDSDSS2MRSPSCzFSSz6dF.
Col 31. Template-fitting photometric redshift for sources with optical or near-infrared photometry
Col 32. Recommended redshift which is equal to spectroscopic redshift if it is available or photometric redshift if it has optical or near-infrared photometry but without spectroscopic redshift.
Col 33 - 37. The number of optical and near-infrared bands used in the photometric redshift fit, optical galaxy template type, extinction AV from the optical galaxy template fit, reduced of the best redshift fit, and the absolute B magnitude.
Col 38 - 41. GALEX far-UV flux and error, GALEX near-UV flux and error.
Col 42 - 51. SDSS magnitudes and errors at u, g, r, i, z
Col 52 - 57. 2MASS PSC magnitudes and errors at J, H, Ks.
Col 58 - 63. 2MASS XSC magnitudes and errors at J, H, Ks.
Co 64 - 71. WISE magnitudes and errors at 3.4, 4.6, 12 and 22 ,
Col 72 - 79. IRAS fluxes and quality flags at 12, 25, 60 and 100 ,
Col 80 - 87. Planck fluxes and errors at 350, 550, 850 or 1382 .
Col 88 - 89. Integrated 1.4 GHz flux density and error.
Col 90. Aperture correction.
Col 91 - 102. Aperture corrected ugriz, 2MASS J, H, and Ks, and WISE 3.4, 4.6, 12 and 22 fluxes.
Col 103 - 106. Redshift flag (1=spectroscopic redshift, 2=photometric redshift, 3=no redshift), Infrared template type (1=cirrus, 2=M82, 3=A220, 4=AGN dust torus, 5=young starburst, 6=cool cirrus), reduced for the IR template fit, number of photometric bands used in the IR template fit
Col 107 - 112. Fraction of contribution at 60 of each of the six IR templates.
Col 113 - 118. Fraction of IR luminosity in each of the six IR templates
Col 119. Total IR luminosity.
Col 120 - 133. Predicted infrared and sub-mm fluxes at 12, 25, 60, 90, 100, 110, 140, 160, 250, 350, 550, 850, 1250 and 1380 based on the best-fit infrared template.
Col 134 - 136. Stellar mass, SFR, dust mass.
Col 137 - 221 array of reduced , minimised over all templates, in bins of 0.01 in , from 0 to 0.85.
Appendix B The short version of the RIFSCz catalogue
Notes on the catalogue columns for the short version:
Col 1. IRAS FSC source name.
Col 2. Stellar flag (1= galaxy/extended, -1 = stellar/QSO, and 0 = unknown).
Col 3 - 5. Recommended position and positional flag (1=SDSS, 2=2MASS, 3=WISE, 4=NED, 5=FSC and prioritised in the same order).
Col 6 - 7. Recommended spectroscopic redshift and flag (1SDSS, 2PSCz, 3FSSz, 46dF, 5NED and 62MRS). The priority order is NEDSDSS2MRSPSCzFSSz6dF.
Col 8. Template-fitting photometric redshift for sources with optical or near-infrared photometry
Col 9. Recommended redshift which is equal to spectroscopic redshift if it is available or photometric redshift if it has optical or near-infrared photometry but without spectroscopic redshift.
Col 10 - 14. The number of optical and near-infrared bands used in the photometric redshift fit, optical galaxy template type, extinction AV from the optical galaxy template fit, reduced of the best redshift fit, and the absolute B magnitude.
Col 15 - 18. GALEX far-UV flux and error, GALEX near-UV flux and error.
Col 19 - 28. SDSS magnitudes and errors at u, g, r, i, z
Col 29 - 34. 2MASS PSC magnitudes and errors at J, H, Ks.
Col 35 - 40. 2MASS XSC magnitudes and errors at J, H, Ks.
Co 41 - 48. WISE magnitudes and errors at 3.4, 4.6, 12 and 22 ,
Col 49 - 56. IRAS fluxes and quality flags at 12, 25, 60 and 100 ,
Col 57 - 64. Planck fluxes and errors at 350, 550, 850 or 1382 .
Col 65 - 66. Integrated 1.4 GHz flux density and error.
Col 67 - 78. Aperture corrected ugriz, 2MASS J, H, and Ks, and WISE 3.4, 4.6, 12 and 22 fluxes.
Col 79 - 82. Redshift flag (1=spectroscopic redshift, 2=photometric redshift, 3=no redshift), Infrared template type (1=cirrus, 2=M82, 3=A220, 4=AGN dust torus, 5=young starburst, 6=cool cirrus), reduced for the IR template fit, number of photometric bands used in the IR template fit
Col 83 - 88. Fraction of contribution at 60 of each of the six IR templates.
Col 89 - 94. Fraction of IR luminosity in each of the six IR templates
Col 95. Total IR luminosity.
Col 96 - 109. Predicted infrared and sub-mm fluxes at 12, 25, 60, 90, 100, 110, 140, 160, 250, 350, 550, 850, 1250 and 1380 based on the best-fit infrared template.
Col 110 - 112. Stellar mass, SFR, dust mass.
References
- Ahn et al. (2013) Ahn, C. P., Alexandroff, R., Allende Prieto, C., et al. 2013, arXiv:1307.7735
- Boquien et al. (2012) Boquien, M., Buat, V., Boselli, A., et al. 2012, A&A, 539, A145
- Brusa et al. (2007) Brusa, M., Zamorani, G., Comastri, A., et al. 2007, ApJS, 172, 353
- Budavári et al. (2009) Budavári, T., Heinis, S., Szalay, A. S., et al. 2009, ApJ, 694, 1281
- Calzetti et al. (2000) Calzetti, D., Armus, L., Bohlin, R. C., et al. 2000, ApJ, 533, 682
- Chapin et al. (2011) Chapin, E. L., Chapman, S. C., Coppin, K. E., et al. 2011, MNRAS, 411, 505
- Efstathiou et al. (2000) Efstathiou, A., Rowan-Robinson, M., & Siebenmorgen, R. 2000, MNRAS, 313, 734
- Efstathiou & Rowan-Robinson (2003) Efstathiou, A., & Rowan-Robinson, M. 2003, MNRAS, 343, 322
- Elbaz et al. (2011) Elbaz, D., Dickinson, M., Hwang, H. S., et al. 2011, A&A, 533, A119
- Hao et al. (2011) Hao, C.-N., Kennicutt, R. C., Johnson, B. D., et al. 2011, ApJ, 741, 124
- Heinis et al. (2009) Heinis, S., Budavári, T., & Szalay, A. S. 2009, ApJ, 705, 739
- Huchra et al. (2012) Huchra, J. P., Macri, L. M., Masters, K. L., et al. 2012, ApJS, 199, 26
- Jarrett et al. (2000) Jarrett, T. H., Chester, T., Cutri, R., et al. 2000, AJ, 119, 2498
- Jones et al. (2004) Jones, D. H., Saunders, W., Colless, M., et al. 2004, MNRAS, 355, 747
- Jones et al. (2005) Jones, D. H., Saunders, W., Read, M., & Colless, M. 2005, PASA, 22, 277
- Kennicutt et al. (2003) Kennicutt, R. C., Jr., Armus, L., Bendo, G., et al. 2003, PASP, 115, 928
- Kong et al. (2004) Kong, X., Charlot, S., Brinchmann, J., & Fall, S. M. 2004, MNRAS, 349, 769
- Moshir et al. (1992) Moshir, M., Kopman, G., & Conrow, T. A. O. 1992, Pasadena: Infrared Processing and Analysis Center, California Institute of Technology, 1992, edited by Moshir, M.; Kopman, G.; Conrow, T. a.o.,
- Moustakas & Kennicutt (2006) Moustakas, J., & Kennicutt, R. C., Jr. 2006, ApJS, 164, 81
- Muñoz-Mateos et al. (2009) Muñoz-Mateos, J. C., Gil de Paz, A., Boissier, S., et al. 2009, ApJ, 701, 1965
- Overzier et al. (2011) Overzier, R. A., Heckman, T. M., Wang, J., et al. 2011, ApJ, 726, L7
- Planck Collaboration et al. (2011) Planck Collaboration, Ade, P. A. R., Aghanim, N., et al. 2011, A&A, 536, A16
- Planck Collaboration et al. (2013) Planck Collaboration, Ade, P. A. R., Aghanim, N., et al. 2013, arXiv:1303.5062
- Planck Collaboration et al. (2013) Planck Collaboration, Ade, P. A. R., Aghanim, N., et al. 2013, arXiv:1303.5088
- Rice et al. (1988) Rice, W., Lonsdale, C. J., Soifer, B. T., et al. 1988, ApJS, 68, 91
- Rodighiero et al. (2011) Rodighiero, G., Daddi, E., Baronchelli, I., et al. 2011, ApJ, 739, L40
- Rowan-Robinson et al. (2005) Rowan-Robinson, M., Babbedge, T., Surace, J., et al. 2005, AJ, 129, 1183
- Rowan-Robinson et al. (2008) Rowan-Robinson M. et al, 2008, MNRAS 386, 687
- Rowan-Robinson & Efstathiou (2009) Rowan-Robinson M. and Efstathiou A., 2009, MNRAS 399, 615
- Rowan-Robinson & Wang (2010) Rowan-Robinson, M., & Wang, L. 2010, MNRAS, 406, 720
- Rowan-Robinson et al. (2010) Rowan-Robinson, M., Roseboom, I. G., Vaccari, M., et al. 2010, MNRAS, 409, 2
- Rowan-Robinson et al. (2013) Rowan-Robinson M. et al, 2013, MNRAS 428, 1958
- Salpeter (1955) Salpeter, E. E. 1955, ApJ, 121, 161
- Saunders et al. (2000) Saunders, W., Sutherland, W. J., Maddox, S. J., et al. 2000, MNRAS, 317, 55
- Skrutskie et al. (2006) Skrutskie, M. F., Cutri, R. M., Stiening, R., et al. 2006, AJ, 131, 1163
- Spoon et al. (2007) Spoon, H. W. W., Marshall, J. A., Houck, J. R., et al. 2007, ApJ, 654, L49
- Sutherland & Saunders (1992) Sutherland, W., & Saunders, W. 1992, MNRAS, 259, 413
- Takeuchi et al. (2012) Takeuchi, T. T., Yuan, F.-T., Ikeyama, A., Murata, K. L., & Inoue, A. K. 2012, ApJ, 755, 144
- Wang & Rowan-Robinson (2009) Wang, L., & Rowan-Robinson, M. 2009, MNRAS, 398, 109
- Wang & Rowan-Robinson (2010) Wang, L., & Rowan-Robinson, M. 2010, MNRAS, 401, 35
- Wang et al. (2013) Wang, L., et al. 2013, arxiv:1312.0552
- Wright et al. (2010) Wright, E. L., Eisenhardt, P. R. M., Mainzer, A. K., et al. 2010, AJ, 140, 1868
- Yan et al. (2013) Yan, L., Donoso, E., Tsai, C.-W., et al. 2013, AJ, 145, 55
- York et al. (2000) York, D. G., Adelman, J., Anderson, J. E., Jr., et al. 2000, AJ, 120, 1579