Fully Gapped s-wave-like Superconducting State and Electronic Structures in the Ir0.95Pd0.05Te2 Single Crystals with Strong Spin-orbital Coupling
Abstract
Due to the large spin-orbital coupling in the layered 5d-transition metal chalcogenides compound, the occurrence of superconductivity in doped Ir2-xPdxTe2 offers a good chance to search for possible topological superconducting states in this system. We did comprehensive studies on the superconducting properties and electronic structures of single crystalline Ir0.95Pd0.05Te2 samples. The superconducting gap size, critical fields and coherence length along different directions were experimentally determined. Macroscopic bulk measurements and microscopic low temperature scanning tunneling spectroscopy results suggest that Ir0.95Pd0.05Te2 possesses a BCS-like s-wave state. No sign of zero bias conductance peak were found in the vortex core at 0.4K.
As a new quantum state of matter, topological insulators (TIs) were theoretically proposed involving band inversion due to strong spin-orbital coupling (SOC) and experimentally discovered in compounds with high-Z elements such as HgTe, Bi-based compounds, Sb2Te3Hasan ; Shoucheng ; HgTe ; BiSb ; BiSe ; BiTe ; SbTe and so on. Very soon after the discovery of TIs, extensive studies have being carried out in topological matters and topological phenomenon. One of the important topological states is so called topological superconductors (TSCs)Shoucheng ; Schnyder ; Qi , in which the zero-energy mode of Majorana Fermion that is proposed to be useful in topological quantum computation may harborFuliang . Previously, the most expected TSC is unconventional p-wave superconductor Sr2RuO4SrRuO1 ; SrRuO2 . After the conception of topological insulators, many effects for searching the possible TSCs have been put on the superconductors with large spin-orbital coupling. The possible candidates include Cu-intercalated topological insulator CuxBi2Se3Fuliang2 ; AndrewPRB , In-doped SnTeAndoSnTe and so on. Some signs of zero energy conductance peaks that maybe related to Majorana Fermion were observed AndoCuBiSe ; AndoSnTe ; MFScience . Recently, superconductivity was realized in a layered chalcogenide with high-Z elements: IrTe2 with Pd, Pt and CuPdIrTe ; PtIrTe ; CuIrTe ; Lishiyan substitution or intercalations. Because of the large SOC in this material, it becomes a possible candidate of TSCPdIrTe . Though IrTe2 is a layered compound, it is different from typical layered transitional metal dichalcogenides, IrTe2 layers are bonded to each other by significant Te-Te bonding rather than weak Van der Waals force. IrTe2 undergoes a structural phase transition from trigonal phase to triclinic phase at temperature of 270 Kstructure ; PdIrTe . The origin of structure transition is still under debate. Fermi surface (FS) nesting, the Rice-Scott saddle-point mechanism, orbital-induced Peierls instability, crystal field effects, the interlayer hybridization states, the local bonding instability and the anionic depolymerization transition have been proposedDing . With intercalation or substitution at the Ir sites of some nonmagentic elements, the structural transition can be suppressed and bulk superconductivity is induced with Tc up to 3 K. It’ll be very interesting to know the details of superconducting state and how the electronic structures evolve in this system. In this letter, the superconducting properties and electronic structures in the Ir0.95Pd0.05Te2 single crystals were studied by means of dc magnetic susceptibility, electrical resistance, band structure measurements and scanning tunnelling microscopy and spectroscopy (STM/STS) measurements. The superconducting gap size, coherence length, vortex states and band structures were experimental determined directly. We find that Ir0.95Pd0.05Te2 has a fully gapped weak-coupling BCS s-wave-like superconducting state and nearly identical low energy band structure as parent compound IrTe2. No zero bias conductance peak was detected in the vortex core, so topological superconducting state can be rule out in this system at 0.4K.
High quality single crystals of Ir0.95Pd0.05Te2 were grown using the chemical vapor transport method with iodine as a carrier agent. Doped samples were grown in a single step process in which iridium(99.99%), tellurium(99.999%), palladium(99.95%), and iodine powders (99.99%) according to the stoichiometric ratio were sealed in an evacuated fused silica ampoule. They were grown with a temperature gradient of 60 with the hot end held at 880. The sample size is about 1mm1mm0.2mm. As a comparison, parent compound IrTe2 single crystals were grown out of Te flux using the same method as the previous worksNLWang ; PtIrTe . The crystal structure was checked by x-ray diffraction (XRD) (Bruker) with Cu Kα line. The angle-resolved photoemission spectroscopy (ARPES) measurements were performed using 40 - 120 eV photons at Advanced Light Source beamlines 4.0.3 using Scienta R4000 analyzers with base pressures better than 510-11 torr. Energy resolution is better than 15 meV and angular resolution is better than 0.02 Å-1. Low temperature STM/STS experiments were carried out in ultrahigh vacuum with a base pressure better than 110-10 Torr. Tungsten tips are used for STM/STS measurements. The dI/dV data of superconducting gaps were obtained via lock-in technique with modulation signal voltage 0.05 mV with a frequency of 985 Hz. The samples are cleaved in situ at 30K as well as at room temperature. The dc magnetization measurements were performed on a Quantum Design Physical Property Measurement System (PPMS). Temperature and magnetic fields dependent resistance measurements were carried out in the PPMS using the standard four-point probe technique with silver paste used for the contacts.
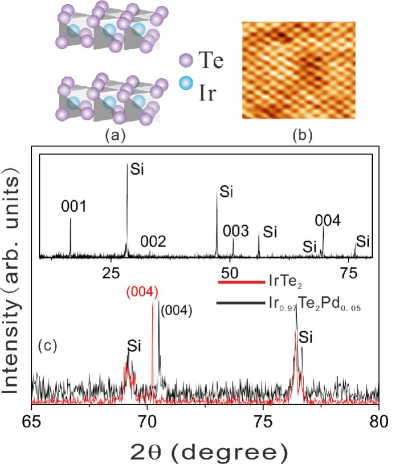
Figure 1 shows the crystal structure of IrTe2 and the XRD spectra from the doped and the undoped crystals. Seen from Fig. 1(c), except the Si reference peak, all the diffraction peaks can be indexed by peaks according to Pm1 structure from Ir1-xPdxTe2 with FWHM less then 0.05 degree which indicates the high crystalline quality of the samples. Si reference peaks were used to correct the system error. The (004) peaks were used to calculate the c-axis lattice constant. Based on Bragg condition, the calculated c-axis lattice constant is 5.386 Å and 5.372 Å for IrTe2 and Ir1.95Pb0.05Te2, respectively. After x=0.05 Pd doping, the lattice contracts by 0.26% that is consistent with the Pd-Te substitution known from the powder samplesPdIrTe . After cleaving, the surface is Te-terminated. Fig. 1(b) shows well-ordered hexagonal lattice on the surface.
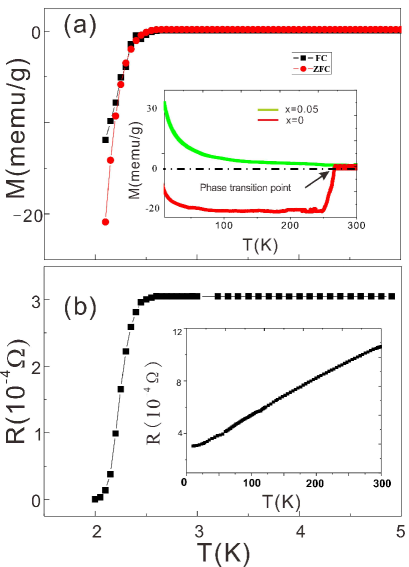
Typical low-temperature dc magnetic signal and electrical resistance of Ir0.95Pd0.05Te2 samples are shown in Fig. 2. A diamagnetic behavior, characteristic of superconducting state, is observed below 2.5K. The magnetization signal obtained at 2.1 K is about 60 of that expected for full diamagnetism. This represents a conservative lower limit to the true superconducting volume fraction because the diamagnetic magnetization is still decreasing steeply at the temperature where the field is applied for the zero field cooling measurement. Figure 2b shows the temperature dependence of the resistance of , measured in the ab plane. Consistent with magnetic measurement, resistance of the sample decreases at 2.5K and reaches zero at 2K, suggesting bulk superconductivity. As presented in the insert of Fig. 2(a), with x=0.05 Pd substitution the magnetic signal increases monotonically in the doped samples with the decrease of temperature under the magnetic filed of 2T. The structure phase transition is completely suppressed in Ir0.95Pd0.05Te2, while IrTe2 shows a sharp transition at 270KPdIrTe , marked by black arrow.
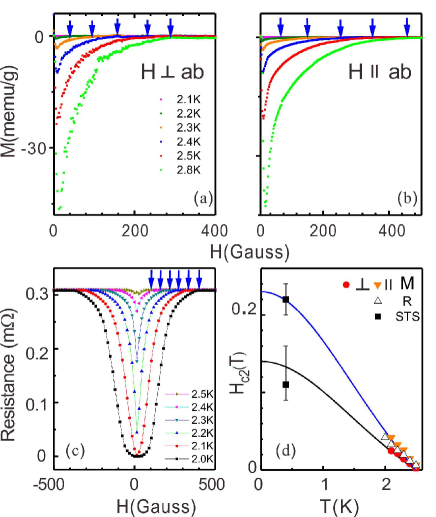
Detailed measurements of the magnetic signals and the resistance as a function of magnetic fields are presented in Fig. 3. Fig. 3(a) and (b) show the magnetization curves at different temperature (from 2.1K to 2.8K) along out-of-plane( and in-plane() direction, respectively. Seen from the magnetization curves, has typical type-II superconductor behavior. As shown in the Fig. 3(a,b), the blue arrows mark the position of and where diamagnetic signals disappear at different temperature. In the resistance data (Fig. 3c), the upper critical field was defined at the superconducting onset temperature. Fig. 3(d) summaries the Hc2 as a function of temperature. The linear temperature dependence close to is obtained for , suggesting the dominance of only one type of bulk carrier, which is consistent with ARPES measurement shown below. The solid line is the fitting to Werthamer-Helfand-Hohenberg (WHH) theory based on the magnetic measurements. We obtained the upper critical field at zero temperature =0.160.05 T and =0.33 0.05 T. From , the coherence length is obtained, while from we use and obtain . So the dimensionless anisotropy parameter 2, which is smaller than another layered superconductor NbSe2 (3).
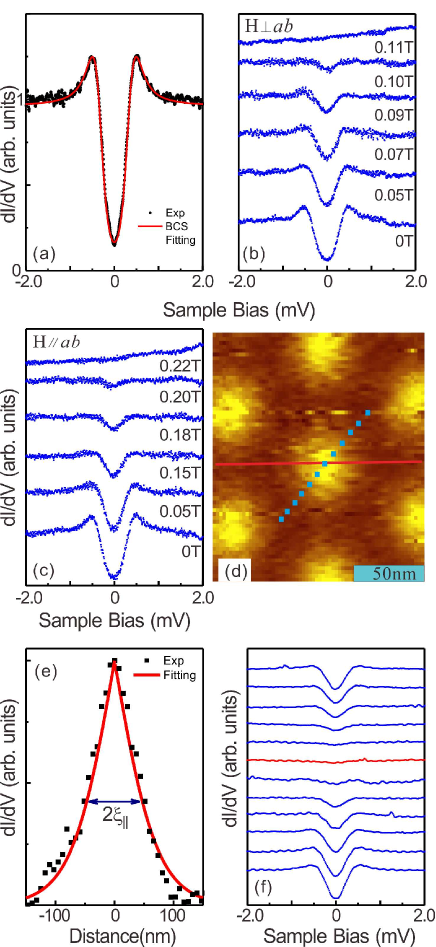
The properties of the superconducting state are further explored by low temperature STM/STS. Fig. 4(a) shows the typical STS spectra obtained on the cleaved surface at 0.4K. Well-defined coherence peaks corresponding to the superconducting state was observed clearly. The STS spectra can be nicely fitted using BCS-type s-wave formula, which gives a superconducting gap of 0.360.02 meV at 0.4K. Assuming the gap follows BCS theory, =, we get 0.390.02 meV, yielding the BCS ratio 2/kBTc 3.6. This value indicates a weak-coupling BCS-type superconductor (for weak coupling limit s-wave, BCS ratio 3.5). The STS spectra as a function of applied magnetic fields are shown in Fig. 4(b) and 4(c). With the increase of applied magnetic field, the coherence peak faded away gradually. The energy gap disappears at about 0.11 T and 0.22 T when magnetic filed perpendicular or parallel to ab plane. It is worth noting that these two values are position dependent due to the existence of the vortex (vortices are shown in Fig. 4(d)) and the variation is much smaller when the magnetic field is applied in the ab plane. Nevertheless, the upper critical fields obtained in STS are well consistent with macroscopic bulk measurements as shown in Fig. 3(d). Superconducting vortex was observed by STS mapping. Fig. 4(d) shows the vortex with nice close-packed arrangement. From the size of the vortex, as shown in fig. 4(e), the in plane coherence length of 51 5 nm is obtained from the fitting of the line profile (red line in Fig. 4d) of the vortex, which is nearly consistent with the value from the bulk magnetic measurement. Small BCS ratio, s-wave-like gap function and long coherence length suggest that Ir0.95Pd0.05Te2 is a fully gapped and weak coupling BCS-type s-wave superconductor. In addition, we carefully checked the STS at different position of vortex as shown in Fig. 4(f). Red curve in Fig. 4(f) is collected right at the center of a vortex. Outside the vortex, there is superconducting gap and gap closes at the center of the vortex. Under our experimental temperature (0.4K), no sign of zero bias conductance peak was observed at any position of vortex, which means even if there will be non-trivial superconducting states, much lower temperature is needed. From the STS measurement, we think we can rule out the possibility of topological superconducting state in this system at 0.4K.
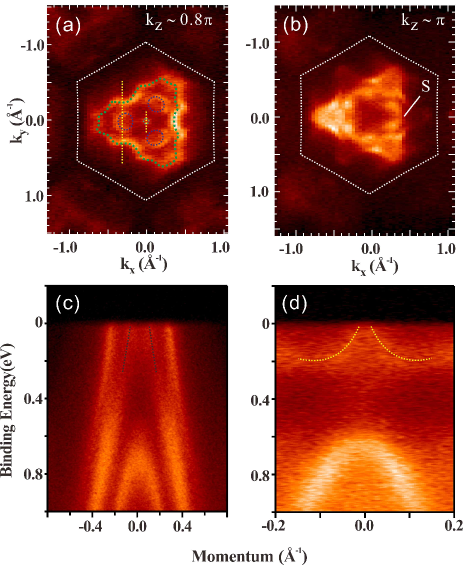
Finally, the electronic structures of Ir0.95Pd0.05Te2 are studied by ARPES. Same as IrTe2, the energy bands of Ir0.95Pd0.05Te2 show strong kz dispersion. By tuning incident photon energy, we can change the detectable momentum along the normal direction (kz). In-plane FS at different kz was obtained by integrating the spectra weight with an energy window of 15 meV at Fermi energy. Changing of FS topology was observed in previous studies in IrTe2 below and above the phase transition temperatureJAP ; Ding . Fig. 5(a) shows the FS of Ir0.95Pd0.05Te2 measured at 30K overlaid with the room temperature FS (green and blue dotted lines) of IrTe2 from reference [24] at the exactly same kz ( 0.8) point using 90eV photon energy. Clearly, after Pd substitution, the FS of superconducting samples at low temperature is the same as that of IrTe2 at room temperature. There are one outer big FS, three small Fermi pockets and a tiny Fermi pocket around zone center. Meanwhile, the three small Fermi pockets (blue dotted lines in Fig. 5-a) disappear at 30K in IrTe2 samplesDing . Fig. 5(c) and (d) show energy bands along the direction indicated by the yellow dotted lines in Fig. 5(a). Known from the band mapping, all the FSs are formed by hole-like bands. Since Ir0.95Pd0.05Te2 has no phase transition but has identical FS as that of the IrTe2 sample above phase transition temperature, it implies that itinerant origin such as FS nesting or saddle point nesting may not play key roles for the phase transition in this system. Phase transition is more likely related to local phenomena. For example, the depolymerization-polymerization of Te bonds was proposed to be involved in the phase transitionDem . And it was also proposed that Ir 5d orbital reconstruction governed the charge and orbital instability in IrTe2PtIrTe . In addition, charge modulation originated from the periodic dimerization of Te atoms was observed in previous STM expereimentsWu . Fig. 5(b) presents the FS near point. At this kz point, saddle point (marked as ”S” in the figure) observed in IrTe2Ding remains in Ir0.95Pd0.05Te2, which leave the possibility that the superconducting instability can be related to the van Hove singularity at saddle pointsDing . This scenario could be studied by ultra-low temperature ARPES experiments in the future.
In summary, we did comprehensive studies of the superconducting properties and electronic structures of Ir0.95Pd0.05Te2. By combination of the macroscopic and microscopic measurements, the superconducting gap size, coherence length, electronics structures as well as the vortex states were determined. At 0.4K, the samples present a BCS-type s-wave-like superconducting behavior. Though no exotic superconducting state was found in this system, the hexagonal lattice structure of Ir0.95Pd0.05Te2 is very suitable for expitally growth TIs. In our previous work, Bi2Se3 (Bi2Te3) TI films were successfully grown on s-wave superconductor NbSe2WangMX ; Xujinpeng . This type of heterostructure utilizing the superconducting proximity effect perpendicular to the ab plane, so called vertical geometry. Superconducting Ir1-xPdxTe2 will be another excellent candidate for this geometry since its vertical coherence length is much larger than that of NbSe2 ( 3 nm). The heterostructure of TI/Ir1-xPdxTe can be a good candidate for exploring topological superconductor related phenomena in the future.
This work is supported by National Basic Research Program of China (Grants No. 2012CB927401, 2011CB921902, 2013CB921902, 2011CB922200), NSFC (Grants No. 91021002, 10904090, 11174199, 11134008), the SCST, China (Grants No. 12JC1405300, 13QH1401500, 10JC1407100, 10PJ1405700, 11PJ405200). The Advanced Light Source is supported by the Director, Office of Science, Office of Basic Energy Sciences, of the US Department of Energy under Contract DE-AC02-05CH11231. D.Q. acknowledges additional supports from the Top-notch Young Talents Program and the Program for Professor of Special Appointment (Eastern Scholar) at Shanghai Institutions of Higher Learning.
References
- (1) M. Z. Hasan and C. L. Kane, Rev. Mod. Phys. 82, 3045 (2010).
- (2) X.-L. Qi and S.-C. Zhang, Rev. Mod. Phys. 83, 1057 (2011).
- (3) B. A. Bernevig, T. L. Hughes, and S.C. Zhang, Science 314, 1757 (2006).
- (4) D. Hsieh, D. Qian, L. Wray, Y. Xia, Y. S. Hor, R.J. Cava and M.Z. Hasan, Nature 452, 970 (2008).
- (5) Y. Xia, D. Qian, D. Hsieh, L. Wray, A. Pal, H. Lin, A. Bansil, D. Grauer, Y.S. Hor, R.J. Cava, M.Z. Hasan, Nature Phys. 5, 398 (2009).
- (6) Y.L. Chen, J.-H. Chu, J.G. Analytis, Z.K. Liu, K. Igarashi, H.-H. Kuo, X.L. Qi, S.K. Mo, R.G. Moore, D.H. Lu, M. Hashimoto, T. Sasagawa, S.C. Zhang, I.R. Fisher, Z. Hussain, and Z.X. Shen, Science 325, 178 (2009).
- (7) H.J. Zhang, C.X. Liu, X.L. Qi, X. Dai, Z. Fang, and S.C. Zhang, Nat. Phys. 5, 438 (2009).
- (8) A. Schnyder, S. Ryu, A. Furusaki, A. Ludwig, Phys. Rev. B, 78, 195125 (2008).
- (9) X.L. Qi, T.L. Hughes, S. Raghu, S.C. Zhang, Phys. Rev. Lett. 102, 187001 (2009).
- (10) L. Fu, C. L. Kane, Phys. Rev. Lett. 100, 096407 (2008).
- (11) A. P. Mackenzie and Y. Maeno, Rev. Mod. Phys. 75, 657 (2003).
- (12) Y. Maeno, S. Kittaka, T. Nomura, S. Yonezawa, K. Ishida, J. Phy. Soc. J. 81, 011009 (2012).
- (13) L. Fu and E. Berg, Phys. Rev. Lett. 105, 097001 (2010).
- (14) L.A. Wray, S. Xu, Y. Xia, D. Qian, A.V. Fedorov, H. Lin, A. Bansil, L. Fu, Y.S. Hor, R.J. Cava, M.Z. Hasan, Phys. Rev. B, 83, 224516 (2011).
- (15) S. Sasaki, Z. Ren, A. A. Taskin, K. Segawa, L. Fu, and Y. Ando, Phys. Rev. Lett. 109, 217004 (2012).
- (16) S. Sasaki, M. Kriener, K. Segawa, K. Yada, Y. Tanaka, M. Sato, and Y. Ando, Phys. Rev. Lett. 107, 217001 (2011).
- (17) V. Mourik, K. Zuo, S. M. Frolov, S. R. Plissard, E. P. A. M. Bakkers, L. P. Kouwenhoven, Science 336, 6084 (2012).
- (18) J.J. Yang, Y. J. Choi, Y. S. Oh, A. Hogan, Y. Horibe, K. Kim, B. I. Min, and S.W. Cheong Phys. Rev. Lett. 108, 116402 (2012).
- (19) D. Ootsuki, Y. Wakisaka, S. Pyon, K. Kudo, M. Nohara, M. Arita, H. Anzai, H. Namatame, M. Taniguchi, N.L. Saini, T. Mizokawa, Rev. B 86, 014519 (2012).
- (20) M. Kamitani1, M. S. Bahramy, R. Arita1, S. Seki, T. Arima, Y. Tokura, and S. Ishiwata, Phys. Rev. B 87, 180501(R) (2013).
- (21) S.Y. Zhou, X.L. Li, B.Y. Pan, X. Qiu, J. Pan, X.C. Hong, Z. Zhang, A.F. Fang, N.L. Wang, S.Y. Li, EPL, 104, 27010 (2013).
- (22) H.B. Cao, B.C. Chakoumakos, X. Chen, J.Q. Yan, M.A. McGuire, H. Yang, R. Custelcean, H.D. Zhou, D.J. Singh, D. Mandrus, Phys. Rev. B 88, 115122 (2013).
- (23) T. Qian, H. Miao, Z.J. Wang, X. Liu, X. Shi, Y.B. Huang, P. Zhang, N. Xu, P. Richard, M. Shi, M. H. Upton, J.P. Hill, G. Xu, X. Dai, Z. Fang, H.C. Lei, C. Petrovic, A.F. Fang, N.L. Wang, H. Ding, arXiv:1311.4946 (2013).
- (24) A.F. Fang, G. Xu, T. Dong, P. Zheng, N. L. Wang, Sci. Rep., 3, 1153 (2012).
- (25) D. Ootsuki, S. Pyon, K. Kudo, M. Nohara, M. Horio, T. Yoshida, A. Fujimori, M. Arita, H. Anzai, H. Namatame, M. Taniguchi, N.L. Saini, T. Mizokawa, J. Phys. Soc. Jpn. 82 093704 (2013).
- (26) Y.S. Oh, J. J. Yang, Y. Horibe, and S. W. Cheong, Phys. Rev. Lett. 110, 127209 (2013).
- (27) P.J. Hsu, T. Mauerer, M. Vogt, J.J. Yang, Y.S. Oh, S.W. Cheong, M. Bode, W.D. Wu, Phys. Rev. Lett., 111, 266401 (2013).
- (28) M.X. Wang, C.H. Liu, J.P. Xu, F. Yang, L. Miao, M.Y. Yao, C.L. Gao, C. Shen, X.C. Ma, X. Chen, Z.A. Xu, Y. Liu, S.C. Zhang, D. Qian, J.F. Jia, Q.K. Xue, Science 336, 52 (2012).
- (29) J.P. Xu, C.H. Liu, M.X. Wang, J.F. Ge, Z.L. Liu, X.J. Yang, Y. Chen, Y. Liu, Z.A. Xu, C.L. Gao, D. Qian, F.C. Zhang, Q.K. Xue, Jin-Feng Jia, arxiv:1312.3713 (2013).