Measurement of the halo bias from stacked shear profiles of galaxy clusters
Abstract
We present the observational evidence of the 2-halo term in the stacked shear profile of a sample of optically selected galaxy clusters based on imaging data and the public shear catalog from the CFHTLenS. We find that the halo bias, a measure of the correlated distribution of matter around galaxy clusters, has amplitude and correlation with galaxy cluster mass in very good agreement with the predictions based on the LCDM standard cosmological model. The mass-concentration relation is flat but higher than theoretical predictions. We also confirm the close scaling relation between the optical richness of galaxy clusters and their mass.
Subject headings:
galaxies: clusters: general — gravitational lensing: weak — dark matter — cosmology: large-scale structure of universe1. Introduction
A fundamental scope of the observational study of galaxy clusters, the most massive gravitationally bound systems in the cosmos, is testing models of structure formation and gaining insight into the complex physical interplay between the baryonic and dark components of matter. Currently, the most successful framework is based on the cosmological constant term and the cold, collisionless dark matter (LCDM), which nature is still not understood. Numerical simulations have provided clear predictions for the structure of dark matter halos (e.g., the so-called mass-concentration relation, Bullock et al. 2001) and their clustering properties.
The halo power spectrum describes the statistical properties of the spatial distribution of massive halos. Observed structures are in principle differently distributed from the underlying dark matter. The correlation between the halo density field and the underlying matter distribution is parametrized by the halo bias parameter, . This is defined as the ratio of the halo power spectrum to the linear matter (Tinker et al., 2010; Oguri & Takada, 2011):
| (1) |
Theoretical models of gravitational clustering of dark matter haloes provide robust predictions for the bias (Mo & White, 1996; Sheth et al., 2001). It is expected to be constant at large scales and an increasing function of the peak height. It is therefore of importance to compare such predictions with observations of galaxy clusters, as a function of mass and cosmic epoch.
The correlated matter distribution around galaxy clusters manifests itself as a 2-halo term in the mass density profiles, at scales lager than , its contribution being proportional to . The 2-halo term describes the cumulative effects of the large scale structure in which galaxy clusters are located. While weak gravitational lensing is a powerful tool to measure mass distribution in galaxy clusters (Kneib & Natarajan, 2011), the lensing signal expected in the 2-halo term is too low to be reliably detected in the outskirts of individual systems. Stacking the lensing signal of a large number of galaxy clusters enable us to detect at high S/N the 2-halo term. Stacked shear profiles of galaxy groups and clusters have been used to study the average properties of radial profiles and the observable scaling relations (Sheldon et al., 2001; Dahle et al., 2003; Okabe et al., 2010; Leauthaud et al., 2010; Oguri et al., 2012; Sereno & Covone, 2013; Shan et al., 2013).
Johnston et al. (2007) used galaxy groups and clusters from the Sloan Digital Sky Survey (SDSS) to obtain stacked lensing signals and infer the relations between mass and optical richness and luminosity over a wide range of masses, and also to measure the halo bias and concentration as a function of mass. Oguri & Takada (2011) have proposed a cosmological test based on the combination of stacked weak lensing of galaxy clusters with number counts and correlation functions, showing that this reduces systematic errors from poorly known redshift distributions and scaling relations.
Several studies have shown observational evidence for the 2-halo term in the stacked galaxy-galaxy lensing profile (Brimioulle et al., 2013; Velander et al., 2014). In this work, we apply this technique at the galaxy clusters scale. We use public data from CFHTLenS to measure the lensing signal from a sample of optically selected galaxy clusters (Wen et al., 2012). As framework we use a spatially flat, cosmological model with , and , with .
2. Analysis
The radial shear profile of a galaxy cluster at redshift can be effectively described by the sum of two terms: . The first term accounts for the main dark matter halo and the associated baryonic component. The 2-halo term accounts for the correlated distribution of matter around the cluster. The tangential shear profile due to the 2-halo term is (Oguri & Takada, 2011; Oguri & Hamana, 2011)
| (2) |
where is the second order Bessel function, is the mass density at , the linear power spectrum, , the lensing critical density, the angular-diameter distance. We used the Eisenstein & Hu (1999)’s prescription to calculate the linear matter power spectrum, and the baryon and neutrino density and scalar spectral index as measured by the Planck Collaboration et al. (2013). The uncorrelated matter distribution along the line of sight provides no contribution to the stacked shear signal, therefore the 2-halo term is a function of the correlated matter distribution at the same cluster redshift (Oguri & Takada, 2011).
We used the public shear catalog provided by the Canada-France Hawaii Telescope Lensing Survey (CFHTLenS, Heymans et al. (2012)) containing the photometry, photometric redshifts and ellipticity measurements from the four wide fields covering about 154 square degrees. Data have been collected within the CFHT Legacy Survey (CFHTLS, Erben et al. (2013)). Photometric redshifts were determined from the available optical observations (Hildebrandt et al., 2012), with accuracy and a catastrophic outlier rate of about 4%.
We used the catalog built by Wen et al. (2012) to identify galaxy clusters in the four fields. The catalog contains positions, photometric redshift, richness, brightest cluster galaxy (BCG) magnitude for 132,684 optically selected galaxy clusters, up to . Galaxy clusters were identified in the SDSS-DR9 imaging data, with detection rate for masses larger than . The false detection rate is less than 6% for the whole sample. The centre of each galaxy cluster is identified with the position of the BCG. We selected galaxy clusters centred in the CFHTLS fields, with redshift in the range and at least one radial shear measurement in the inner 2 Mpc/ (corresponding to about 7.5 arcmin at ). The upper redshift limit was chosen in order to separate robustly the lensing and background galaxy populations. Our final sample contains 530, 89, 457, 287 systems (1176 overall) in the four regions, respectively, with median redshift . No further selection is applied.
For each galaxy cluster, we determined the shear profile around its center as briefly outlined hereafter. The procedure leading to the shape measurements, based on the tool lensfit, is described in Miller et al. (2013). The CFHTLenS catalog provides the raw shear components, . These quantities are still affected by a small multiplicative and additive bias: we performed the correction by applying two calibration parameters, and , empirically derived from the data and provided in the shear catalog (Heymans et al., 2012). The calibration reads
| (3) |
where is the measured ellipticity. The average quantity is evaluated in each radial bin, taking into account the weight of the associated shear measurement.
We selected background lensed sources behind each cluster by using a two colours selection (Medezinski et al., 2010; Oguri et al., 2012). We used the following region in the two-colours space:
| (4) |
These criteria efficiently select galaxies at (Medezinski et al., 2010). We did not select background sources on the basis of the photometric redshifts, as the faint galaxies photometric redshift distribution shows an artificial peak at (Hildebrandt et al., 2012). We note that these sources are mostly characterised by a low value of the odds parameter, that quantifies the relative importance of the most likely redshift (Hildebrandt et al., 2012), hinting to possible degeneracies in the redshift determination based only on optical colors. Finally, we have also excluded all the sources not detected in one of the 3 filters or not satisfying the following requirements on the parameters of the CFHTLenS catalog: ellipticity weight larger than 0, mask smaller or equal to 1, S/N of the lensfit measurement larger than 0, and magnitude brighter than the local limit magnitude. The final density of the background galaxies is about 6 galaxies per arcmin2.
We determined the shear profile as a function of the physical length, up to about 20 Mpc/ (corresponding to about 2 degrees, at ). We excluded the central region of angular radius 0.1 Mpc/ around the BCG because of the low number of background sources and the low accuracy in the determination of the cluster centre. The shear profile has been determined in 23 log-spaced radial bins, with logarithm spacing . Finally, in each radial bin, we determined the weighted ellipticity of the background sources, hence the tangential and cross component of the shear, .
By using photometric redshifts measurements of the lens and source population, we calculated the excess surface mass density
| (5) |
where is the reduced tangential shear and then computed the mean in the given annular bin (McKay et al., 2001).
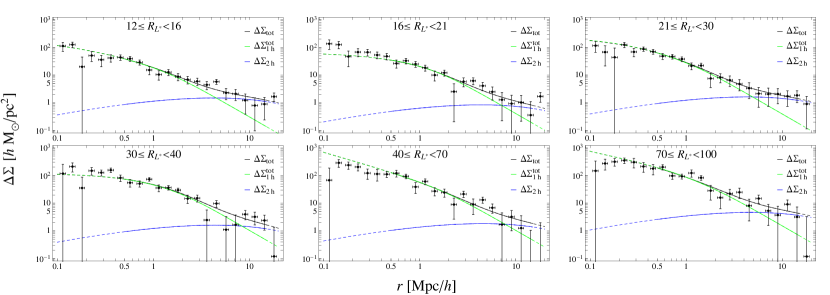
Finally, we have obtained high-S/N radial profiles as a function of the physical length scale by stacking the signal of galaxy clusters grouped according to their optical richness. The optical richness is defined as (Wen et al., 2012), where is the cluster total luminosity within the an empirically determined radius and is the evolved characteristic luminosity of galaxies in the band. Wen et al. (2012) have shown that there is a close correlation between the virial mas and the optical richness. Hence, we used the observable quantity to split the full galaxy cluster sample in bins, see Table 1. Stacked radial profiles of the excess mass density are shown in Fig. 1.
We fitted each stacked profile with a double mass component. The galaxy cluster halo is fitted with the smoothly truncated NFW profile proposed by Baltz et al. (2009),
| (6) |
where we set the truncation radius . This modification of the original NFW profile removes the unphysical divergence of its total mass. Moreover, Oguri & Hamana (2011) used a set of ray-tracing -body simulations to show that this parametric model gives a less biased estimates of mass and concentration with respect to the NFW profile, and also better describes the density profile beyond the virial radius, where the transition between the cluster and the 2-term halo occurs. As discussed above, the 2-halo term describes the outer profile. The shear signal at large radii is proportional to the halo power spectrum, and hence to the product , , where is is the rms mass fluctuation amplitude in spheres of size 8 Mpc.
A relevant source of error is given by the halo centering offset, as the BCG (which defines the cluster center in our sample) might be misidentified (Johnston et al., 2007) or not coincide with the matter centroid (Zitrin et al., 2012). The BCG offsets are generally small and negligible at the weak lensing scale (Zitrin et al., 2012), but the mis-identification of the BCG can lead to underestimate at small scales and bias low the measurements of . Therefore, we fitted an offset mass component (Yang et al., 2006), distributed according to an azimuthally symmetric Gaussian distribution, with mass fraction and scale length of the Gaussian distribution as free parameters (Johnston et al., 2007). The contribution of the main cluster halos is given by the sum of two terms, a centred and an off-centred mass component. While the effect of miscentering is negligible on the scale where the correlated matter is detected, it is important to take it into account for an unbiased determination of the cluster concentration. We checked that neglecting the offset component leads to underestimate by 15% and the mass by 10%.
Free fitting parameters are the mass and the concentration of the main cluster halo, the term , the fraction of off-centered halos, , and the scale length of the spatial distribution this additional component is extracted from, . We performed radial fits using data points between 0.5 and 15 Mpc/, beyond which annuli are largely incomplete due to the limited field of view. The choice of the lower limit for radial range is a compromise between minimising the systematic errors due to the contamination of cluster galaxies, and minimising the statistical error on (Mandelbaum et al., 2008). The number of degrees of freedom is in each fit. Errors were determined with a standard bootstrap procedure with replacement.
In order to determine residual systematic effects affecting the stacked profiles, we built a random catalog of 5000 lenses with the same redshift distribution of the real galaxy clusters and we determined the lensing signal around the random positions using the same procedure described above. The systematic signal has been then subtracted from the measured quantity. Errors on the stacked random clusters shear profiles have been estimated with a bootstrap procedure with replacement (5000 resamplings) and then added in quadrature. The stacked lensing signal from the random pointings is consistent with zero up to . At larger radii, there is a spurious signal at about 1- level, in agreement with Miyatake et al. (2013) who pointed to residual systematics in the shear measurements at the edges of detector.
Due to stacking, shear observations at different radii are correlated. The off-diagonal terms of the covariance matrix are very noisy (Mandelbaum et al., 2013) and can be reliably computed only in the most populated bins at small optical richness, where we verified that the use of the covariance matrix does not significantly change the results. For consistency across the different richness bins, we only considered diagonal elements to perform the analysis.
The unbiased profiles were then analyzed using a MCMC procedure to explore the parameter space. Results are listed in Table 1. The mass fraction of the offset component is not strongly constrained by our data; however, it is important to include it the fitting procedure as this leads to less biased measurement of the concentration, otherwise significatively underestimated. The modelling provides good fits to the data.
 |
| richness bin | ||||||
|---|---|---|---|---|---|---|
| () | ||||||
| 12 16 | 476 | 11.9 | ||||
| 16 21 | 347 | 10.7 | ||||
| 21 30 | 216 | 4.45 | ||||
| 30 40 | 90 | 18.8 | ||||
| 40 70 | 37 | 16.2 | ||||
| 70 100 | 10 | 14.3 |
3. Scaling relations
We analyzed scaling relations between clusters observables. Linear fits were performed using the BCES method, an implementation of the ordinary least squares estimator (Akritas & Bershady, 1996). Errors were estimated by means of a bootstrap resampling with replacements.
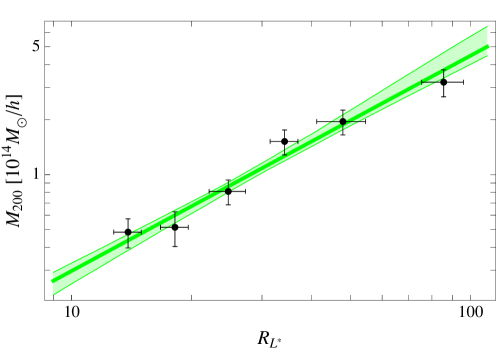
We confirm the strong correlation between the optical richness and the virial mass of the stacked galaxy clusters, see Fig. 2:
| (7) |
in excellent agreement with Wen et al. (2009).
Theoretical models of hierarchical growth of structures in the LCDM model present two clear predictions on the mass scale of galaxy clusters: the mass-concentration relation and the dependence of the halo bias term on the parent halo mass. We find that the stacked galaxy clusters follow a flat -relation, see Fig. 3:
| (8) |
While the slope is consistent with theoretical predictions by Duffy et al. (2008), the normalisation differs at 1- level. We note that neglecting the offset component would decrease the normalisation, without changing the slope of the relation.
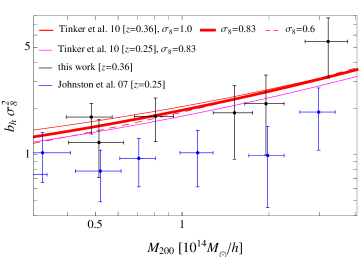
The 2-halo term is evident in each individual bin (Fig. 1), and it is strongly dependent on the parent halo mass (Fig. 4). Our results are remarkably consistent with theoretical predictions (Tinker et al., 2010; Bhattacharya et al., 2011). A quantitative analysis can be performed in terms of a function,
| (9) |
We get assuming the theoretical bias from Tinker et al. (2010) and the value measured by the Planck collaboration from the CMB temperature anisotropy and the lensing-potential power spectra (Planck Collaboration et al., 2013). The associated probability is .
In an attempt to constrain , we can adopt the bias model from Tinker et al. (2010). We get .

4. Conclusions
We used the CFHTLenS public shear catalog to obtain the stacked weak lensing signal of 1176 galaxy clusters in the redshift range . With respect to previous observational studies of the galaxy cluster halo bias based on SDSS imaging data, we used shear measurements derived from the deeper and higher quality data from the CFHTLS. We have built high S/N profiles in six bins in optical richness , which average masses span the range from 0.5 to .
We confirm that the cluster mass robustly correlates with the optical richness, with parameters in agreement with those found by Wen et al. (2012). Our result supports the use of the stacking method in weak lensing to calibrate galaxy clusters scaling relations, e.g. Oguri & Takada (2011) .
We studied the and the relations, and we found in both cases an agreement with theoretical predictions based on the LCDM cosmological models. While consistent at 1- level with the predictions from Duffy et al. (2008), we find evidence for an over-concentration of the -relation, in closer agreement with recent simulations by Bhattacharya et al. (2013).
Our results partially reconcile present tension between observed relations and theoretical predictions. On one hand, studies of single clusters found very steep and over-concentrated relations (Oguri et al., 2012; Fedeli, 2012; Sereno & Covone, 2013). On the other hand, previous stacked analyses found flat relations of the expected amplitude (Mandelbaum et al. 2008). We found an alternative scenario on a middling ground: an over-concentrated but still flat relation. Analysis of individual clusters might be affected by low S/N and high correlation, as well as by selection effects whereas previous SDSS stacked analysis might suffer from contamination and off-set effects.
The large scale shear profile is a degenerate function of the halo bias and the power spectrum normalisation, therefore our measurement of the halo bias term is not independent of . Our measurement of the quantity as a function of the average halo mass is in very good agreement with theoretical predictions by Tinker et al. (2010), and systematically higher than the ones by Johnston et al. (2007), Fig. 4. As shown by Rozo et al. (2010), shear measurements in Johnston et al. (2007) are underestimated by 20% due to the diluted lensing signal by foreground galaxies. This systematic error might explain the discrepancy with our measurements.
Our analysis is also consistent with measurements from the correlation function of galaxy clusters. Veropalumbo et al. (2013) analyzed a spectroscopic sample of 25226 clusters of richness at and obtained for .
Our results open the possibility to verify further physical effects on the clustering properties of massive halos: Villaescusa-Navarro et al. (2013) used -body simulations to show that cosmological models with massive neutrinos show a scale-dependent bias on large scales, while Dalal et al. (2008) have shown that the non-Gaussianity of primordial fluctuations brings to a strongly scale-dependent bias.
Acknowledgments
We thank Keiichi Umetsu for stimulating discussions and the referee for clarifying comments. GC acknowledges financial support from the grant PRIN-INAF 2011 ”Galaxy Evolution with the VLT Survey Telescope”; MS and VFC acknowledge financial support from the agreement ASI/INAF/I/023/12/0.
References
- Akritas & Bershady (1996) Akritas, M. G., & Bershady, M. A. 1996, ApJ, 470, 706
- Baltz et al. (2009) Baltz, E. A., Marshall, P., & Oguri, M. 2009, J. Cosmology Astropart. Phys, 1, 15
- Bhattacharya et al. (2013) Bhattacharya, S., Habib, S., Heitmann, K., & Vikhlinin, A. 2013, ApJ, 766, 32
- Bhattacharya et al. (2011) Bhattacharya, S., Heitmann, K., White, M., et al. 2011, ApJ, 732, 122
- Brimioulle et al. (2013) Brimioulle, F., Seitz, S., Lerchster, M., Bender, R., & Snigula, J. 2013, MNRAS, 432, 1046
- Bullock et al. (2001) Bullock, J. S., Kolatt, T. S., Sigad, Y., et al. 2001, MNRAS, 321, 559
- Dahle et al. (2003) Dahle, H., Hannestad, S., & Sommer-Larsen, J. 2003, ApJ, 588, L73
- Dalal et al. (2008) Dalal, N., Doré, O., Huterer, D., & Shirokov, A. 2008, Phys. Rev. D, 77, 123514
- Duffy et al. (2008) Duffy, A. R., Schaye, J., Kay, S. T., & Dalla Vecchia, C. 2008, MNRAS, 390, L64
- Eisenstein & Hu (1999) Eisenstein, D. J., & Hu, W. 1999, ApJ, 511, 5
- Erben et al. (2013) Erben, T., Hildebrandt, H., Miller, L., et al. 2013, MNRAS, 433, 2545
- Fedeli (2012) Fedeli, C. 2012, MNRAS, 424, 1244
- Heymans et al. (2012) Heymans, C., Van Waerbeke, L., Miller, L., et al. 2012, MNRAS, 427, 146
- Hildebrandt et al. (2012) Hildebrandt, H., Erben, T., Kuijken, K., et al. 2012, MNRAS, 421, 2355
- Johnston et al. (2007) Johnston, D. E., Sheldon, E. S., Wechsler, R. H., et al. 2007, ArXiv e-prints, arXiv:0709.1159
- Kneib & Natarajan (2011) Kneib, J.-P., & Natarajan, P. 2011, A&A Rev., 19, 47
- Leauthaud et al. (2010) Leauthaud, A., Finoguenov, A., Kneib, J.-P., et al. 2010, ApJ, 709, 97
- Mandelbaum et al. (2008) Mandelbaum, R., Seljak, U., & Hirata, C. M. 2008, J. Cosmology Astropart. Phys, 8, 6
- Mandelbaum et al. (2013) Mandelbaum, R., Slosar, A., Baldauf, T., et al. 2013, MNRAS, 432, 1544
- McKay et al. (2001) McKay, T. A., Sheldon, E. S., Racusin, J., et al. 2001, ArXiv Astrophysics e-prints, astro-ph/0108013
- Medezinski et al. (2010) Medezinski, E., Broadhurst, T., Umetsu, K., et al. 2010, MNRAS, 405, 257
- Miller et al. (2013) Miller, L., Heymans, C., Kitching, T. D., et al. 2013, MNRAS, 429, 2858
- Miyatake et al. (2013) Miyatake, H., More, S., Mandelbaum, R., et al. 2013, ArXiv e-prints, arXiv:1311.1480
- Mo & White (1996) Mo, H. J., & White, S. D. M. 1996, MNRAS, 282, 347
- Oguri et al. (2012) Oguri, M., Bayliss, M. B., Dahle, H., et al. 2012, MNRAS, 420, 3213
- Oguri & Hamana (2011) Oguri, M., & Hamana, T. 2011, MNRAS, 414, 1851
- Oguri & Takada (2011) Oguri, M., & Takada, M. 2011, Phys. Rev. D, 83, 023008
- Okabe et al. (2010) Okabe, N., Takada, M., Umetsu, K., Futamase, T., & Smith, G. P. 2010, PASJ, 62, 811
- Planck Collaboration et al. (2013) Planck Collaboration, Ade, P. A. R., Aghanim, N., et al. 2013, ArXiv e-prints, arXiv:1303.5076
- Rozo et al. (2010) Rozo, E., Wechsler, R. H., Rykoff, E. S., et al. 2010, ApJ, 708, 645
- Sereno & Covone (2013) Sereno, M., & Covone, G. 2013, MNRAS, 434, 878
- Shan et al. (2013) Shan, H., Kneib, J.-P., Comparat, J., et al. 2013, ArXiv e-prints, arXiv:1311.1319
- Sheldon et al. (2001) Sheldon, E. S., Annis, J., Böhringer, H., et al. 2001, ApJ, 554, 881
- Sheth et al. (2001) Sheth, R. K., Mo, H. J., & Tormen, G. 2001, MNRAS, 323, 1
- Tinker et al. (2010) Tinker, J. L., Robertson, B. E., Kravtsov, A. V., et al. 2010, ApJ, 724, 878
- Velander et al. (2014) Velander, M., van Uitert, E., Hoekstra, H., et al. 2014, MNRAS, 437, 2111
- Veropalumbo et al. (2013) Veropalumbo, A., Marulli, F., Moscardini, L., Moresco, M., & Cimatti, A. 2013, ArXiv e-prints, arXiv:1311.5895
- Villaescusa-Navarro et al. (2013) Villaescusa-Navarro, F., Marulli, F., Viel, M., et al. 2013, ArXiv e-prints, arXiv:1311.0866
- Wen et al. (2009) Wen, Z. L., Han, J. L., & Liu, F. S. 2009, ApJS, 183, 197
- Wen et al. (2012) —. 2012, ApJS, 199, 34
- Yang et al. (2006) Yang, X., Mo, H. J., van den Bosch, F. C., et al. 2006, MNRAS, 373, 1159
- Zitrin et al. (2012) Zitrin, A., Bartelmann, M., Umetsu, K., Oguri, M., & Broadhurst, T. 2012, MNRAS, 426, 2944