Depletions of Elements from the Gas Phase: A Guide on Dust Compositions
Abstract
Ultraviolet spectra of stars recorded by orbiting observatories since the 1970’s have revealed absorption features produced by atoms in their favored ionization stages in the neutral ISM of our Galaxy. Most elements show abundances relative to hydrogen that are below their values in stars, indicating their removal by condensation into solid form. The relative amounts of these depletions vary from one location to the next, and different elements show varying degrees of depletion. In a study of abundances along 243 different sight lines reported in more than 100 papers, Jenkins (2009) characterized the systematic patterns for the depletions of 17 different elements, and these results in turn were used to help us understand the compositions of dust grains. Since the conclusions are based on differential depletions along different sightlines, they are insensitive to errors in the adopted values for the total element abundances. Some of the more remarkable conclusions to emerge from this study are that (1) oxygen depletions in the denser gas regions (but not as dense as the interiors of molecular clouds) are stronger than what we can expect from just the formation of silicates and metallic oxides, and (2) the chemically inert element krypton shows some evidence for weak depletion, perhaps as a result of trapping within water clathrates or binding with .
1 Background
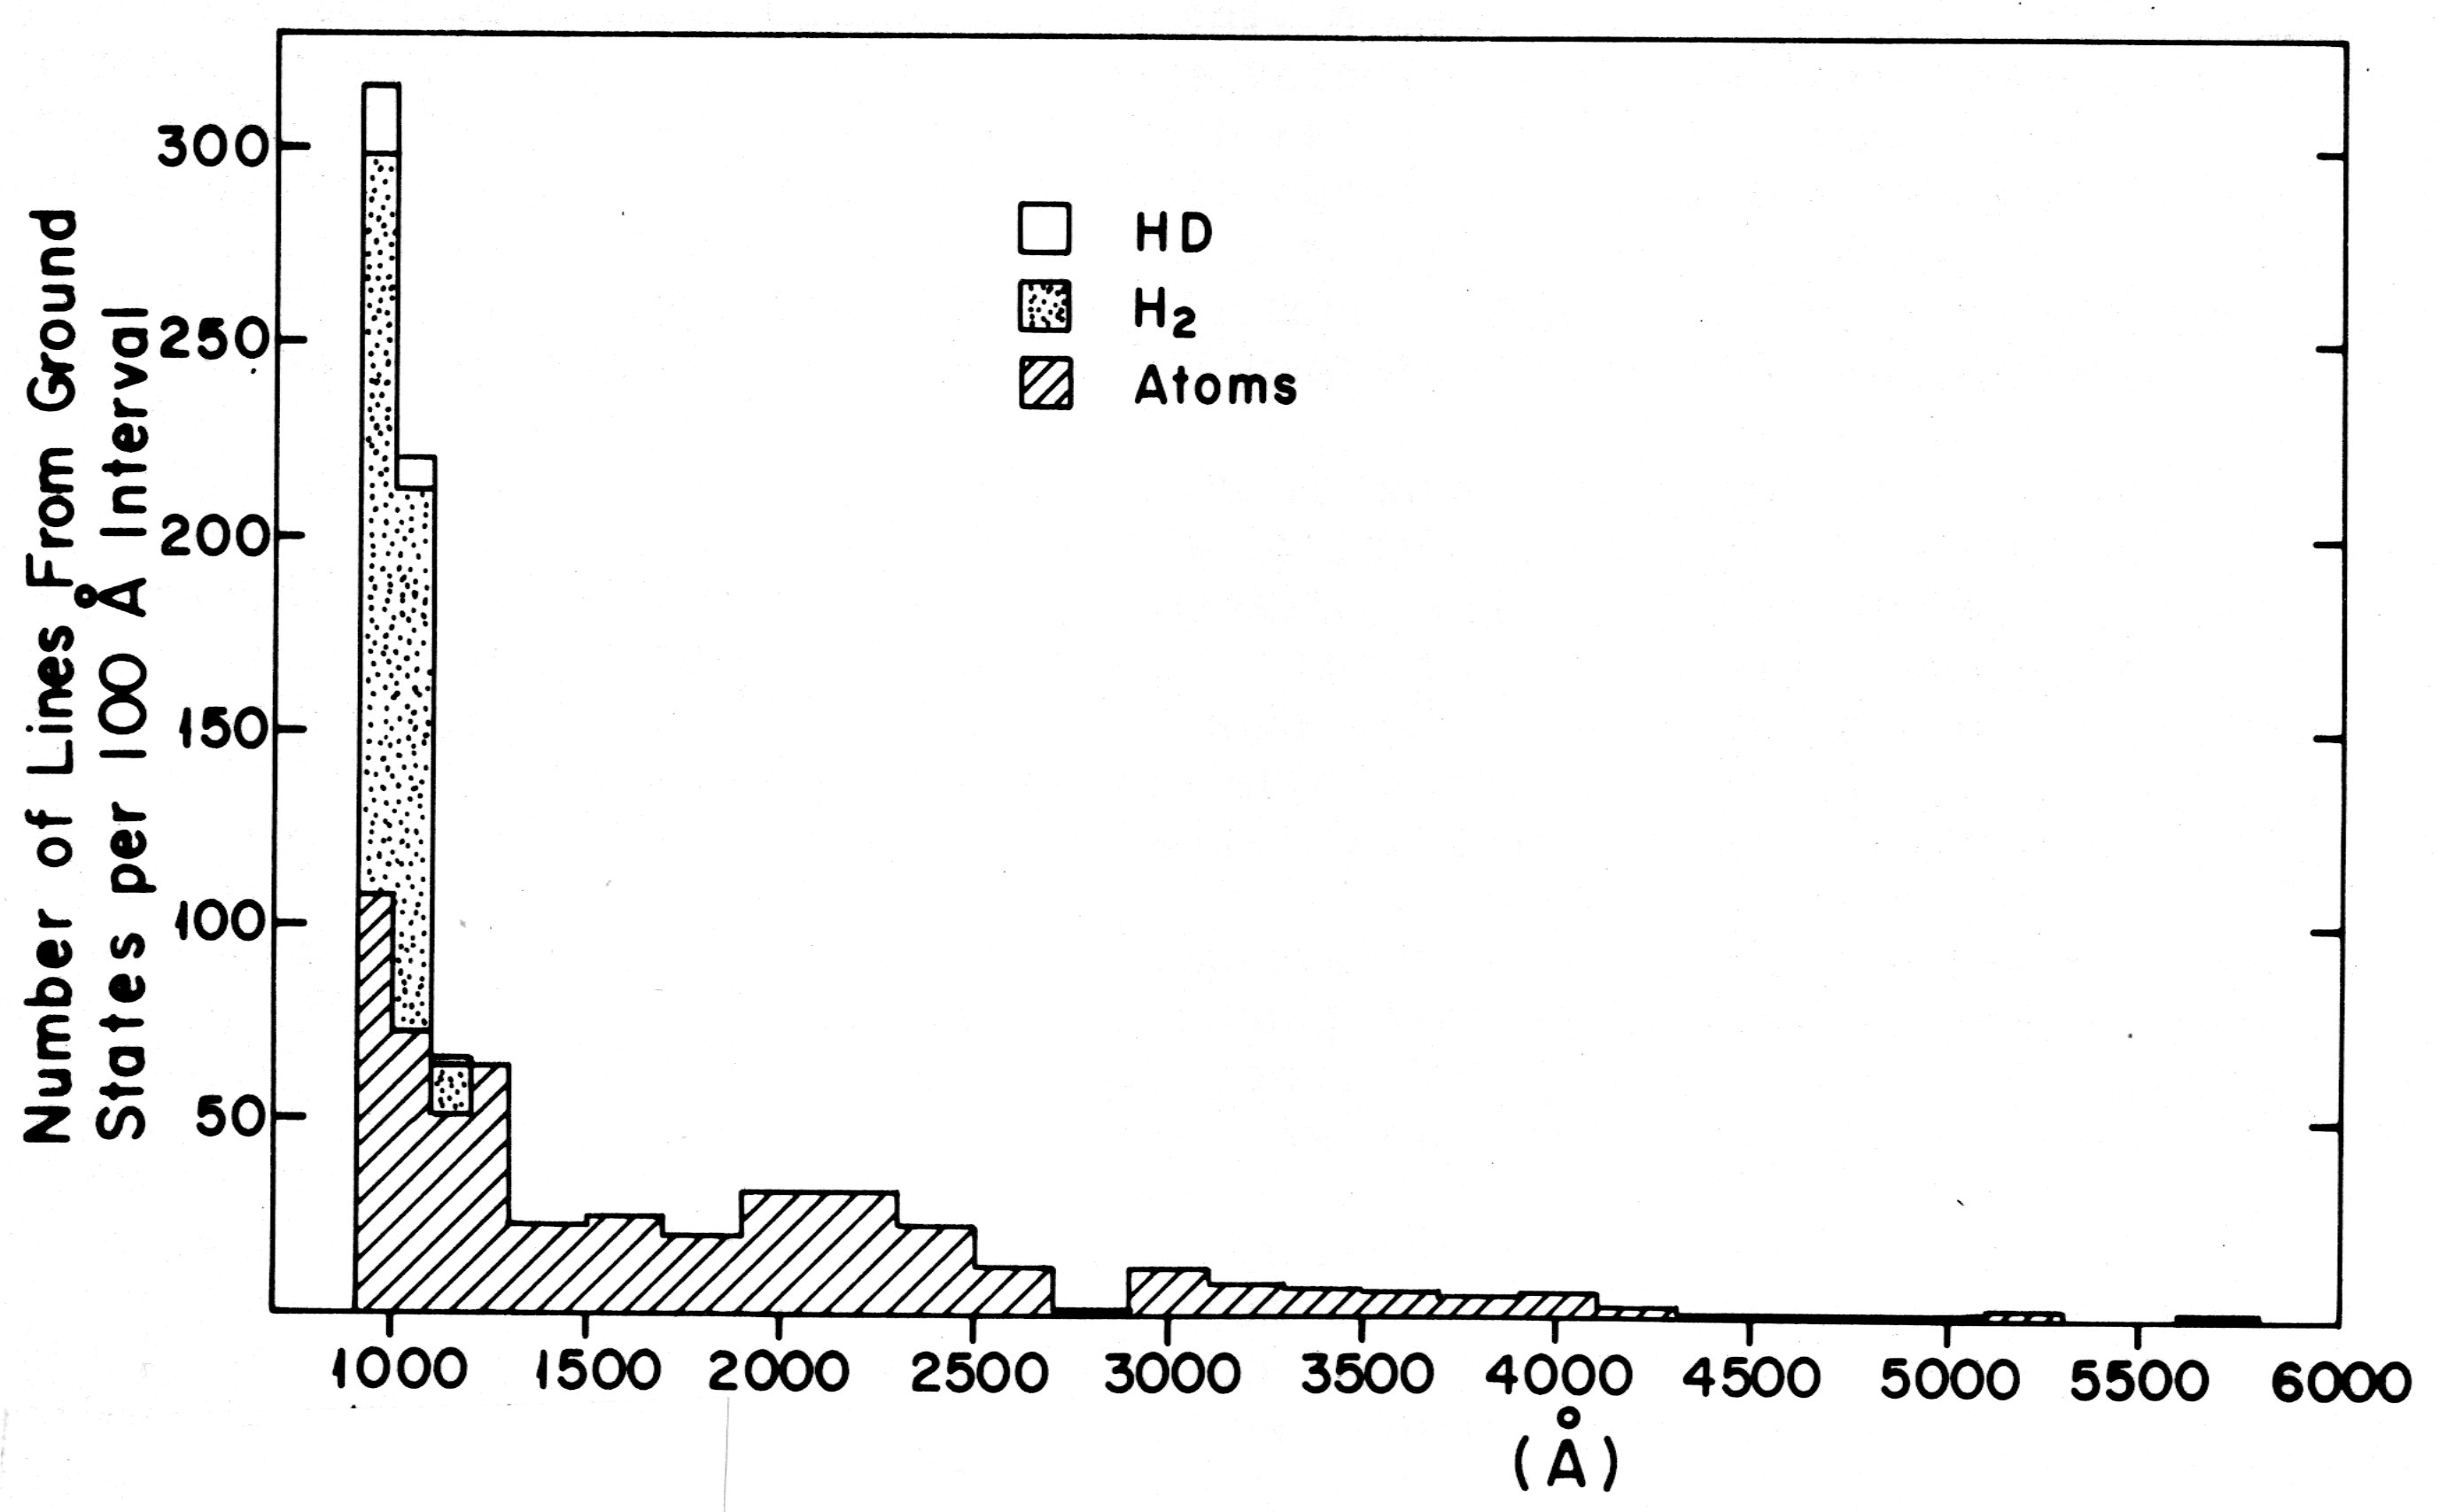
When various elements condense into solid form in the interstellar medium, there are profound reductions in the relative abundances of many types of heavy atoms and ions in the gas phase. We can obtain insights on the compositions of the dust grains by studying the strengths of depletions of different gas constituents below what we believe to be their intrinsic abundances. Virtually all of the free atoms in the neutral interstellar medium are in their ground electronic states. For nearly all of the important atomic species, the energy separations of excited levels above the ground state are larger than the energies of transitions in the visible part of the spectrum. Hence, as shown in Fig. 1, for absorption spectroscopy a vast majority of the useful features are situated in the UV part of the spectrum; this fact was recognized long ago by Spitzer and Zabriskie (1959). For studying gas in our Galaxy or nearby systems, these transitions can only be accessed by observatories in space. Except for the elements Be (Spitzer 1949 ; Herbig 1968 ; Boesgaard 1985) and Ti (Wallerstein & Goldsmith 1974 ; Stokes & Hobbs 1976 ; Stokes 1978 ; Wallerstein & Gilroy 1992 ; Welsh et al. 1997 ; Prochaska et al. 2005 ; Ellison et al. 2007 ; Welty & Crowther 2010) and some comparisons of the abundances of Ca to Na with velocity (Routly & Spitzer 1952 ; Siluk & Silk 1974 ; Vallerga et al. 1993 ; Sembach & Danks 1994), research on interstellar atomic abundances relied almost entirely on recording stellar spectra over the range extending from the Lyman limit (912 Å) up to about 3000 Å, where the Earth’s atmosphere becomes transparent.
The Copernicus satellite (Rogerson et al. 1973), launched in 1972, was the first major observatory that had the resolution and sensitivity for productive research on atomic abundances in the interstellar medium (Spitzer & Jenkins 1975 ; Cowie & Songaila 1986). The earliest results from this facility (Morton et al. 1973) exhibited a pattern of element depletions that led Field (1974) to conclude that the severities of depletions are strongly linked to the temperatures at which the respective elements condense into solid compounds in matter being expelled from the outer portions of stellar atmospheres. This formation mechanism, along with the creation of dust in supernova ejecta and the further growth of grains in dense gas complexes in space, still remains a central theme in theories of dust production. A decade of observations with Copernicus reached a climax with the study of element abundances across a broad range of sight lines toward bright stars in our Galaxy (Jenkins et al. 1986), revealing that the strengths of depletions were strongly linked to the average gas densities, indicating that the growth and destruction of grains depend on local conditions.
Following the era of Copernicus, major advances in achieving higher accuracy and viewing fainter stars arose from observations by the Goddard High Resolution Spectrograph (Brandt et al. 1994) aboard the Hubble Space Telescope (HST) soon after its launch in 1990 (Cardelli et al. 1991a ; Cardelli et al. 1991b ; Savage et al. 1991 ; Savage et al. 1992 ; Cardelli et al. 1993 ; Sofia et al. 1993 ; Cardelli 1994). Savage and Sembach (1996) provided an excellent review of these early accomplishments with HST. A major upgrade in the ability to record a broad wavelength coverage at high resolution was provided when the Space Telescope Imaging Spectrograph was installed on the second servicing mission of HST in 1997 (Woodgate & et al. 1998). The Far Ultraviolet Spectroscopic Explorer (FUSE), launched in 1999, extended our coverage to a wavelength band between the Lyman limit and the short- wavelength cutoff of HST. This facility allowed us to determine the amount of H2 that accompanied the H I gas and also gave us an access to some important atomic transitions that were not available to HST (Moos et al. 2000).
2 A Unified Representation of Depletions
During the first 35 years of observations using the orbiting observatories to gather absorption line data, there had emerged a large number of publications that reported on a heterogeneous mix of different element abundances over a diverse collection of sight lines. The results by themselves were of significant value and led to interesting conclusions. Nevertheless, there still remained a need to consolidate the information from different sources and then systematically describe the outcomes in terms that linked the depletion of each element to those of the others, and at the same time, accounted for the variations that were known to take place from one region to the next. This task was accomplished in 2009 by Jenkins (2009), who interpreted the abundances of 17 different elements reported in more than 100 papers that covered 243 sight lines to different stars. He developed a simple unification scheme that described in straightforward parametric forms the logarithmic depletion factor of any element from the gas phase,
| (1) |
where is the column density of element , represents the column density of hydrogen in both atomic and molecular form, i.e., , and the reference abundance ratio can be taken from either the abundances measured for B-type stars or the Sun. It follows that the missing atoms that make up the relative contribution of element in the form of dust grains or large molecules is given (in linear terms) by the expression
| (2) |
Aside from constructing a unification scheme for element depletions that could lead to dust compositions, Jenkins had to exercise many quality control procedures and devise corrections to the earlier results that accounted for updated values for the transition strengths.
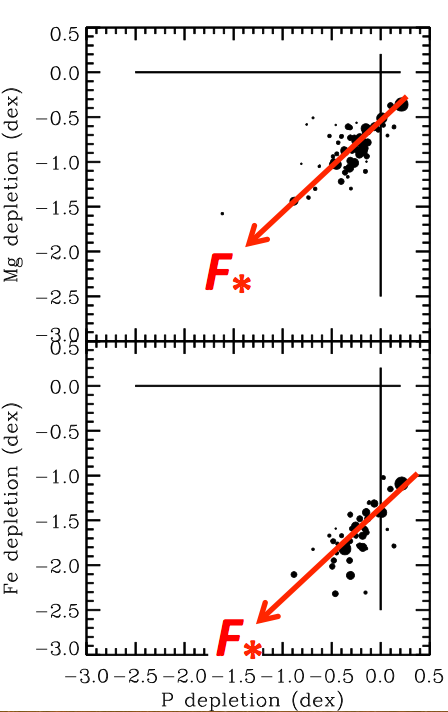
The basic foundation for the construction of a unified representation of depletions is based on the observation that any particular combination of two elements exhibits logarithmic depletions that have a linear relationship with each other. This concept is illustrated in Fig. 2. When compared to the logarithms of the depletions of P, the logarithmic depletions of Mg and Fe show a linear trend. Different sight lines have varying degrees of depletions of all three elements, and the overall severity of such depletions for any sight line can be characterized by a single parameter, which Jenkins designated as . The differences in the slopes and intercepts of the trend lines representing a progression of can be represented by just two additional parameters that are unique to each element. The sight-line parameter depends only on observed depletions, and it replaces the average density or molecular hydrogen fraction as a discriminant that had been used by earlier investigators (Jenkins, et al. 1986 ; Cardelli 1994 ; Snow et al. 2002). The adopted scale for was arbitrary: Jenkins defined to correspond to the weakest depletions that appeared in the survey, while represented the depletions seen toward the well studied, strongly depleted component toward the star Oph (Savage, et al. 1992). Occasionally, sight lines exhibited values of outside the range .
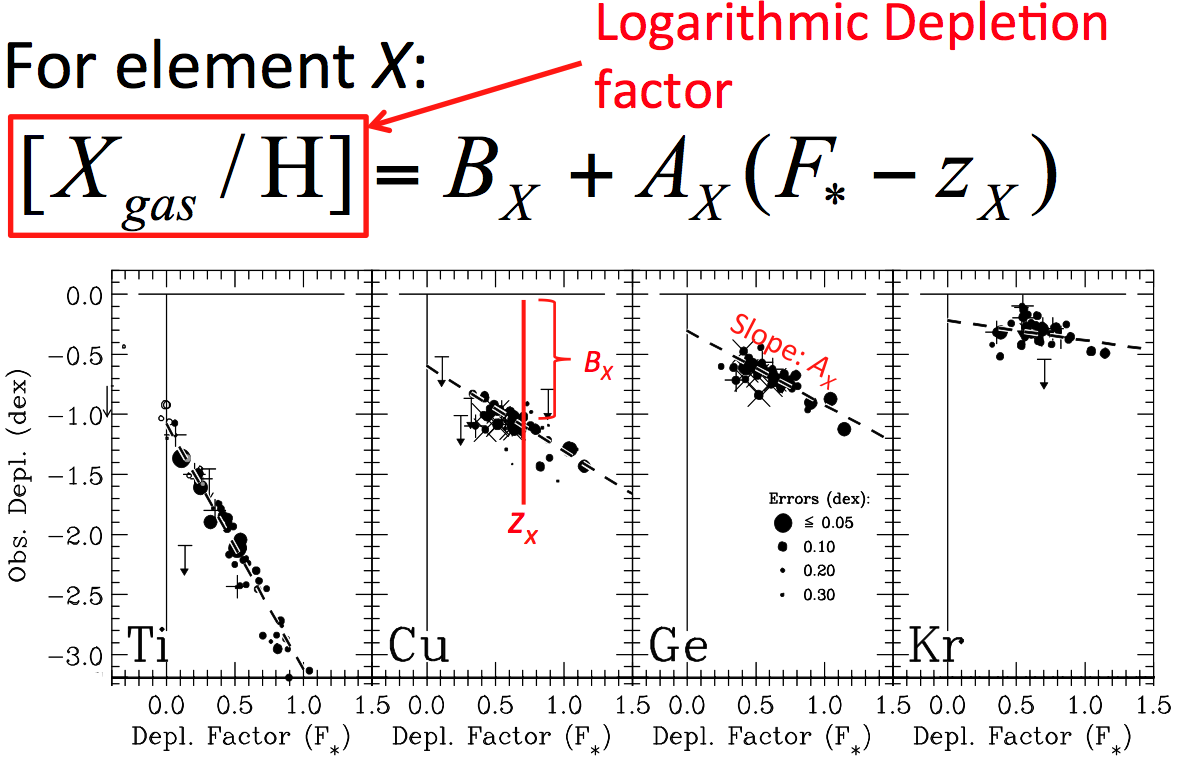
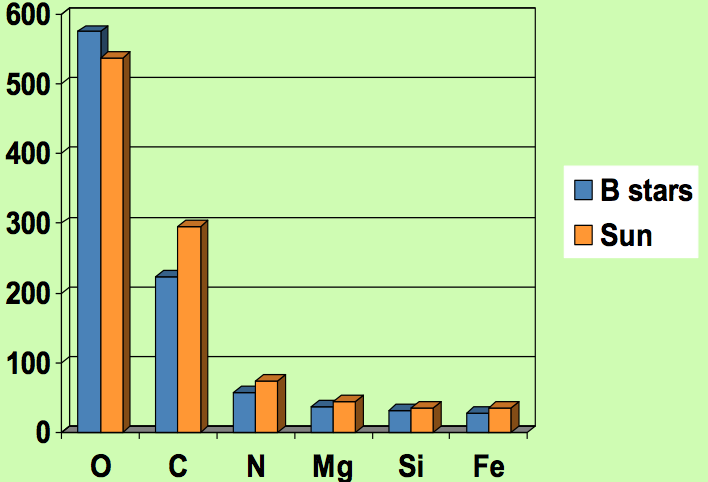
Figure 3 illustrates the manner by which Jenkins parameterized the depletion trends for different elements. Table 1 lists the values of , , and for the 17 elements in the study, along with the adopted reference abundances (taken to be solar abundances specified by Lodders (2003)). One drawback of having to rely on reference abundances is the fact that some of them are controversial. Figure 4 shows that there are some disagreements between B-star abundances (Nieva & Przybilla 2012) and solar abundances (Asplund et al. 2009). [We can ask the question “Why is it that for many heavy elements the abundances in the Sun (4.5 Gyr old) appear to higher than those in young B stars (several tens of Myr old)?” The answer may arise from a suggestion by Lyubimkov (2013) that ionizations in the standard stellar atmosphere models for early-type stars are underestimated. From Eq. 2 it should be clear that the answers that we will obtain for the dust elemental compositions will depend on the adopted reference abundances.
| Elem. | Adopted | |||
|---|---|---|---|---|
| C | 0.803 | |||
| N | 0.550 | |||
| O | 0.598 | |||
| Mg | 0.531 | |||
| Si | 0.305 | |||
| P | 0.488 | |||
| Cl | 0.609 | |||
| Ti | 0.430 | |||
| Cr | 0.470 | |||
| Mn | 0.520 | |||
| Fe | 0.437 | |||
| Ni | 0.599 | |||
| Cu | 0.711 | |||
| Zn | 0.555 | |||
| Ge | 0.690 | |||
| Kr | 0.684 |
3 The Buildup of Dust Grains
A method for overcoming the effects arising from uncertainties in the reference abundances is to develop an interpretation that avoids having to use them in the first place. Instead of attempting to derive the absolute quantities of elements sequestered in the grains, we can change our objective to that of monitoring the changes in element abundances as we progress from regions with low values of to ones where the grains have advanced to much greater stages of growth, as indicated by larger values of . If we substitute the right-hand side of the equation depicted in Fig. 3 into Eq. 2 and differentiate the result with respect to , we find that
| (3) | |||||
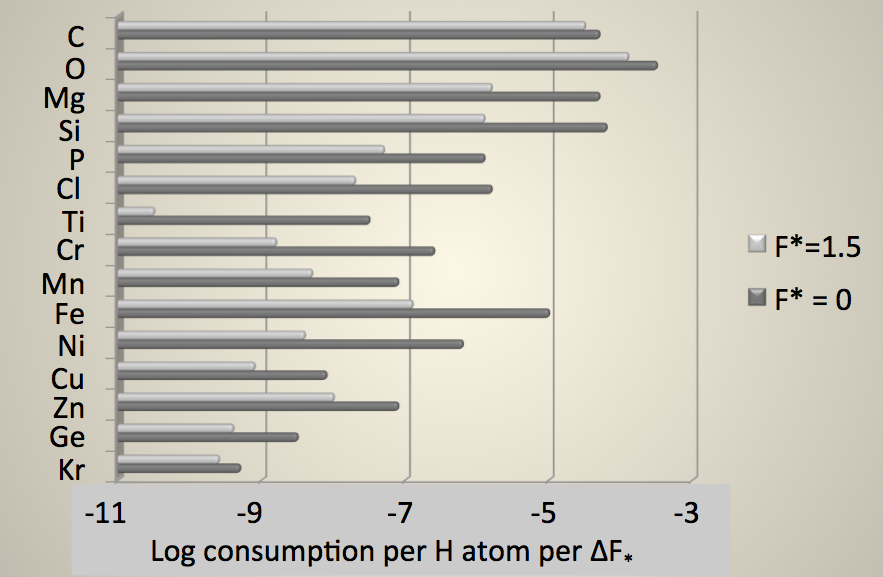
We now have an expression that makes use of only the slope and the (linear) expression for the relative abundance of the element with respect to hydrogen in the gas for any particular value of . The resulting consumption rates for different elements are shown in Fig. 5. These rates change as the grains mature, indicating that the compositions are driven by the abundance of the remaining gaseous feedstocks (free atoms) and perhaps also by the nature of the existing compounds in the grains with which new atoms can combine. For instance, we can see from the differences in the bar lengths in the figure that there is little change in the consumption rates of C and O, presumably because they remain abundant even after many grains have formed, whereas a less abundant element that starts out being rapidly depleted, such as Ti, arrives at the point where there are few atoms left to contribute to further grain growth. From the evidence that is presented here, it should be clear that the compositions of the outer mantles of grains differ from their inner cores that formed from gases that had higher concentrations of heavy atoms.
4 Properties of the Sight Lines
In §2 we considered that the basic premise for the development of the parameter was that the collective depletion of many elements gives the most reliable indication of the overall level of grain production for any given sight line, after one applies proper scalings to account for the elements’ depletion behaviors. The small scatter in the relationships between the depletions of most elements and justifies this choice, which appears to be more satisfactory the more traditional methods of using the environmental factors or as guides for grain development. Nevertheless, it is of interest to go back and see how well those measures compare with determinations of . Figure 6 shows these relationships. It appears that is a better predictor for than . This figure also shows that distances above or below the Galactic plane seem to have no systematic effects on the results.


5 Comparisons with Condensation Temperatures
Another issue that we can revisit is how well do the element depletion factors scale with the condensation temperature . This quantity has a specific meaning related to the formation of solid compounds when a cosmic mixture of free atoms experiences a progressive decrease in temperature at some specific pressure, as in the expanding stellar atmospheres or nebulae considered by Field (1974). There are, however, alternative processes that can be important. For instance, we can recognize that correlates well with other properties of atoms, such as ionization potentials (Snow 1975), binding energies to PAHs (Klotz et al. 1995), or sublimation energies (Barlow 1978) that govern the resistance of compounds to sputtering that can ultimately lead to the destruction of grain materials and the return of atoms to the gas phase. Over any large selection of elements, these properties are correlated with each other (e.g. see Fig. 5 of Ramírez et al. (2010) for a plot of vs. first ionization potentials), so identifying the most important processes is not straightforward. Nevertheless, we can propose that is a useful parameter to examine, even if it does not represent faithfully the most important formation and destruction routes.
The left-hand panel of Figure 7 shows how well the depletions at correlate with . While a trend seems evident, there are some awkward cases that involve 3 elements where negative depletions are apparent (i.e., abundances that seem to be greater than their respective reference abundances). An explanation for these anomalies may rest with either bad measurements, incorrect transition -values, or inaccurate reference abundances. A more satisfactory trend is seen when (the slope of logarithmic depletions vs. ) is compared with . Here, the dependences on -values or the adopted reference abundances are absent.
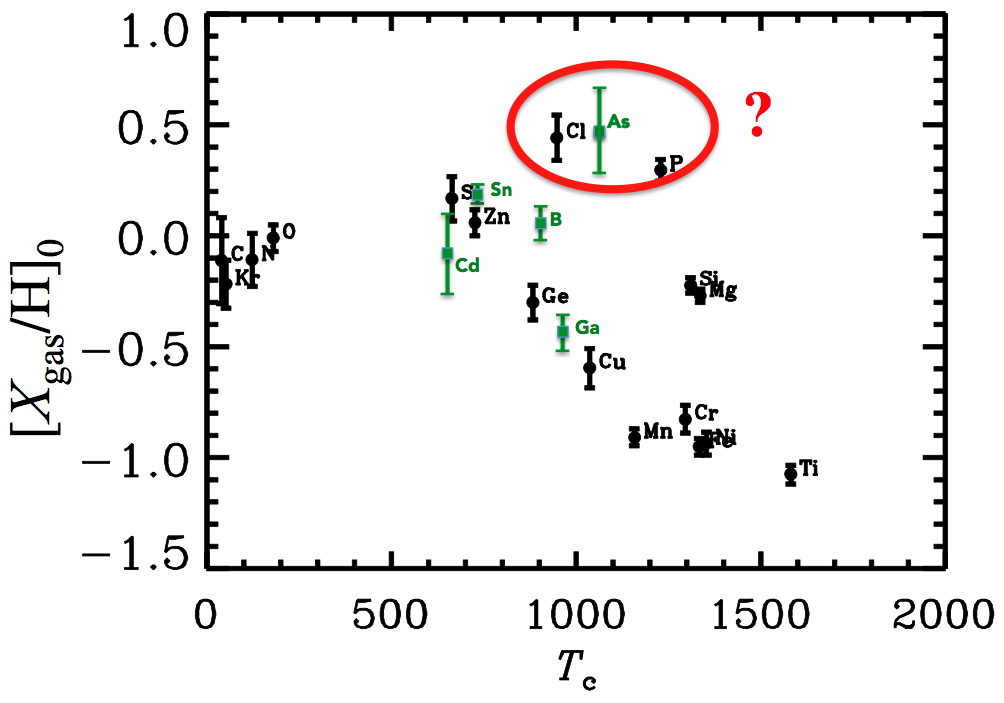
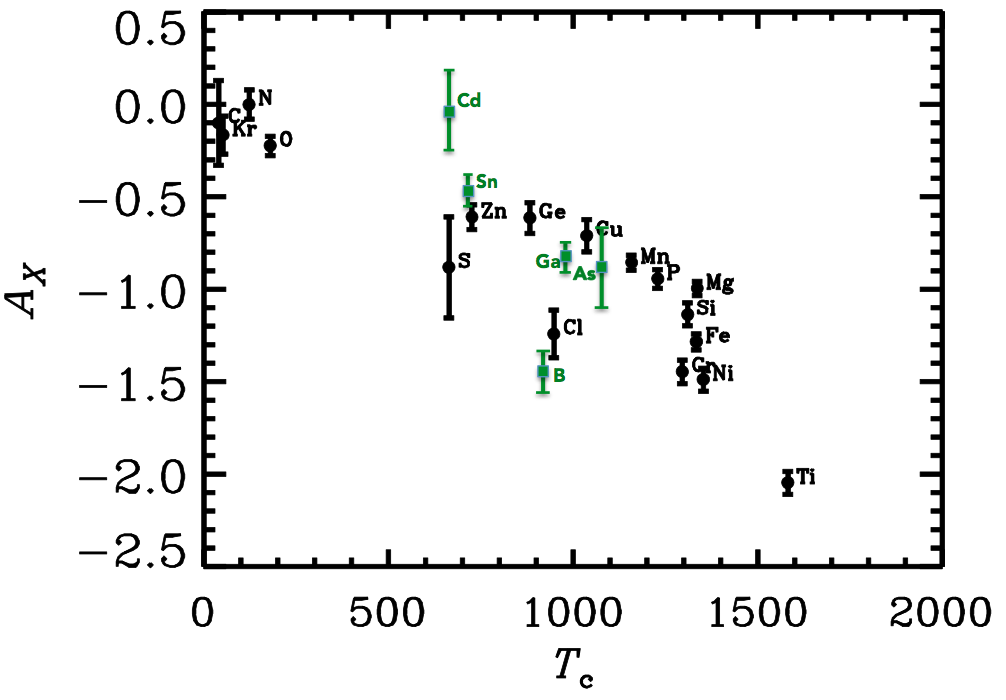
Recent studies that compare the differences of abundances in the atmosphere of the Sun compared to those of solar twins and solar analogs(Meléndez et al. 2009 ; Ramírez et al. 2009)111Ramírez, et al. (2009) define a solar twin as a star that has within 100 K, within 0.1 dex, and [Fe/H] within 0.1 dex of the respective values of the Sun. Solar analogs are main- sequence stars that have spectral types G0G5 (Meléndez, et al. 2009). show a pattern very similar to the vs. trend shown in Fig. 7, but much smaller in amplitude. A popular conjecture is that the refractory elements condense out to form dusty material that eventually goes into rocky planets or the interiors of gas giants, and that the remaining gas is dumped into a thin convection zone of the star. However, Ramírez et al. (2014) surveyed the differential abundances of many solar-type stars and were not able to find a good correlation of these depletions with the presence or absence of planets; the picture may be muddled by how deep the stars’ convection zones were at the time when the separations took place and the planetary disks formed.
6 Comments about Specific Elements
A number of interesting conclusions emerge from the findings for specific elements, as summarized in the subsections that follow.
6.1 Carbon
Many investigators (Snow & Witt 1995 ; Cardelli et al. 1996 ; Kim & Martin 1996 ; Mathis 1996 ; Dwek 1997 ; Li 2005) have expressed concerns that the C depletion results indicated that there was an insufficient amount of carbon in solid form to reconcile the observed optical and near-UV extinctions with calculations of the optical properties of dust grains, where the requirements for the fractional amounts of C in solids ranged from parts per million H atoms (ppm) (Mathis 1996) to 300 ppm (Draine & Lee 1984). This has often been referred to as the “carbon crisis.” If we apply Eq. 2 to the parameters shown in Table 1, we find that the amount of C locked up in dust grains ranges from ppm for to 111 ppm for . From this, one might conclude that the carbon crisis still remains. However, Sofia et al. (2011) have measured the damping wings of the 1334 Å allowed transition of C II in some spectra instead of the customarily-measured strengths of the very weak intersystem line at 2325 Å. They obtained interstellar carbon column densities that were about 0.43 times as large as those obtained from the weak line. If the revision suggested by Sofia, et al. is correct, then the carbon crisis may be mostly resolved, since now ppm for the two values of . It is generally true that the -values that are calculated for semi-forbidden lines are much less reliable than those for allowed transitions, which may indicate that the new C abundances are more trustworthy. However, an opposing consideration is the fact that Sofia, et al. had to measure damping wings on top of strong stellar C II lines, which they had to estimate from calculations of stellar model atmospheres and radiative transfer.
6.2 Nitrogen
Of all 17 elements studied by Jenkins (2009), nitrogen appears to be only one that shows no measurable change in depletion as is increased. The entries for nitrogen in Table 1 indicates that appears to hold at a steady value of dex, which is possibly consistent with no depletion at all. Gail and Sedlmayr (1986) suggested that the condensation of N into any sort of solid compound might be inhibited by the production of which has a saturated bond with a very high activation energy for any gas-phase reactions that could form other molecules. This may be an attractive theoretical consideration, but the observed abundance of N2 in the interstellar medium is small (Knauth et al. 2004, 2006).
6.3 Oxygen
A conventional view is that oxygen in dust grains appears in the form of refractory compounds such as silicates and metallic oxides. In this category, the elements Mg, Si, and Fe are the only ones with significantly high abundances to be relevant. We can examine whether or not the differential depletions O with respect to these three elements is consistent with this picture (again, this allows us to sidestep the uncertainties in the reference abundance of O, which, through the years, has shown large changes from one determination to the next; see §3.4 of ref (Asplund, et al. 2009) for details). At , Eq. 3 and the parameters in Table 1 tell us that , which is consistent with the most oxygen-rich silicate, MgSiO3 where the ratio of O to the other atoms is 1.5. However, when the differential consumption of O relative to the other three elements is ten times higher! Even when we consider the uncertainty in , we find that the ratio only drops to 6 times the consumption rate of Mg + Si + Fe.
Clearly, in addition to forming silicates or metallic oxides, oxygen must be in bound form with some other abundant element. We can rule out oxides of nitrogen, because the differential depletion of this element is about zero (see §6.2). Water ice seems to be an attractive prospect; it is known to be abundant in very dense clouds and protostellar nebulae (van Dishoeck 2004), but various surveys of the 3.6m ice band shows a linear trend with visual extinction that extrapolates to zero for (Whittet et al. 1988 ; Eiroa & Hodapp 1989 ; Smith et al. 1993) (most values for the sight lines in the UV surveys are less than 1). The molecules CO, CO2 and O2 are present in the interstellar medium, but not in amounts that are significant enough to explain the depletion of oxygen. Whittet (2010) has examined the oxygen depletion problem in some detail and concludes that organic refractory compounds may explain the extraordinary consumption of oxygen. Another possible solution might be that outside of the dense clouds H2O ice may still be retained on grains of large diameter (m) that are opaque to infrared radiation and hence would not exhibit the 3.6m absorption feature.
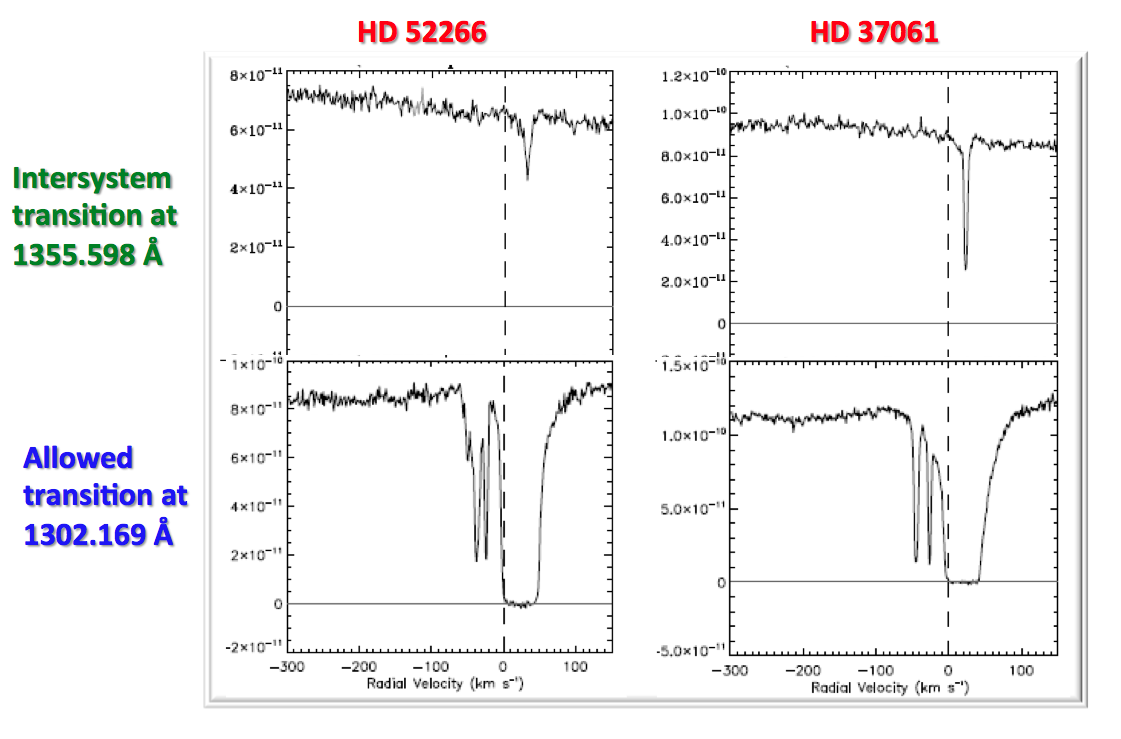
After having read §6.1, one might question whether or not the determinations of the abundance of O in the gas phase could be wrong because the adopted -value222Jenkins (2009) corrected all of the O I determinations based on the 1356 Å line so that they were consistent with an -value equal to given in the compilation of Morton (2003). of the weak line at 1356 Å was in error, much like the indications that we had with the 2325 Å line of C II. A large fraction of the oxygen measurements were made with this intersystem line. Figure 8 shows both the 1356 Å absorption and that from the permitted line at 1302 Å for two sight lines where high velocity features do not compromise our ability to see the damping wings of the strong line. A preliminary comparison of the two by the author indicates that the outcomes for the two lines show exceptionally good agreement with each other.
An entirely different way to sense the amount of oxygen in bound form is to examine the detailed structure of the K-edge X-ray absorption feature at a wavelength of 23 Å. When the oxygen atoms are chemically bound to other atoms, the energies of their electron states are perturbed slightly. The analysis of the absorption structures in the vicinity of the K-edge is rather complicated, owing to the presence of many additional features from higher ionization levels of free oxygen atoms (Juett et al. 2004). Pinto et al. (2013) examined the X-ray spectra of nine Galactic low-mass X-ray binaries obtained from the Reflection Grating Spectrometer on XMM-Newton. They found that the percentage of oxygen in chemically bound form ranges between 15 and 25% of the total amount of oxygen present. However, degeneracies in the signatures of different compounds prevented them from identifying the detailed chemical structure of oxygen-bearing substances. Their reported range for the percentage of bound oxygen corresponds to the UV absorption line results for .
6.4 Krypton
A surprising result to emerge from the study of krypton abundances is that varies from an extreme of to (see the right-most panel in Fig. 3). In the latest of a series of investigations of Kr, Cartledge et al. (2008) dismissed the notion that Kr could be depleted onto grains because it is a noble gas. Instead, they viewed the variations in Kr abundances as a consequence of differing contributions from nucleosynthetic activity in different regions of space. While this could remain a possibility, it is nevertheless evident that there is a trend that relates to , but only at an 89% level of confidence based on a Pearson correlation coefficient (with a one-tail test because we can reject positive values of ; also note from Table 1 that while is negative at only the level of significance,333A. M. Ritchey (private communication) has remeasured many Kr abundances, and his new results strengthen the significance of the negative slope for . is negative at the level). No trend was evident when Cartledge, et al. (2008) plotted against , which indicates that the average density along a sight line is probably a less accurate indicator of depletion than , which relies on elements with highly significant depletions as indicators.
It may be possible to understand the krypton depletions in terms of it binding either in the form of a clathrate hydrate (Lodders 2003) or in a complex with (Mousis et al. 2008). For the former, recall that in §6.3 we considered the possibility that large quantities of water ices may be on the surfaces of grains with large diameters. For the latter, we know that cosmic ray ionization can result in the creation of fractional abundances of as high as in low density regions of the interstellar medium (Indriolo & McCall 2012). For either of these means for sequestering Kr, it would be useful to perform calculations of the equilibrium concentrations that might be expected.
7 Concluding Remarks
A study of the depletions of different elements from the gas phase of the interstellar medium sets some important constraints on the possible compositions of dust grains in different stages of development or levels of concentration. However, we do not obtain explicit information on what compounds are formed. One can, however, make some illustrative guesses on the possible mixes of minerals that satisfy the constraints, as had been done by Draine (2004), who examined the results from a contemporaneous study of depletions by Jenkins (2004).
Some words of caution are in order. There may be some dangers in over-generalizing the results presented in §§23 when one considers grain compositions in systems other than our immediate neighborhood in our Galaxy. One might suppose that in a system where the proportions of different elements are not the same as what we see here, it would be a simple matter to estimate how rapidly the elements disappear into solid form by just integrating the differential depletion relationships, as expressed in Eq. 3, after starting with some initial gas composition. Complications arise when we recognize that some compounds rely on the presence of others to form initially and remain stable for long periods of time. For instance, Lodders (2003) has pointed out that the incorporation of the elements Ni and Ge in solids depends on the presence of a host element Fe to create an alloy. Likewise, the formation of refractory compounds that contain Zn and Mn, such as , , or , are aided by pre-existing host minerals such as forsterite and enstatite. In some galaxy environment where the differs from that of our own, some elements may have more or less than their respective host compounds that contain other key elements, thus altering the depletion rates in a way that is difficult to predict. We need also to recognize that any changes in the mix of sources that create the initial grains, such as different kinds of stars and supernovae, can have a profound influence on the outcome. These initial grains are important constituents by themselves, and moreover they eventually form the cores of grains that undergo further development in the interstellar medium.
References
- (1)
- (2) Asplund, M., Grevesse, N., Sauval, A. J., & Scott, P. 2009, ARA&A, 47, 481
- (3) Barlow, M. J. 1978, MNRAS, 183, 367
- (4) Boesgaard, A. M. 1985, PASP, 97, 37
- (5) Brandt, J. C., Heap, S. R., Beaver, E. A., et al. 1994, Publications of the Astronomical Society of the Pacific, 106, 890
- (6) Cardelli, J. A., Savage, B. D., Bruhweiler, F. C., et al. 1991a, ApJ, 377, L57
- (7) Cardelli, J. A., Savage, B. D., & Ebbets, D. C. 1991b, ApJ, 383, L23
- (8) Cardelli, J. A., Federman, S. R., Lambert, D. L., & Theodosiou, C. E. 1993, ApJ, 416, L41
- (9) Cardelli, J. A. 1994, Science, 265, 209
- (10) Cardelli, J. A., Meyer, D. M., Jura, M., & Savage, B. D. 1996, ApJ, 467, 334
- (11) Cartledge, S. I. B., Lauroesch, J. T., Meyer, D. M., Sofia, U. J., & Clayton, G. C. 2008, ApJ, 687, 1043
- (12) Cowie, L. L., & Songaila, A. 1986, ARA&A, 24, 499
- (13) Draine, B. T., & Lee, H. M. 1984, ApJ, 285, 89
- (14) Draine, B. T. 2004, in Origin and Evolution of the Elements, eds. A. Mc William, & M. Rauch (Cambridge: Cambridge Univ. Press), 317-335
- (15) Dwek, E. 1997, ApJ, 484, 779
- (16) Eiroa, C., & Hodapp, K. W. 1989, A&A, 210, 345
- (17) Ellison, S. L., Prochaska, J. X., & Lopez, S. 2007, MNRAS, 380, 1245
- (18) Field, G. B. 1974, ApJ, 187, 453
- (19) Gail, H. P., & Sedlmayr, E. 1986, A&A, 166, 225
- (20) Herbig, G. H. 1968, ZAp, 68, 243
- (21) Indriolo, N., & McCall, B. J. 2012, ApJ, 745, 91
- (22) Jenkins, E. B., Savage, B. D., & Spitzer, L. 1986, ApJ, 301, 355
- (23) Jenkins, E. B. 2009, ApJ, 700, 1299
- (24) —. 2004, in Origin and Evolution of the Elements, eds. A. Mc William, & W. Rauch (Cambridge: Cambridge Univ. Press), 336-353
- (25) Juett, A. M., Schulz, N. S., & Chakrabarty, D. 2004, ApJ, 612, 308
- (26) Kim, S. H., & Martin, P. G. 1996, ApJ, 462, 296
- (27) Klotz, A., Marty, P., Boissel, P., et al. 1995, A&A, 304, 520
- (28) Knauth, D. C., Andersson, B. G., McCandliss, S. R., & Moos, H. W. 2004, Nature, 429, 636
- (29) —. 2006, in Astrophysics in the Far Ultraviolet, Five Years of Discovery with FUSE, eds. G. Sonneborn, et al. (San Francisco: Ast. Soc. Pacific), 421-423
- (30) Li, A. 2005, ApJ, 622, 965
- (31) Lodders, K. 2003, ApJ, 591, 1220
- (32) Lyubimkov, L. S. 2013, Astrophysics, 56, 472
- (33) Mathis, J. S. 1996, ApJ, 472, 643
- (34) Meléndez, J., Asplund, M., Gustafsson, B., & Yong, D. 2009, ApJ, 704, L66
- (35) Moos, H. W., Cash, W. C., Cowie, L. L., et al. 2000, ApJ, 538, L1
- (36) Morton, D. C., Drake, J. F., Jenkins, E. B., et al. 1973, ApJ, 181, L103
- (37) Morton, D. C. 2003, ApJS, 149, 205
- (38) Mousis, O., Pauzat, F., Ellinger, Y., & Ceccarelli, C. 2008, ApJ, 673, 637
- (39) Nieva, M. F., & Przybilla, N. 2012, A&A, 539, 143N
- (40) Pinto, C., Kaastra, J. S., Costantini, E., & de Vries, C. 2013, A&A, 551, A25
- (41) Prochaska, J. X., Tripp, T. M., & Howk, J. C. 2005, ApJ, 620, L39
- (42) Ramírez, I., Meléndez, J., & Asplund, M. 2009, A&A, 508, L17
- (43) Ramírez, I., Asplund, M., Baumann, P., Meléndez, J., & Bensby, T. 2010, A&A, 521, 33
- (44) Ramírez, I., Meléndez, J., & Asplund, M. 2014, A&A, 561, 7
- (45) Rogerson, J. B., Spitzer, L., Drake, J. F., et al. 1973, ApJ, 181, L97
- (46) Routly, P. M., & Spitzer, L. 1952, ApJ, 115, 227
- (47) Savage, B. D., Cardelli, J. A., Bruhweiler, F. C., et al. 1991, ApJ, 377, L53
- (48) Savage, B. D., Cardelli, J. A., & Sofia, U. J. 1992, ApJ, 401, 706
- (49) Savage, B. D., & Sembach, K. R. 1996, ARA&A, 34, 279
- (50) Sembach, K. R., & Danks, A. C. 1994, A&A, 289, 539
- (51) Siluk, R. S., & Silk, J. 1974, ApJ, 192, 51
- (52) Smith, R. G., Sellgren, K., & Brooke, T. Y. 1993, MNRAS, 263, 749
- (53) Snow, T. P. 1975, ApJ, 202, L87
- (54) Snow, T. P., & Witt, A. N. 1995, Science, 270, 1455
- (55) Snow, T. P., Rachford, B. L., & Figoski, L. 2002, ApJ, 573, 662
- (56) Sofia, U. J., Savage, B. D., & Cardelli, J. A. 1993, ApJ, 413, 251
- (57) Sofia, U. J., Parvathi, V. S., Babu, B. R. S., & Murthy, J. 2011, AJ, 141, 22
- (58) Spitzer, L. 1949, ApJ, 109, 548
- (59) Spitzer, L., & Zabriskie, F. R. 1959, PASP, 71, 412
- (60) Spitzer, L., & Jenkins, E. B. 1975, ARA&A, 13, 133
- (61) Stokes, G. M., & Hobbs, L. M. 1976, ApJ, 208, L95
- (62) Stokes, G. M. 1978, ApJS, 36, 115
- (63) Vallerga, J. V., Vedder, P. W., Craig, N., & Welsh, B. Y. 1993, ApJ, 411, 729
- (64) van Dishoeck, E. F. 2004, ARA&A, 42, 119
- (65) Wallerstein, G., & Goldsmith, D. 1974, ApJ, 187, 237
- (66) Wallerstein, G., & Gilroy, K. K. 1992, AJ, 103, 1346
- (67) Welsh, B. Y., Sasseen, T., Craig, N., Jelinsky, S., & Albert, C. E. 1997, ApJS, 112, 507
- (68) Welty, D. E., & Crowther, P. A. 2010, MNRAS, 404, 1321
- (69) Whittet, D. C. B., Bode, M. F., Longmore, A. J., et al. 1988, MNRAS, 233, 321
- (70) Whittet, D. C. B. 2010, ApJ, 710, 1009
- (71) Woodgate, B. E., & et al. 1998, PASP, 110, 1183
- (72)