A WISE Survey of Circumstellar Disks in Taurus11affiliation: Based on data from the Wide-field Infrared Survey Explorer, the Spitzer Space Telescope, the Two Micron All-Sky Survey, the NASA Infrared Telescope Facility, the Hobby-Eberly Telescope, and the Digitized Sky Survey.
Abstract
We have compiled photometry at 3.4, 4.6, 12 and 22 m from the all-sky survey performed by the Wide-field Infrared Survey Explorer (WISE) for all known members of the Taurus complex of dark clouds. Using these data and photometry from the Spitzer Space Telescope, we have identified members with infrared excess emission from circumstellar disks and have estimated the evolutionary stages of the detected disks, which include 31 new full disks and 16 new candidate transitional, evolved, evolved transitional, and debris disks. We have also used the WISE All-Sky Source Catalog to search for new disk-bearing members of Taurus based on their red infrared colors. Through optical and near-infrared spectroscopy, we have confirmed 26 new members with spectral types of M1 – M7. The census of disk-bearing stars in Taurus should now be largely complete for spectral types earlier than M8 ( ).
1 Introduction
Complete samples of circumstellar disks in star-forming regions and accurate classifications of those disks represent a foundation for studies of star and planet formation. Both the identification of circumstellar disks and their classification are most easily performed using mid-infrared (IR) continuum emission from warm circumstellar dust. Because the atmosphere is bright and strongly absorbing at mid-IR wavelengths, space-based telescopes have provided the most sensitive data of this kind. The all-sky mid-IR images from the Infrared Astronomical Satellite IRAS; Neugebauer et al. 1984 enabled the first detections of circumstellar disks in star-forming regions. The most thorough census of disks was performed in Taurus because it is nearby ( pc; Wichmann et al. 1998; Loinard et al. 2005; Torres et al. 2007, 2009) and has a low enough stellar density that its members could be resolved by IRAS (Kenyon & Hartmann, 1995). Subsequent mid-IR telescopes, such as the Infrared Space Observatory (Kessler et al., 1996) and the Spitzer Space Telescope (Werner et al., 2004), have offered progressively better sensitivity and resolution, enabling detections of disks at fainter levels and in more crowded fields. Due to its modest field of view (5), Spitzer primarily observed more compact star-forming regions (Lada et al. 2006; Sicilia-Aguilar et al. 2006; Dahm & Hillenbrand 2007; Hernández et al. 2007; Luhman et al. 2008; Gutermuth et al. 2009), although it was able to map a significant fraction of a few widely distributed populations such as Taurus (Luhman et al. 2010; Rebull et al. 2010).
The latest mid-IR satellite, the Wide-field Infrared Survey Explorer (WISE; Wright et al. 2010), has lower spatial resolution than Spitzer but it covered the entire sky. As a result, WISE provides mid-IR photometry for the portions of large star-forming regions and associations that were not imaged by Spitzer. For instance, WISE data have been used to search for new disk-bearing stars in Taurus (Rebull et al., 2011) and to classify disks among the known members of Upper Sco (Luhman & Mamajek, 2012). Because of the importance of Taurus in studies of disks and because proper use of WISE data requires great care, we have performed our own search for new members with disks in Taurus, and have classified all the disks that we have detected around the known members. In this paper we begin by compiling photometry from 3 to 24 from both WISE and Spitzer for all known members of Taurus (Section 2). With these data, we then measure mid-IR excesses (Section 3) and classify the evolutionary stages of the detected disks (Section 4). Finally, we use WISE photometry in conjunction with proper motions, color-magnitude diagrams, and follow up spectroscopy to identify new members of Taurus (Section 5).
2 Photometric Data
2.1 Known Members of Taurus
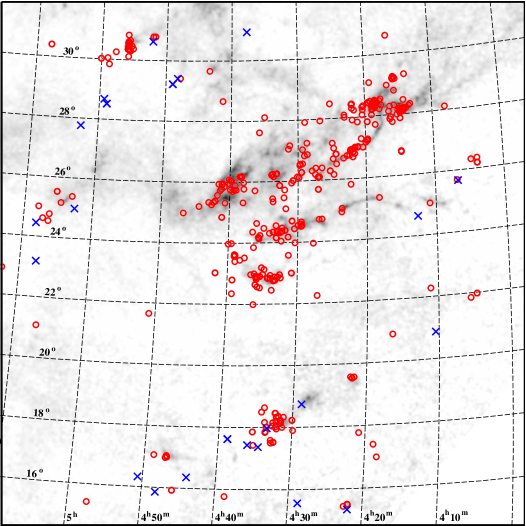
To construct a census of the circumstellar disks in Taurus, we begin by compiling a list of all known members of the region. We adopt the 352 members from Luhman et al. (2010), four additional stars that have good evidence of membership from previous studies (Section 5.4), 32 members found in a subsequent survey by Luhman (in preparation; 33 if GZ Tau A and B are counted separately), and 25 new members (26 if BS Tau A and B are counted separately) that we have confirmed with spectroscopy (Section 5.3). We also adopt as a member HD 285957, which has a proper motion consistent with that of the Taurus subgroup L1551 (Zacharias et al., 2013; Luhman et al., 2009) and exhibits evidence of youth in the form of Li absorption (Wichmann et al., 2000; Sestito et al., 2008). Known multiple systems are treated as single sources in our census unless they are resolved by either Spitzer or the Two Micron All-Sky Survey (2MASS; Skrutskie et al., 2006). The resulting catalog contains 414 sources and is presented in Table 1. The spatial distribution of these members is illustrated in a map of the Taurus dark clouds in Figure 1.
2.2 Spitzer Photometry
We make use of mid-IR photometry for members of Taurus measured with Spitzer’s Infrared Array Camera (IRAC; Fazio et al. 2004) and the Multiband Imaging Photometer for Spitzer (MIPS; Rieke et al. 2004). We consider the four bands of IRAC (3.6, 4.5, 5.8, and 8.0 m) and the 24 m band of MIPS, which are denoted as [3.6], [4.5], [5.8], [8.0], and [24], respectively. IRAC produced images with a field of view of and FWHM of for [3.6] to [8.0]. MIPS had a field of view of and a FWHM of for [24].
Photometry from most Spitzer images for most members of Taurus has been measured by Luhman et al. (2010) (see also Hartmann et al. 2005a; Luhman et al. 2006; Guieu et al. 2007; Rebull et al. 2010). We have measured photometry of the members that were not considered in Luhman et al. (2010) and all known members appearing in Spitzer images that have become publicly available since that study (Astronomical Observation Requests 26470912, 26471168 26477056, 26475264, 26472704, 26473216, and 23272448). These data were measured with the methods described by Luhman et al. (2010) and are presented in Tables 2 and 3. Members identified after Luhman et al. (2010) that were not detected or observed by Spitzer are not included in these tables.
In Table 1, we have constructed a compilation of all Spitzer photometry from Luhman et al. (2010) and Tables 2 and 3 for all known members of Taurus. For members imaged at multiple epochs, we report the mean values weighted by the inverse square of the flux errors. Sources that lack photometry due to saturation, extended emission, or non-detection are indicated. Components of binaries that are resolved by IRAC have separate entries in Table 1. A few of these pairs are unresolved in the MIPS images. The combined MIPS photometry for these systems is listed under the brighter component. For the 378 members imaged by IRAC, all are detected in at least one band. MIPS observed 331 members and detected 244 of them.
2.3 WISE Photometry
In addition to the Spitzer data, we also utilize the more recent mid-IR photometry measured by WISE. The four WISE photometric bands are centered at 3.4, 4.6, 12, and 22 m and are denoted as through (Wright et al., 2010). The first three bands have an angular resolution of while has a resolution of . For unconfused areas near the ecliptic plane, WISE typically achieved a signal-to-noise ratio of 5 at , , , and (Cutri et al., 2012b).
To compile the WISE photometry in Taurus, we began by retrieving all sources from the WISE All-Sky Source Catalog (Cutri et al., 2012a) within of the known members. We then inspected all images in the four WISE bands for all members that lacked a matching WISE source. We found that IRAS 04166+2706 and IRAS 04368+2557 are dominated by extended emission in and , which resulted in significant offsets in the coordinates in the WISE catalog from the true positions. HBC 360 and HBC 361 comprise an pair that is only partially resolved by WISE. One source near the midpoint of the pair is present in the All-Sky Catalog but the components have separate sources associated with them in the AllWISE Source Catalog. Although IRAM 04191+1522 does not have a counterpart in the All-Sky Catalog, it is visible in the WISE images and is present in the AllWISE Source Catalog. Therefore, we adopt the data for HBC 360, HBC 361, and IRAM 04191+1522 from the latter. Thirteen companions that were resolved by IRAC and hence have separate entries in our catalog of members were unresolved from their primaries in the WISE images.
We have taken additional steps to verify the reliability of the WISE data in the same manner preformed by Luhman & Mamajek (2012) for Upper Sco. In summary, we omitted measurements of brighter than a magnitude of 6 because of their large systematic errors (Cutri et al., 2012b), visually examined all WISE images for false detections, identified sources that may be contaminated by extended emission or the point-spread function (PSF) of another star, and checked for sources whose positions differed significantly among the WISE bands. During the inspection of the images, we noticed that L1521F-IRS was detected in and but had a measurement in only in the All-Sky Catalog. We found photometry for it in the AllWISE Source Catalog, which we have adopted. For two unresolved multiple systems, HD 28867 A+B+C and XEST 09-042+2MASS J04355949+2238291, the centroid of the WISE source shifts with wavelength, leading us to ascribe different bands to different components of the systems. In total, we report WISE photometry in at least one WISE band for 401 of the entries in Table 1.
3 Measurement of Infrared Excess Emission
Circumstellar disks emit radiation predominately at IR and millimeter wavelengths. Beyond 5 m, this radiation surpasses photospheric emission in brightness and can be used to detect the presence of a disk. Following a similar procedure to Luhman & Mamajek (2012), we identify and measure excess emission of Taurus members using colors produced by the Spitzer and WISE data relative to the band (2.2 ). In this analysis, we use the average Spitzer measurements in Table 1. For most members, we adopt photometry from the 2MASS Point Source Catalog. We use the magnitudes for HV Tau C, IRAS 04111+2800G, and DG Tau B from Terada et al. (2007), the United Kingdom Infrared Telescope Infrared Deep Sky Survey (UKIDSS; Lawrence et al., 2007), and the 2MASS Extended Source Catalog, respectively. We exclude the 2MASS magnitudes for the binary system J1-4872 A and B because of their large uncertainties (see Luhman et al. 2010). IRAS 04368+2557, IRAM 04191+1522, L1521F-IRS, IRAS 04166+2706, and SST Tau 041831.2+28161 are known protostars (Furlan et al. 2008; Furlan et al. 2011) and are too heavily obscured for measurements. We also exclude any WISE or Spitzer data with errors 0.25 mag from our analysis. As in Luhman & Mamajek (2012), we examine [4.5], [8.0], [24], , , and for excess emission.
We have corrected the Spitzer and WISE colors for extinction prior to measuring excess emission. To do this, we used extinction estimates at from a variety of sources, as indicated in Table 1. These extinctions are the same as those adopted by Furlan et al. (2011) for the stars appearing in that study. The values of were converted to color excesses with the two reddening curves for high () and low () extinction from McClure (2009). We did not attempt to deredden the colors for the 47 sources that lack extinction estimates, such as protostars and edge-on disks (see Furlan et al. 2011).
Since photospheric colors vary with spectral type, we plot the dereddened colors versus spectral type in Figure 2. Stars without extinction estimates are plotted at their observed colors. For each color, the stellar photospheres form a narrow, blue sequence while stars with disks have a broad distribution of redder colors. The color thresholds used for identifying excesses are shown in Figure 2. In the remainder of this section, we discuss the measurements of excess emission in each of the six Spitzer and WISE bands that we have considered. The bands exhibiting excess emission relative to are indicated in Table 1 for each member of Taurus. We also analyzed the excesses of members that lack photometry. J1-4872 A and B show no excess at longer wavelengths when compared to [3.6]. Since the remaining sources without are protostellar, we mark each of their detected bands as having an excess.
3.1 Excess in [4.5] and
We discuss the data for [4.5] and together because of their similar effective wavelengths (4.5 and 4.6 m). Photometry in [4.5] and is available for 366 and 360 members of Taurus, respectively. Stars that lack [4.5] are either saturated, not detected (L1521F-IRS), or not imaged by IRAC. Members without are too bright for good photometry, dominated by extended emission, or blended with another object. All of the stars imaged by IRAC without [4.5] also lack photometry, while 44 of the stars without are measured in [4.5]. The 39 stars that were not observed by IRAC in [4.5] were detected by WISE, although two of them, MWC 480 and HD 29763, are too bright for good photometry in this band. Consequently, 404 and 322 members have data in at least one or both of these two bands, respectively.
To identify the stars that exhibit significant excesses, we have selected a boundary that follows the sequences of stellar photospheres in the diagrams for and versus spectral type in Figure 2. The boundary is defined by the lines connecting the points (B0, 0.19), (K2, 0.26), (M2, 0.34), (M8.5, 0.74), and (L0, 1.6). The boundary is uncertain later than M8.5 because there are few members in this regime and the colors increase rapidly at these latest spectral types. At L0, the boundary is placed just above the colors of 2MASS J04373705+2331080 since it lacks an excess at longer wavelengths (Luhman et al., 2010). Since the average offset between [4.5] and is only 1% (Cutri et al., 2012b), we use the same boundary for both colors. We also examined the objects in Figure 2 that lack spectral types. All of these sources exhibit large excesses if we adopt the spectral types that are consistent with their photometry.
We checked for discrepancies between excesses in [4.5] and and data at other bands. 2MASS J04215450+2652315 and V410 Tau have a small excess in and /[4.5], respectively. However, both stars have colors consistent with stellar photospheres at longer wavelengths. GM Aur shows excess in [4.5] and other bands but is slightly below our boundary in . We indicate the presence of excess in for this star in Table 1. For all other sources with excesses in [4.5] and , excess emission is also detected at longer wavelengths.
3.2 Excess in [8.0]
Photometry at [8.0] has been measured for 369 members of Taurus. Stars that lack [8.0] were either saturated or not observed by IRAC. Since excess emission from disks increases at longer wavelength, the gap between the diskless and disk-bearing members is larger for than it was for and , as shown in Figure 2. We define our threshold for excess by connecting the points (B0, 0.19), (K2, 0.32), (M0, 0.45), (M8.5, 1.01), and (L0, 2.2). As done in the previous section, we use 2MASS J04215450+2652315 to guide the L0 boundary. All objects that have excesses at [8.0] also exhibit excess emission at longer wavelengths when such data are available. One star, V410 X-ray 7, has no excess at or [4.5], a slight excess at [8.0] and is unresolved from a nearby bright star at [24]. We tentatively conclude that V410 X-ray 7 has excess emission at [8.0]. The remaining stars without photometry at longer wavelengths have fairly large excesses at [8.0] ( 1.5).
3.3 Excess in
There are 358 members of Taurus with detections in after excluding sources with errors 0.25. Members without photometry were either unresolved from a nearby star or not detected. Our boundary for excess is defined by the points at (B0, 0.18), (G8, 0.33), and (M9, 1.52). As done in previous bands, we checked whether sources with excesses have excesses at longer wavelengths. 2MASS J04215851+1520145 has a small excess in , was not detected in , and was not imaged by MIPS. The detection limit in does not place a useful constraint on the presence of excess emission. All other excesses are large or are supported by detections of excess in or [24].
3.4 Excess in [24] and
We discuss the analysis of [24] and together because they have similar effective wavelengths (23.7 and 22 m). As done with , we only analyzed measurements with errors less than 0.25, corresponding to 242 and 244 sources with [24] and , respectively. Among the 66 sources with data in but not [24], 45 were not imaged by MIPS, 20 were saturated in MIPS, and one (MHO 2) was unresolved from a saturated source. MIPS provided data for 64 members that were not detected reliably at ( or not detected). Data in at least one of these two bands is available for 308 members of Taurus.
Because advanced stages of disk evolution (e.g., debris disks; see Section 4) can have arbitrarily small excesses at 24 m and no excesses at shorter wavelengths, we have selected a boundary that attempts to identify the smallest excesses that appear to be significant. This boundary is defined as (B0, 0.11), (K6, 0.56), and (M9, 1.38). Since the sequence of diskless members is not well-populated in , we adopt this boundary for as well.
We find that 256 members exhibit excess emission at or [24]. Thirteen of these stars lack excess at shorter wavelengths, consisting of 10 stars for which [24] excesses have been noted previously (Furlan et al. 2011; Luhman et al. 2010, references therein) and new detections of excesses in or [24] for 2MASS J04400174+2556292, 2MASS J04414565+2301580, and 2MASS J04242321+2650084. The latter excesses were not identified in previous studies because we have adopted a lower boundary for [24] excess, the star was not imaged by MIPS, and the object was recently added to the membership list, respectively.
Among the 106 objects without reliable photometry in either or [24], 86 lack excess emission at shorter wavelengths. Seven of the 86 stars have early spectral types, and hence are bright, but they lack good limits on or [24] because they are unresolved from other stars, dominated by extended emission, or were not imaged by the more sensitive MIPS. For the 79 remaining stars, which have late types, the limits on [24] and do not place useful constraints on the presence of excess emission.
Although we did not analyze any bands at wavelengths longer than [24]/, we were able to perform two tests of our identifications of excesses. First, we compared the results between and [24]. Although we identified HD 286178 as a candidate member because of its excess (see Section 5.4), it does not show an excess at [24]. HD 28929 also shows excess at and not at [24]. Because the MIPS photometry is more accurate, we list these two stars as not having an excess in either band. For all other stars with data at both [24] and , the detections of excesses agree between the two bands. As a second test of the excesses, for the 13 stars with excess emission at [24]/ and not at shorter wavelengths, we examined available m photometry from the Photodetector Array Camera and Spectrometer (PACS; Poglitsch et al. 2010) on the Herschel Space Observatory (Pilbratt et al., 2010). Because the PACS images are not sensitive enough to detect the stellar photospheres of these stars, any detections indicate the presence of excess emission at m. V819 Tau, JH 56, FW Tau, RXJ 0432.8+1735, 2MASS J04403979+2519061, XEST 17-036, and 2MASS J04414565+2301580 are detected by PACS, while LkCa 19, V410 X-ray 3, 2MASS J04400174+2556292, and 2MASS J04242321+2650084 were imaged by PACS but were not detected (Howard et al., 2013). The two remaining stars, LkHa 332/G2 A+B and XEST 08-003, have not been imaged by Herschel. Because they are only slightly above our /[24] thresholds and were not detected or imaged by Herschel, we report only tentative detections of excesses for XEST 08-003, V410 X-ray 3, LkHa 332/G2 A+B, and 2MASS J04400174+2556292.
4 Classification of Disks
4.1 Terminology
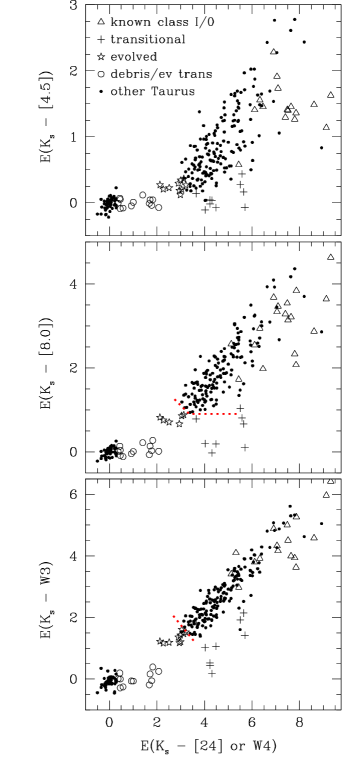
A variety of names, definitions, and classification schemes have been proposed for the evolutionary stages of circumstellar disks. We adopt the disk classes from Espaillat et al. (2012), which are defined as follows: full disks are optically thick at IR wavelengths and lack significant clearing of primordial dust and gas; pre-transitional and transitional disks have large inner gaps or holes in their dust distributions, respectively; evolved disks are becoming optically thin but have not experienced significant clearing; evolved transitional disks are optically thin and have large holes; debris disks are composed of dust generated by collisions of planetesimals. Using the classification scheme described in Luhman & Mamajek (2012) and the Spitzer and WISE photometry that we have complied, we have estimated the disk classes for Taurus members that exhibit IR excess emission (Section 3) based on their IR colors, as described in this section.
4.2 Disk Classes in Taurus
We estimated the evolutionary stages of disks using extinction-corrected color excesses relative to photospheric colors (e.g., ). The excess in a given band was computed as the difference between the observed color and the average color for young stellar photospheres at the spectral type in question. For the Spitzer bands, we adopted the photospheric colors from Luhman et al. (2010). The and colors were approximated by the similar and colors, respectively. We determined the photospheric colors for by a fit to the observed diskless sequence in Figure 2. The resulting excesses of Taurus members are plotted in Figure 3. Because of their similar wavelengths, data from [4.5]/ and [24]/ are presented together. When both Spitzer and WISE data are available in those bands, we plot the former. IRAS 04016+2610, Haro 6-5B, GV Tau A+B, and CoKu Tau/1 have large excesses in all bands and are too red to appear within the selected boundaries of Figure 3.
Following the procedure of Luhman & Mamajek (2012), we classify the disks using the , , and colors. In Figure 3, we show the boundaries between full disks and other sources, which are defined by the lines connecting the points (, ) = (2.75, 1.25), (3.36, 0.90), and (5.5, 0.90) in the middle panel and (, ) = (2.72, 2.02) and (3.55, 1.25) in the lower panel. We classify disks above one or both boundaries as full. For bluer sources, we apply the following criteria: transitional disks have ; evolved disks have , , and ; and debris disks and evolved transitional disks have , , and . While these boundaries reproduce the results in Luhman & Mamajek (2012), they have been adjusted slightly to produce nearly the same classifications in Taurus as those from Luhman et al. (2010). Because of their similar mid-IR spectral energy distributions (Carpenter et al., 2009), debris disks and evolved transitional disks require measurements of gas content to be distinguished from each other. Although GM Aur is slightly above the boundary for full disks in the middle panel of Figure 3, we mark it as transitional since it has been widely treated as such. Meanwhile, UX Tau A is classified as a primordial disk because it is above the boundary in , but it does have a relatively low value of , which reflects the fact that it is a pre-transitional disk (Furlan et al., 2006). Although previously classified as full by Luhman et al. (2010), 2MASS J04214631+2659296 is most likely a transitional disk that is becoming optically thin because of its unusual spectral shape (Furlan et al., 2011) and faint [24]/ photometry, which places it below the boundary for full disks in the second panel of Figure 3 and above in the third panel.
We also classified the disks for members that lacked , [8.0], and/or [24]/ but had excesses. Disks without [24]/ data were classified as full if the excesses at [8.0] or were sufficiently high to exclude other disks types. If the excesses at [8.0] and were both too small for full disks, the disks were classified as evolved if the upper limits on [24]/ excluded transitional disks and were marked as evolved or transitional if the [24]/ limits did not provide useful constraints. Objects with [4.5]/ excesses but no data at longer wavelengths were classified as full. Finally, all members that lack spectral classifications or -band photometry (mostly protostars) have large enough excesses to indicate the presence of full disks.
Our disk classifications are listed in Table 1. Known or suspected protostars (class 0 or I) are also indicated (Furlan et al. 2008; Furlan et al. 2011). The 414 entries in Table 1 contain 239 full disks, 10 transitional disks, 13 evolved disks, 13 evolved transitional/debris disks, and one disk that is either evolved or transitional. The remaining 138 members lack excess emission. For members known prior to this study, our classifications agree with those given in Luhman et al. (2010) and Furlan et al. (2011) except for the following: 2MASS J04400174+2556292, 2MASS J04414565+2301580, 2MASS J04214631+2659296, 2MASS J04390163+2336029, and 2MASS J04284263+2714039. The first three have been discussed earlier in this study. 2MASS J04390163+2336029 lacks [4.5] and [8.0], and the data in [5.8] and [24] considered by Luhman et al. (2010) suggested a full disk. We now classify it as an evolved disk after including the WISE bands. 2MASS J04284263+2714039 is classified as an evolved disk in this study but not by Luhman et al. (2010) because we have used extinction-corrected colors rather than observed colors. In addition, the new members that we have added to our census of Taurus (see Section 2.1) contain seven evolved disks (V1195 Tau, 2MASS J04380191+2519266, 2MASS J04374333+3056563, 2MASS J04215851+1520145, 2MASS J04284199+1533535, 2MASS J05073903+2311068, and 2MASS J05122759+2253492), three transitional disks (2MASS J04355760+2253574, 2MASS J04343128+1722201, and 2MASS J05080709+2427123), one evolved transitional/debris disk (2MASS J04242321+2650084), and 31 full disks.
5 Identification of New Members of Taurus
5.1 Candidate Members from WISE
In addition to identifying and classifying the disks of known members of Taurus, we have searched for new members that have disks via their red WISE colors. We began by retrieving from the WISE All-Sky Source Catalog all objects between – in right ascension and – in declination (J2000), which encompasses all known dark clouds and young stars in Taurus (see Figure 1). In our analysis, we considered only data with errors less than 0.1 mag. We excluded sources that are spurious detections of diffraction spikes in or , as indicated by the parameter “cc_flag” in the WISE catalog. Known members of Taurus were also removed from the list. These criteria resulted in a list of 1.4 million sources.
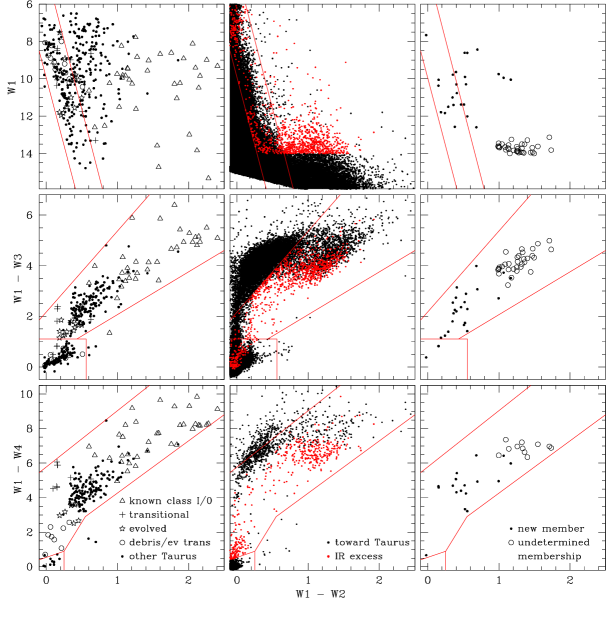
We searched the catalog from WISE for objects with colors similar to those of known disk-bearing members of Taurus. To demonstrate how this was done, we show in Figure 4 color-color and color-magnitude diagrams constructed from the WISE bands for the known members of Taurus and for the other WISE sources in our survey field. To minimize contamination by non-members, we selected boundaries that cover the smallest range of colors while also encompassing most of the known disks. The only disk-bearing member not enclosed within these boundaries, IRAS 04302+2247, has unusual colors because it is seen in scattered light (Furlan et al., 2008). We also defined boundaries that enclose most of the members that lack excesses and have photospheric colors. The definitions of these boundaries are provided in Table 4. Using these boundaries, we identified as candidate disk-bearing members of Taurus the WISE sources that satisfy all of the following: 1) , 2) excess in at least one diagram, 3) excesses in all available bands long ward of some wavelength, and 4) in the excess or photosphere regions in all diagrams (i.e., not in the lower right or upper left in either color-color diagram). In addition, we rejected sources with non-detections or large errors ( mag) in both and where the limits of the respective colors exclude the presence of excess emission. These criteria produced 1062 candidates, which are split among Tables 5, 6, and 7, as described in the following sections.
5.2 Additional Membership Constraints
Given that Taurus contains 250 known members with disks, it is likely that most of the 1062 candidates from WISE are not members. To further refine this sample of candidates, we have employed visual inspection of available images, optical/IR color-magnitude diagrams, IRAC photometry, and proper motions.
We visually inspected the images of each candidate from DSS, the Sloan Digital Sky Survey (SDSS, York et al. 2000), 2MASS, and WISE. Objects were rejected if 1) reliable detections were not present in the WISE bands that exhibited excess emission, 2) the WISE source was contaminated by emission from a nearby object, 3) the centroid shifted among the WISE bands, indicating that the WISE source was a blend of multiple objects, or 4) the candidate was resolved as a galaxy in any of the surveys. This inspection eliminated 454 sources. We also rejected 39 other candidates that have been previously classified as galaxies, planetary nebulae, asymptotic giant branch stars, cataclysmic variables, or other non-members according to the SIMBAD database. The candidates WISE J043809.73+254731.5, J041810.61+284447.3 and J041556.86+290750.9 are non-members based on unpublished spectra from a separate survey (K. Luhman, in preparation).
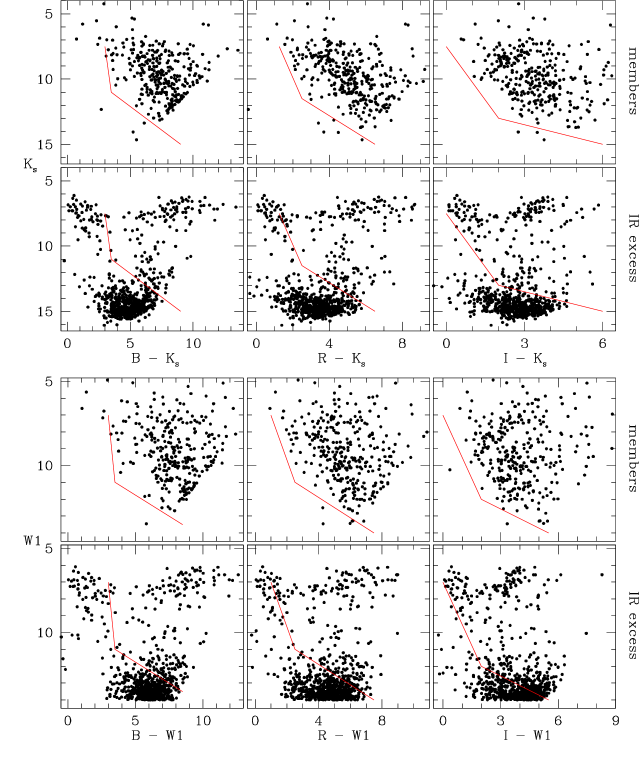
In Figure 5, we show color-magnitude diagrams constructed from 2MASS, WISE, and USNO-B1.0 (B R I; Monet et al. 2003) for the known Taurus members and the 1062 WISE candidates. For objects with USNO data at two epochs, we adopted the more recent measurements. As done in the previous section, we have selected boundaries in these diagrams that encompass most of the known members, which are defined in Table 8. The few members that are below these boundaries are known or suspected to be seen in scattered light (e.g., edge-on disks), resulting in their underluminous positions. For candidates detected by 2MASS with , we rejected sources that are below or to the left of the boundaries in any of the three 2MASS/USNO diagrams. For candidates that were not detected by 2MASS, we applied the criteria from the WISE/USNO diagrams instead (). In total, we reject 631 and 96 sources with the 2MASS/USNO and WISE/USNO criteria, respectively.
Some of our WISE candidates were identified based only on red colors, and lacked detections in or that could confirm the presence of excess emission. These objects were also found to follow the spatial distribution of the Taurus dark clouds. Since a large area in Taurus was imaged by IRAC, we can use the available [5.8] and [8.0] data as an independent verification of excess at [4.5]/ for this subset of candidates. The boundary divides known members with and without excess at [4.5]/. Using photometry from all IRAC images of Taurus (Luhman et al. 2006; Luhman et al. 2010), we have rejected 69 WISE candidates that lack and detections and that have . Given that these candidates are projected against the dark clouds in Taurus, they are probably background stars that are red in because of extinction. This source of contamination should be largely eliminated from our candidate list since IRAC imaged most of the Taurus dark clouds.
We can use proper motions to further constrain the membership of the WISE candidates. Using proper motions from UCAC4 (Zacharias et al., 2013), we reject WISE candidates that differ by more than 2 from all of the average motions of the Taurus groups (Luhman et al., 2009). For candidates rejected by UCAC4 proper motions but not the other criteria described above and for candidates without UCAC4 data, we examined the proper motions from other catalogs (Monet et al. 2003; Röser et al. (2008); Roeser et al. 2010; Zacharias et al. 2010). Three of these stars, 2MASS J04124068+2438157, 2MASS J05080709+2427123, and 2MASS J05073903+2311068, have proper motions from those catalogs that support membership, while 2MASS J04322815+2711228 is rejected. In addition, we examined images from DSS and 2MASS for the 1062 candidates to check for visually discernible motions, which would be significantly larger than that of Taurus (100 mas/yr). We have rejected 161 WISE candidates through these proper motion criteria.
The criteria described above rejected 976 of the 1062 WISE candidates as likely non-members. These objects and the criteria that they failed to satisfy are listed in Table 5. Although 2MASS J04051434+2008214 (HD 284154) passed all criteria, it is rejected as a Taurus member because it and a common proper motion companion ([WKS96] 4) are both fainter than expected for members of Taurus with their spectral types.
5.3 Spectroscopy of Candidate Members
We obtained optical and near-IR spectra of 10 and 41 WISE candidates, respectively. We also performed IR spectroscopy on candidate companions to BS Tau and 2MASS J04485789+2913548 that were noticed in their acquisition images. Because we began spectroscopy of candidates before applying all of the membership constraints from the previous section, seven of the targets have positions in the USNO/2MASS/WISE color-magnitude diagrams that are indicative of non-members. They consist of six galaxies and a young star (2MASS J04591661+2840468). The optical observations were performed with the Marcario Low-Resolution Spectrograph (LRS) on the Hobby-Eberly Telescope (HET) on the nights of 2012 December 5, 8, and 9. The instrument was operated with the G3 grism and the slit, which provided a wavelength coverage of 6200–9100 Å and a resolution of . The near-IR spectra were collected with SpeX (Rayner et al., 2003) at the NASA Infrared Telescope Facility (IRTF) on the nights of 2012 December 28, 2013 January 1 and 3, and 2013 August 26. The SpeX data were collected in the prism mode with a slit, providing a wavelength coverage of 0.8–2.5 µm and a resolution of for all targets except 2MASS J04221376+1525298, which was observed with the SXD mode (). The data were reduced with the Spextool package (Cushing et al., 2004) and corrected for telluric absorption (Vacca et al., 2003). The optical and near-IR spectra of the stars that we classify as new members are presented in Figures 6 and 7, respectively.
For our spectroscopic sample, we distinguished young stars from field dwarfs by gravity-sensitive features (K I, Na I, H2O) and the strength of H emission. Galaxies were identified by their redshifted emission lines. We measured spectral types and extinctions for the young objects by comparing strengths of the VO, TiO and H2O absorption bands to those of previously known members of Taurus and average spectra of standard dwarfs and giants classified at optical wavelengths (Luhman, 1999). Our resulting classifications are presented in Table 6. We classify 24 candidates and the companions to BS Tau and 2MASS J04485789+2913548 as young stars, and hence likely members of Taurus. The remaining 27 sources that we classify as non-members are included in the full list of rejected candidates in Table 5. A few of the new members have some previous evidence of youth (e.g., BS Tau) but have lacked spectral classifications. The spatial distribution of these new members is shown in Figure 1. The 34 remaining viable candidates that have not been observed with spectroscopy are presented in Table 7.
We have additional comments on the classifications of some of the objects in our spectroscopic sample. BS Tau is a 1.3″ binary with spectral types M2.5 and M5.5. The primary appears to be the source of the WISE excess based on a comparison of astrometry in 2MASS and WISE and its strong H emission, which is a signature of accretion. 2MASS J04332789+1758436, 2MASS J04485789+2913548, and Haro 6-39 are very red and show H emission lines. They are not fit well by any standards and probably have both blue and red excesses. 2MASS J04591661+2840468 may be seen in scattered light since it is very faint for its color (e.g., edge-on disk). Our near-IR spectrum of 2MASS J04221376+1525298 is indicative of a early F star with a reddening that corresponds to A and significant -band continuum veiling. The latter combined with the WISE excess emission suggest that it has a disk, and hence is a young star. However, it is fainter than expected for an F-type member of Taurus, indicating that it is seen in scattered light or is a background young star. We classify it as the latter for the purposes of this study. We note that this star also shows strong absorption in He I at 1.083 m ( Å), which is unusual for an F star and may be due to a wind (Edwards et al., 2003). Among the seven M dwarfs that we classify as non-members, five have only marginal excesses in a single band and thus probably do not have real excesses. The remaining two M dwarfs, 2MASS J04152336+3006258 and 2MASS J04503102+1514127, seem to have significant excesses and are much fainter than typical members at their spectral types. Since these two stars do not show any evidence of being edge-on disks, they are probably field M dwarfs that have debris disks or that are unresolved from background red galaxies.
5.4 Other New Members
While searching for new disk-bearing members based on red WISE colors, we found that four excess candidates already had sufficient evidence of membership from previous work for inclusion in our initial sample of members (Section 2.1). These stars consist of V1195 Tau, HD 31305, RXJ 0432.7+1809, and HD 286178. V1195 Tau is a 1″ binary (Köhler & Leinert, 1998) that is somewhat isolated from known members. Its proper motion (Röser et al., 2008) and radial velocity (Wichmann et al., 2000) are consistent with membership (Luhman et al., 2009). Since Wichmann et al. (2000) did not detect Li, V1195 Tau has generally been considered a background star. However, it was detected by Martín & Magazzú (1999) and Nguyen et al. (2012). HD 31305 is close to known members, is an X-ray source (Wichmann et al., 1996), and has a proper motion (Zacharias et al., 2013) that agrees with the closest subgroup (Luhman et al., 2009). Its photometry is consistent with a A0 zero age main sequence (ZAMS) star at the distance of Taurus, which makes it the second most massive/hottest star in that group behind AB Aur. We estimate that its position on the Hertzsprung-Russell (H-R) diagram (log(Teff) 3.96, log(L/L⊙) 1.32) is consistent with being somewhat older (5-10 Myr) than AB Aur (1.5 Myr; Palla & Stahler, 2002), but similar in age to MWC 480 (7.4 Myr; Manoj et al., 2006). Cody et al. (2013) and Mooley et al. (2013)111We reject the other four stars identified by Mooley et al. (2013) as members of Taurus (See Appendix). identified HD 31305 as a probable member of Taurus based on variability and proper motion, respectively. RXJ 0432.7+1809 and HD 286178 were classified by Wichmann et al. (1996) as young stars because of their X-ray emission and Li absorption. In addition, Sestito et al. (2008) confirmed the Li detection for HD 286178. The proper motions of these stars are consistent with membership in Taurus (Röser et al. 2008; Zacharias et al. 2013). We identified HD 286178 as a candidate because the criteria in Figure 3 suggested it had an excess at . However, the more detailed analysis that we applied to the known members indicates that it probably does not have an excess.
5.5 Comparison to Rebull et al. 2011
We compare the results of our survey for new disk-bearing members of Taurus with the WISE-based search performed by Rebull et al. (2011). That study recovered 18 candidate members originally found by Rebull et al. (2010) and identified 94 additional candidates. Among those 112 candidates, 39 are rejected through the criteria in Section 5.2, 12 are beyond the limit of our survey (), 23 do not satisfy our criteria for excess emission, 26 are outside our search area, one is the member V1195 Tau (see Section 5.4), and 11 are included in our spectroscopic sample. In this last group, one is rejected (2MASS J04221376+1525298) and ten are confirmed as members by our spectra. Meanwhile, four of our new members are among the stars rejected by Rebull et al. (2011), which are 2MASS J04343128+1722201, 2MASS J04485789+2913548, 2MASS J04591661+2840468, and 2MASS J05080709+2427123. They also described HD 31305 as a likely field star, which we classify as a member (Section 5.4). Twenty-five of our candidates in Table 7 were examined by Rebull et al. (2011), who classified them as likely galaxies based on their spectral energy distributions. The remaining 9 candidates were not considered in Rebull et al. (2011). They also did not evaluate eight of our spectroscopically confirmed members. Finally, the list of known members from Rebull et al. (2011) includes two stars, St H 34 and IRAS 04262+2735, that we have omitted as non-members (Hartmann et al. 2005b; Luhman et al. 2009)222Luhman et al. (2009) spectroscopically classified IRAS 0462+2735 as an M giant. Its proper motion is also inconsistent with membership in Taurus..
5.6 Completeness of Census of Members with Disks
We now evaluate the completeness of the current census of Taurus for disk-bearing members. The WISE catalog is % complete at and for uncrowded areas with the depth of coverage found in Taurus (Cutri et al., 2012b). Meanwhile, our criteria in Table 4 encompass nearly all known members of Taurus with mid-IR excesses. Therefore, our sample of candidates for new disks in Taurus should have a high level of completeness down to our adopted limit of . The magnitudes of the 34 candidates with uncertain membership status are indicated in Figure 4. There are no candidates with , indicating that the census of known Taurus members with IR excess should be largely complete in this magnitude range, with the exception of objects that are unresolved from brighter stars. Among the 26 known members of Taurus from M7 to M8, the faintest measurement is 13.05. Thus, our census of disk-bearing members should be complete to M8. The completeness is lower at fainter levels, but most of these candidates are probably galaxies based on their very red colors (Rebull et al., 2011), although a few may be protostars.
6 Conclusions
We have performed a survey of circumstellar disks in the Taurus star-forming region using WISE. Our results are summarized as follows:
-
1.
We have examined all images from the cryogenic phase of WISE for all known members of Taurus to check for false detections, blends with nearby objects, and extended emission. We have presented the resulting catalog of vetted photometry in the WISE bands at 3.4, 4.6, 12, and 22 m (–). All resolved, unblended members are detected by WISE in at least one band.
-
2.
By using colors constructed from and six Spitzer and WISE bands, we have identified Taurus members showing excess emission from circumstellar disks and have estimated the evolutionary stages of the detected disks, consisting of full, transitional, evolved, evolved transitional, and debris disks. Our classifications are generally consistent with those found by Luhman et al. (2010) and Furlan et al. (2011). We have found 31 new full disks and 16 new candidate disks in the more advanced evolutionary stages.
-
3.
Using photometry from WISE, Spitzer, 2MASS, and USNO, proper motions from UCAC4 and other catalogs, and our optical and near-IR spectroscopy, we have found 26 new members of Taurus with spectral types of M1 – M7. The census of disk-bearing stars in Taurus should now be largely complete for (M8; ).
Appendix A Comments on B/A stars from Mooley et. al (2013)
From among the five new proposed B/A-type Taurus candidates from Mooley et al. (2013), we retain only HD 31305 as a probable Taurus member (see 5.4) and reject the other four stars (HD 28929, Tau, 72 Tau, and HD 26212). Below, we describe our reasoning for excluding the latter stars from our membership sample.
HD 28929 is a B8V star (Kenyon et al., 1994) with a common proper motion companion, HD 28929B (2MASS J04343987+2857347, UCAC4 595-013167, TYC 1841-1391-1). The BVJHKs photometry for HD 28929B is similar to that of a F6V star (Ofek, 2008), and so if it has the same reddening as HD 28929A (E(B-V) 0.05), then it is likely a mid-F star. If the revised Hipparcos parallax for HD 28929A ( = 6.72 0.34 mas) is adopted, then the companion has MV 4.2, which is more consistent with a main sequence star rather than a pre-main sequence star. Zorec & Royer (2012) estimates an isochronal age of HD 28929 of 600 Myr. Using the estimated H-R diagram position for HD 28929 A of Teff = 12850 K and log(L/L⊙) 2.30, we estimate an age of 120 Myr using the Bertelli et al. (2009) evolutionary tracks. Although the tangential motion of HD 28929 differs from that of the nearest Taurus subgroups at a level of only 2-3 km/s, and it appears to be co-distant with Taurus, the HD 28929 system is isolated and has no other known Taurus members within a degree. Based on all of these considerations, and the lack of indicators of extreme youth for either component, we conclude that the HD 28929 system is likely to be a 120 Myr-old interloper.
Tau (HD 29763) is a B3V triple system (Lesh, 1968). We disagree with the assessment of Mooley et al. (2013) that the star appears to be a kinematic match to the Tau V subgroup, which is in its vicinity. Combining the systemic velocity from Petrie & Ebbighausen (1961) (12.3 km/s) with the revised Hipparcos astrometry, we estimate its space motion to be (U, V, W) -10, -8, -12 km/s, which is not near that of the Taurus subgroups (see Table 8 of Luhman et al., 2009). The star’s tangential motion differs by 4-6 km/s from the mean motion of the nearest Tau subgroups (IV and V), with its proper motion in right ascension going the wrong direction, and the systemic radial velocity differs by 4 km/s from that of Taurus. Tau A is not near the ZAMS (log(Teff) 4.20 0.01 dex, log(L/Lbol) 2.9 0.1 dex); indeed, we estimate an isochronal age of 60 Myr using the Bertelli et al. (2009) tracks. Tau B is a A1V star (Tolbert, 1964), for which we estimate 1.6. As a 2.1 M⊙ main sequence star, it would take a star of Tau B’s mass 8 Myr to contract to reach the main sequence, which sets a strong lower limit on the age of the Tau system, and rules out the possibility that Tau A might be in the pre-main sequence phase. We conclude that the Tau system is a 60 Myr-old interloper.
72 Tau (HD 28149) is a B7V star (Lesh, 1968) near the Tau V subgroup. Its tangential motion differs by 6 km/s from that of the Tau V group (Luhman et al., 2009). The radial velocity for 72 Tau (7.3 2.6 km/s) is significantly different from that of Tau V (15.7 km/s). Its space velocity (U, V, W = -5.9, -5.3, -7.4 km/s; Anderson & Francis, 2012) differs from that of the Tau V subgroup by 11 km/s (Luhman et al., 2009). Zorec & Royer (2012) estimates an isochronal age of 179 87 Myr, although our estimated H-R diagram position for 72 Tau (log(Teff) 4.16, log(L/L⊙) 2.32) places the star closer to the ZAMS (15 Myr?). Despite its youth, we find that 72 Tau is a poor kinematic match for Taurus membership, and consider it an interloper.
HD 26212 is a A5V star (Grenier et al., 1999; Mooley et al., 2013) at a distance of 100 7 pc (van Leeuwen, 2007), placing it 5 closer than the mean distance to Taurus (140 pc). HD 26212 is not in the vicinity of any of the Taurus subgroups (2 deg from Tau VIII), and its velocity (U, V, W = -18, -5, -12 km/s; Anderson & Francis, 2012) is not a good match to the Taurus subgroups (Luhman et al., 2009). We estimate that the star is lightly reddened (E(B-V) = 0.04 0.02) with an H-R diagram position of log(Teff) = 3.907 0.007 dex, log(L/L⊙) = 1.01 0.07 dex. Comparing this position to pre-main-sequence isochrones and members of Upper Sco in Figure 14 of Pecaut et al. (2012), it appears that HD 26212 is a ZAMS star and is below the Upper Sco (11 Myr) A-star sequence. Hence, it is almost certainly 10 Myr, and not a pre-main-sequence star. Given the discordance of its position, distance, velocity, and age compared to Taurus, and lack of secondary youth indicators (e.g., IR excess), we consider HD 26212 an interloper.
References
- Anderson & Francis (2012) Anderson, E. & Francis, Ch. 2012, AstL, 38, 331
- Beck (2007) Beck, T. L. 2007, AJ, 113, 1673
- Bertelli et al. (2009) Bertelli, G., Nasi, E., Girardi, L., et al. 2009, A&A, 508, 355
- Bricenño et al. (1998) Briceño, C., Harmann, L., Stauffer, J., et al. 1998, AJ, 115, 2074
- Carpenter et al. (2009) Carpenter, J. M., Mamajek, E. E., Hillenbrand, L. A., et al. 2009, ApJ, 705, 1646
- Calvet et al. (2004) Calvet, N., Muzerolle, J., Briceño, C., et al. 2004, AJ, 128, 1294
- Cody et al. (2013) Cody, A. M., Tayar, J., Hillenbrand, L. A., et al. 2013, AJ, 145, 79
- Cushing et al. (2004) Cushing, M. C., Vacca, W. D., & Rayner, J. T. 2004, PASP, 116, 362
- Cutri et al. (2012a) Cutri, R. M., Wright, E. L., Conrow, T., et al. 2012a, yCat, 2311, 0
- Cutri et al. (2012b) Cutri, R. M., Wright, E. L., Conrow, T., et al. 2012b, Explanatory Supplement to the WISE All-Sky Data Release Products
- Dahm & Hillenbrand (2007) Dahm, S. E. & Hillenbrand, L. A. 2007, AJ, 133, 2072
- DeWarf et al. (2003) DeWarf, L. E., Sepinsky, J. F., Guinan, E. F., et al. 2003, ApJ, 590, 357
- Dobashi et al. (2005) Dobashi, K., Uehara, H., Kandori, R., et al. 2005, PASJ, 57, 1
- Edwards et al. (2003) Edwards, S., Fischer, W., Kwan, J., Hillenbrand, L., et al. 2003, ApJ, 599, L41
- Espaillat et al. (2012) Espaillat, C., Ingleby, L., Hernández, J., et al. 2012, ApJ, 747, 103
- Fazio et al. (2004) Fazio, G. G., Hora, J. L., Allen, L. E., et al. 2004, ApJS, 154, 10
- Furlan et al. (2006) Furlan, E., Hartmann, L., Calvet, N., et al. 2006, ApJS, 165, 568
- Furlan et al. (2011) Furlan, E., Luhman, K. L., Espaillat, C., et al. 2011, ApJS, 195, 3
- Furlan et al. (2008) Furlan, E., McClure, M., Calvet, N., et al. 2008, ApJS, 176, 184
- Grenier et al. (1999) Grenier, S., Baylac, M., Rolland, L., et al. 1999, A&AS, 137, 451
- Guieu et al. (2007) Guieu, S., Pinte, C., Monin, J., et al. 2007, A&A, 465, 855
- Gutermuth et al. (2009) Gutermuth, R. A., Megeath, S. T., Myers, P. C., et al. 2009, ApJS, 184, 18
- Hartmann et al. (2005a) Hartmann, L., Megeath, S. T., Allen, L., et al. 2005, ApJ, 629, 881
- Hartmann et al. (2005b) Hartmann, L., Calvet, N., Watson, D. M., et al. 2005, ApJ, 628, 147
- Hernández et al. (2007) Hernández, J., Hartmann, L., Megeath, T., et al. 2007, ApJ, 662, 1067
- Howard et al. (2013) Howard, C. D., Sandell, G., Vacca, W. D., et al. 2013, ApJ, 776, 21
- Kenyon et al. (1994) Kenyon, S. J., Dobrzycka, D., & Hartmann, L. 1994, AJ, 108, 1872
- Kenyon & Hartmann (1995) Kenyon, S. J., & Hartmann, L. 1995, ApJS, 101, 117
- Kessler et al. (1996) Kessler, M. F., Steinz, J. A., Anderegg, M. E., et al. 1996, A&A, 315L, 27
- Köhler & Leinert (1998) Köhler, R., & Leinert, C. 1998, A&A, 331, 977
- Lada et al. (2006) Lada, C. J., Muench, A. A., Luhman, K. L., et al. 2006, AJ, 131, 1574
- Lasker et al. (2008) Lasker, B., Lattanzi, M. G., McLean, B. J., et al. 2008, AJ, 136, 735
- Lawrence et al. (2007) Lawrence, A., Warren, S. J., Almaini, O., et al. 2007, MNRAS, 379, 1599
- Lesh (1968) Lesh, J. R. 1968, ApJS, 17, 371
- Loinard et al. (2005) Loinard, L., Mioduszewski, A. J., Rodríguez, L. F., et al. 2005, ApJ, 619, L179
- Luhman (1999) Luhman, K. L. 1999, ApJ, 525, 466
- Luhman (2000) Luhman, K. L. 2000, ApJ, 544, 1044
- Luhman et al. (2008) Luhman, K. L., Allen, L. E., Allen, P. R., et al. 2008, ApJ, 675, 1375
- Luhman et al. (2010) Luhman, K. L., Allen, P. R., Espaillat, C., et al. 2010, ApJS, 186, 111
- Luhman & Mamajek (2012) Luhman, K. L. & Mamajek, E. E. 2012, ApJ, 758, 31
- Luhman et al. (2009) Luhman, K. L., Mamajek, E. E., Allen, P.R., et al. 2009, ApJ, 703, 399
- Luhman et al. (2006) Luhman, K. L., Whitney, B. A., Meade, M. R., et al. 2006, ApJ, 647, 1180
- Manoj et al. (2006) Manoj, P., Bhatt, H., Maheswar G., et al. 2006, ApJ, 651, 321
- Martín & Magazzú (1999) Martín, E. L. & Magazzú, A. 1999, A&A, 342, 173M
- Meyer et al. (1997) Meyer, M. R., Calvet, N., & Hillenbrand, L. A. 1997, AJ, 114, 288
- McClure (2009) McClure M. 2009, ApJ, 693L, 81
- Monet et al. (2003) Monet, D. G., Levine, S. E., Blaise, C., et al. 2003, AJ, 125, 984
- Mooley et al. (2013) Mooley, K. P., Hillenbrand, L. A., Rebull, L., et al. 2013, ApJ, 771, 110
- Neugebauer et al. (1984) Neugebauer, G., Habing, H. J., van Duinen, R., et al. 1984, ApJ, 278, L1
- Nguyen et al. (2012) Nguyen, D.C., Brandeker, A., Van Kerkwijk, M. H., et al. 2012, ApJ, 745, 119
- Ofek (2008) Ofek, E. 2008, PASP, 120, 1128
- Palla & Stahler (2002) Palla, F. & Stahler, S. 2002, ApJ, 581, 1194
- Pecaut et al. (2012) Pecaut, M., Mamajek, E., & Bubar, E. 2012, ApJ, 746, 154
- Petrie & Ebbighausen (1961) Petrie, R. M. & Ebbighausen, E. G. 1961, PASP, 73, 332
- Pilbratt et al. (2010) Pilbratt, G. L., Riedinger, J. R., Passvogel, T., et al. 2010, A&A, 518, L1
- Poglitsch et al. (2010) Poglitsch, A., Waelkens, C., Geis, N., et al. 2010, A&A, 518, L2
- Rayner et al. (2003) Rayner, J. T., Toomey, D. W., Onaka, P. M., et al. 2003, PASP, 115, 362
- Rebull et al. (2011) Rebull, L. M., Koenig, X. P., Padgett, D. L., et al. 2011, ApJS, 196, 4
- Rebull et al. (2010) Rebull, L. M., Padgett, D. L., McCabe, C. E., et al. 2010, ApJS, 186, 259
- Rieke et al. (2004) Rieke, G. H., Young, E. T., Engelbracht, C. W., et al. 2004, ApJS, 154, 25
- Roeser et al. (2010) Roeser, S., Demleitner, M., & Schilbach, E. 2010, AJ, 139, 2440
- Röser et al. (2008) Röeser, S., Schilbach, E., Schwan, H., et al. 2008, A&A, 488, 401
- Sestito et al. (2008) Sestito, P., Bragaglia, A., Randich, S., et al. 2008, A&A, 488, 943
- Sicilia-Aguilar et al. (2006) Sicilia-Aguilar, A., Hartmann, L., Calvet, N., et al. 2006, ApJ, 638, 897
- Skrutskie et al. (2006) Skrutskie, M., Cutri, R. M., Stiening, R., et al. 2006, AJ, 131, 1163
- Strom & Strom (1994) Strom, K. M., & Strom, S. E. 1994, ApJ, 424, 237
- Terada et al. (2007) Terada, H., Tokunaga, A.T., Kobayashi, N., et al. 2007, ApJ, 667, 303
- Tolbert (1964) Tolbert, C. R. 1964, ApJ, 139, 1105
- Torres et al. (2007) Torres, R. M., Loinard, L., Mioduszewski, A. J., et al. 2007, ApJ, 671, 1813
- Torres et al. (2009) Torres, R. M., Loinard, L., Mioduszewski, A. J., et al. 2009, ApJ, 698, 242
- Vacca et al. (2003) Vacca, W. D., Cushing, M. C., & Rayner J. T. 2003, PASP, 115, 389
- van Leeuwen (2007) van Leeuwen, F. 2007, A&A, 474, 653
- Werner et al. (2004) Werner, M. W., Roellig, T. L., Low, F. J., et al. 2004, ApJS, 154, 1
- White & Ghez (2001) White, R. J., & Ghez, A. M. 2001, ApJ, 556, 265
- Wichmann et al. (1998) Wichmann, R., Bastian, U., Krautter, J., et al. 1998, MNRAS, 301, L39
- Wichmann et al. (1996) Wichmann, R., Krautter, J., Schmitt, J. H. M. M. et al. 1996, A&A, 312, 439
- Wichmann et al. (2000) Wichmann, R., Torres, G., Melo, C. H. F., et al. 2000, A&A, 359, 181
- Wright et al. (2010) Wright, E. L., Eisenhardt, P. R. M., Mainzer, A. K., et al. 2010, AJ, 140, 1868
- York et al. (2000) York, D., Adelman, J., Anderson, J., et al. 2000, AJ, 120, 1579
- Zacharias et al. (2004) Zacharias, N., Monet, D. G., Levine, S. E., et al. 2004, BAAS, 36, 4815
- Zacharias et al. (2010) Zacharias N., Finch, C., Girard, T., et al. 2010, AJ, 139, 2184
- Zacharias et al. (2013) Zacharias, N., Finch, C., Girard, T., et al. 2013, AJ, 145, 44
- Zorec & Royer (2012) Zorec, J. & Royer, F. 2012, A&A, 537, 120
| Column Label | Description |
|---|---|
| 2MASS | Source name from the 2MASS Point Source Catalog |
| WISE | Source name from the WISE All-Sky Source CatalogaaSource names for HBC 360, HBC 361, and IRAM 04191+1522 are from the ALLWISE Source Catalog. |
| OtherNames | Other source names |
| SpType | Spectral type |
| Aj | J-band extinction |
| f_Aj | Method of extinction estimationbb and = derived from these 2MASS colors assuming photospheric near-infrared colors; CTTS = derived from and colors assuming intrinsic CTTS colors from Meyer et al. (1997); opt. spec. = derived from an optical spectrum; SpeX = derived from SpeX spectrum; (1) = Bricenño et al. (1998); (2) = Luhman (2000); (3) = Strom & Strom (1994); (4) = Beck (2007); (5) = White & Ghez (2001); (6) = DeWarf et al. (2003); (7) = Calvet et al. (2004). |
| 3.6mag | Spitzer [3.6] band magnitude |
| e_3.6mag | Error in [3.6] band magnitude |
| f_3.6mag | Flag on [3.6] band magnitudecc nodet = non-detection; sat = saturated; out = outside of the camera’s field of view; bl = photometry may be affected by blending with a nearby star; ext = photometry is known or suspected to be contaminated by extended emission (no data given when extended emission dominates); bin = includes an unresolved binary companion; unres = too close to a brighter star to be detected; false = detection from WISE catalog that appears false or unreliable based on visual inspection; err = magnitudes brighter than 6 mag are erroneous. |
| 4.5mag | Spitzer [4.5] band magnitude |
| e_4.5mag | Error in [4.5] band magnitude |
| f_4.5mag | Flag on [4.5] band magnitudecc nodet = non-detection; sat = saturated; out = outside of the camera’s field of view; bl = photometry may be affected by blending with a nearby star; ext = photometry is known or suspected to be contaminated by extended emission (no data given when extended emission dominates); bin = includes an unresolved binary companion; unres = too close to a brighter star to be detected; false = detection from WISE catalog that appears false or unreliable based on visual inspection; err = magnitudes brighter than 6 mag are erroneous. |
| 5.8mag | Spitzer [5.8] band magnitude |
| e_5.8mag | Error in [5.8] band magnitude |
| f_5.8mag | Flag on [5.8] band magnitudecc nodet = non-detection; sat = saturated; out = outside of the camera’s field of view; bl = photometry may be affected by blending with a nearby star; ext = photometry is known or suspected to be contaminated by extended emission (no data given when extended emission dominates); bin = includes an unresolved binary companion; unres = too close to a brighter star to be detected; false = detection from WISE catalog that appears false or unreliable based on visual inspection; err = magnitudes brighter than 6 mag are erroneous. |
| 8.0mag | Spitzer [8.0] band magnitude |
| e_8.0mag | Error in [8.0] band magnitude |
| f_8.0mag | Flag on [8.0] band magnitudecc nodet = non-detection; sat = saturated; out = outside of the camera’s field of view; bl = photometry may be affected by blending with a nearby star; ext = photometry is known or suspected to be contaminated by extended emission (no data given when extended emission dominates); bin = includes an unresolved binary companion; unres = too close to a brighter star to be detected; false = detection from WISE catalog that appears false or unreliable based on visual inspection; err = magnitudes brighter than 6 mag are erroneous. |
| 24mag | Spitzer [24] band magnitude |
| e_24mag | Error in [24] band magnitude |
| f_24mag | Flag on [24] band magnitudecc nodet = non-detection; sat = saturated; out = outside of the camera’s field of view; bl = photometry may be affected by blending with a nearby star; ext = photometry is known or suspected to be contaminated by extended emission (no data given when extended emission dominates); bin = includes an unresolved binary companion; unres = too close to a brighter star to be detected; false = detection from WISE catalog that appears false or unreliable based on visual inspection; err = magnitudes brighter than 6 mag are erroneous. |
| W1mag | WISE band magnitude |
| e_W1mag | Error in band magnitude |
| f_W1mag | Flag on band magnitudecc nodet = non-detection; sat = saturated; out = outside of the camera’s field of view; bl = photometry may be affected by blending with a nearby star; ext = photometry is known or suspected to be contaminated by extended emission (no data given when extended emission dominates); bin = includes an unresolved binary companion; unres = too close to a brighter star to be detected; false = detection from WISE catalog that appears false or unreliable based on visual inspection; err = magnitudes brighter than 6 mag are erroneous. |
| W2mag | WISE band magnitude |
| e_W2mag | Error in band magnitude |
| f_W2mag | Flag on band magnitudecc nodet = non-detection; sat = saturated; out = outside of the camera’s field of view; bl = photometry may be affected by blending with a nearby star; ext = photometry is known or suspected to be contaminated by extended emission (no data given when extended emission dominates); bin = includes an unresolved binary companion; unres = too close to a brighter star to be detected; false = detection from WISE catalog that appears false or unreliable based on visual inspection; err = magnitudes brighter than 6 mag are erroneous. |
| W3mag | WISE band magnitude |
| e_W3mag | Error in band magnitude |
| f_W3mag | Flag on band magnitudecc nodet = non-detection; sat = saturated; out = outside of the camera’s field of view; bl = photometry may be affected by blending with a nearby star; ext = photometry is known or suspected to be contaminated by extended emission (no data given when extended emission dominates); bin = includes an unresolved binary companion; unres = too close to a brighter star to be detected; false = detection from WISE catalog that appears false or unreliable based on visual inspection; err = magnitudes brighter than 6 mag are erroneous. |
| W4mag | WISE band magnitude |
| e_W4mag | Error in band magnitude |
| f_W4mag | Flag on band magnitudecc nodet = non-detection; sat = saturated; out = outside of the camera’s field of view; bl = photometry may be affected by blending with a nearby star; ext = photometry is known or suspected to be contaminated by extended emission (no data given when extended emission dominates); bin = includes an unresolved binary companion; unres = too close to a brighter star to be detected; false = detection from WISE catalog that appears false or unreliable based on visual inspection; err = magnitudes brighter than 6 mag are erroneous. |
| Exc4.5 | Excess present in [4.5]? |
| Exc8.0 | Excess present in [8.0]? |
| Exc24 | Excess present in [24]? |
| ExcW2 | Excess present in ? |
| ExcW3 | Excess present in ? |
| ExcW4 | Excess present in ? |
| DiskType | Disk type |
Note. — The table is available in a machine-readable format.
| 2MASSaa2MASS Point Source Catalog. | Name | [3.6] | [4.5] | [5.8] | [8.0] | Date |
|---|---|---|---|---|---|---|
| J04034930+2610520 | HBC 358 A+B+C | 9.150.02 | out | 8.990.03 | out | 2009 Mar 20 |
| J04034997+2620382 | XEST 06-006 | 11.990.02 | 11.890.02 | 11.810.03 | 11.760.04 | 2009 Mar 20 |
| J04035084+2610531 | HBC 359 | 9.290.02 | out | 9.200.03 | out | 2009 Mar 20 |
| J04105425+2501266 | 11.900.02 | 11.320.02 | 10.920.03 | 10.380.03 | 2005 Feb 20 | |
| J04144158+2809583 | 14.590.03 | 14.260.03 | 14.040.08 | 14.300.16 | 2005 Feb 19 | |
| 14.560.03 | 14.390.03 | 13.960.09 | 13.760.13 | 2007 Mar 29 | ||
| J04153452+2913469 | 12.270.02 | 10.950.02 | 9.990.03 | 9.010.03 | 2007 Mar 29 | |
| J04153566+2847417 | 13.140.02 | 12.210.02 | 11.310.03 | 10.360.03 | 2007 Mar 29 | |
| J04154131+2915078 | 11.240.02 | 11.100.02 | 11.050.03 | 10.960.03 | 2007 Mar 29 | |
| J04154269+2909558 | 10.840.10 | 10.760.10 | 10.670.10 | 10.540.10 | 2007 Mar 29 | |
| J04154807+2911331 | 13.470.02 | 13.340.03 | 13.150.05 | 13.280.10 | 2007 Mar 29 | |
| J04161726+2817128 | 9.420.02 | 9.300.02 | 9.220.03 | 9.280.03 | 2005 Feb 19 | |
| 9.410.02 | 9.330.02 | 9.270.03 | 9.260.03 | 2007 Mar 29 | ||
| SST Tau 041831.2+282617 | 14.100.03 | 13.350.02 | 12.820.04 | 11.980.04 | 2005 Feb 19 | |
| 14.010.02 | 13.180.02 | 12.620.04 | 11.800.04 | 2005 Feb 21 | ||
| 14.070.03 | out | 12.620.05 | out | 2007 Mar 29 | ||
| J04213965+2649143 | 11.090.02 | 10.950.02 | 10.960.03 | 10.850.03 | 2007 Oct 17 | |
| J04215482+2642372 | 10.850.02 | 10.690.02 | 10.660.03 | 10.680.03 | 2007 Oct 17 | |
| J04242321+2650084 | 9.420.02 | 9.350.02 | 9.270.03 | 9.200.03 | 2005 Feb 21 | |
| J04245021+2641006 | 10.910.02 | 10.770.02 | 10.730.03 | 10.750.03 | 2004 Sep 7 | |
| 10.900.02 | 10.780.02 | 10.660.03 | 10.730.03 | 2005 Feb 21 | ||
| J04251550+2829275 | 9.910.02 | 9.760.02 | 9.690.03 | 9.720.03 | 2005 Feb 22 | |
| J04264449+2756433 | 11.190.02 | 11.190.02 | 11.010.03 | 11.010.03 | 2005 Feb 22 | |
| J04272467+2624199 | 9.920.02 | 9.850.02 | 9.850.03 | 9.820.03 | 2005 Feb 22 | |
| J04285053+1844361 | out | 9.420.02 | out | 8.380.03 | 2004 Mar 8 | |
| 9.700.02 | 9.410.02 | out | out | 2011 Nov 29 | ||
| J04314644+2506236 | 10.700.02 | 10.720.02 | 10.550.03 | 10.580.03 | 2005 Feb 24 | |
| J04324107+1809239 | RXJ 0432.7+1809 | out | 9.550.02 | out | 8.820.03 | 2005 Feb 19 |
| J04325323+1735337 | RXJ 0432.8+1735 | 8.910.02 | 8.890.02 | 8.790.03 | 8.750.03 | 2004 Sep 7 |
| J04332789+1758436 | out | 9.310.02 | out | 7.770.03 | 2005 Feb 19 | |
| out | 9.060.02 | out | out | 2011 Nov 10 | ||
| J04333278+1800436 | out | 8.900.02 | out | out | 2011 Nov 10 | |
| J04334871+1810099 | DM Tau | 9.380.02 | 9.170.02 | out | out | 2011 Nov 10 |
| J04340619+2418508 | out | 12.360.02 | out | 12.290.04 | 2004 Mar 12 | |
| 12.480.02 | 12.390.02 | 12.510.04 | 12.340.04 | 2005 Feb 24 | ||
| J04345973+2807017 | 14.340.03 | 13.950.03 | 13.710.06 | 13.150.07 | 2005 Feb 20 | |
| 14.210.03 | 13.910.03 | 13.790.07 | 13.040.07 | 2007 Oct 16 | ||
| J04355760+2253574 | 12.860.02 | 12.460.02 | 12.190.03 | 12.150.04 | 2005 Feb 20 | |
| 12.860.02 | out | 12.340.04 | out | 2005 Feb 21 | ||
| 13.270.02 | 12.840.02 | 12.520.04 | 12.300.05 | 2007 Apr 3 | ||
| J04355881+2438404 | 9.570.02 | out | 9.500.03 | out | 2004 Mar 11 | |
| 9.550.02 | 9.480.02 | 9.450.03 | 9.490.03 | 2005 Feb 21 | ||
| J04355949+2238291 | 12.340.03 | 11.640.03 | 10.830.03 | 9.600.03 | 2007 Apr 3 | |
| J04363248+2421395 | 10.080.02 | 9.990.02 | 9.970.03 | 9.900.03 | 2005 Feb 21 | |
| J04380191+2519266 | 11.790.02 | 11.720.02 | 11.560.03 | 10.990.03 | 2005 Feb 21 | |
| J04383907+1546137 | HD 285957 | 8.190.02 | 8.230.02 | 8.200.03 | 8.200.03 | 2004 Sep 7 |
| J04504003+1619460 | out | 9.300.02 | out | out | 2011 Apr 19 | |
| J04554822+3020165 | HD 31305 | 6.510.02 | 6.380.02 | 6.100.03 | 5.180.03 | 2004 Feb 14 |
| out | 6.440.02 | out | 5.210.03 | 2008 Nov 1 | ||
| J04571766+1525094 | HD 286178 | 7.690.02 | 7.730.02 | 7.650.03 | 7.660.03 | 2004 Sep 7 |
Note. — Entries of “” and “out” indicate measurements that are absent because of non-detection and a position outside the field of view of the camera, respectively.
| 2MASSaa2MASS Point Source Catalog. | Name | [24] | Date |
|---|---|---|---|
| J04034997+2620382 | XEST 06-006 | ||
| J04035084+2610531 | HBC 359 | 8.980.11 | 2009 Mar 25 |
| J04105425+2501266 | 6.030.04 | 2004 Sep 23 | |
| J04144158+2809583 | |||
| J04153452+2913469 | 3.520.04 | 2007 Feb 23 | |
| J04153566+2847417 | 5.620.04 | 2007 Feb 23 | |
| J04154131+2915078 | |||
| J04154269+2909558 | |||
| J04154807+2911331 | |||
| J04161726+2817128 | 9.160.10 | 2004 Sep 23 | |
| 9.290.15 | 2007 Feb 23 | ||
| J04162725+2053091 | |||
| J04163048+3037053 | |||
| SST Tau 041831.2+282617 | 6.750.04 | 2004 Sep 23 | |
| 6.690.04 | 2005 Feb 28 | ||
| 6.560.04 | 2007 Feb 23 | ||
| J04185813+2812234 | IRAS 04158+2805 | 2.870.04 | 2008 Mar 13 |
| J04213965+2649143 | |||
| J04215482+2642372 | |||
| J04215851+1520145 | |||
| J04242321+2650084 | 7.820.06 | 2005 Feb 27 | |
| J04245021+2641006 | |||
| J04251550+2829275 | |||
| J04264449+2756433 | |||
| J04270739+2215037 | |||
| J04272467+2624199 | |||
| J04314644+2506236 | |||
| J04324107+1809239 | RXJ 0432.7+1809 | 6.390.04 | 2004 Feb 20 |
| 6.510.04 | 2006 Feb 19 | ||
| J04325323+1735337 | RXJ 0432.8+1735 | 6.510.04 | 2004 Sep 25 |
| J04340619+2418508 | |||
| J04345973+2807017 | |||
| J04355760+2253574 | 7.030.05 | 2005 Mar 1 | |
| 7.250.06 | 2007 Feb 26 | ||
| J04355881+2438404 | 9.380.24 | 2005 Mar 1 | |
| J04355949+2238291 | 5.380.05 | 2005 Mar 1 | |
| 5.200.04 | 2007 Feb 26 | ||
| J04363248+2421395 | |||
| J04380191+2519266 | 8.590.09 | 2005 Mar 4 | |
| J04383907+1546137 | HD 285957 | 7.790.06 | 2005 Mar 3 |
| J04554822+3020165 | HD 31305 | 3.340.04 | 2004 Sep 25 |
| 3.360.04 | 2004 Oct 12 | ||
| 3.330.04 | 2005 Mar 5 | ||
| J04571766+1525094 | HD 286178 | 7.400.05 | 2004 Oct 13 |
| J05064662+2104296 |
Note. — Entries of “” indicate measurements that are absent because of non-detection.
| (x,y) |
|---|
| vs. |
| (-0.1, 8.50) |
| (-0.1, 6.00) |
| vs. |
| (-0.1, 1.10) |
| (-0.1, -0.50) |
| (-0.1, 1.85) |
| (0.56, -0.5) |
| vs. |
| (-0.1, 0.40) |
| Satisfied membership criterion? | ||||||
|---|---|---|---|---|---|---|
| WISEaaCoordinate-based identifications from the WISE All-Sky Source Catalog. | 2MASSbbCoordinate-based identifications from the 2MASS Point Source Catalog when available. | USNO & | IRAC | Visual | SpectraddProbably non-members based on the listed spectroscopic classification | |
| 2MASS | InspectionccProbable non-members based on: false = spurious WISE detection in all bands or bands that seem to show excesses; mismatch = different sources dominate in / and /; galaxy = resolved galaxy; extended = extended in 2MASS, DSS or SDSS images, indicating that it may be a galaxy; blend = unreliable photometry because of blending with other sources. | |||||
| J040000.62+223340.9 | J04000062+2233409 | N | extended | |||
| J040002.50+223245.6 | N | extended | ||||
| J040013.58+305903.4 | J04001359+3059035 | Y | M5 | |||
| J040019.05+304121.3 | J04001906+3041213 | N | galaxy | |||
| J040022.18+303221.1 | J04002219+3032212 | Y | N | M2 | ||
Note. — Table 5 is available in a machine-readable format, a portion is shown here for guidance regarding its form and content.
| 2MASSaaCoordinate-based identifications from the 2MASS Point Source Catalog. | Spectral | (H) | Instrument |
|---|---|---|---|
| Type | (Å) | ||
| New Members | |||
| J04064443+2540182 | M5.75 | LRS | |
| J04102834+2051507 | M5.5 | SpeX | |
| J04124068+2438157 | M4 | SpeX | |
| J04215851+1520145 | M4 | SpeX | |
| J04284199+1533535 | M5 | SpeX | |
| J04285053+1844361 | M7.25 | LRS | |
| J04332789+1758436 | M | SpeX | |
| J04343128+1722201bbUCAC4 proper motion measurements consistent with Taurus membership. | M4.25 | LRS | |
| J04360131+1726120bbUCAC4 proper motion measurements consistent with Taurus membership. | M3 | LRS | |
| J04374333+3056563 | M3.75 | LRS | |
| J04384502+1737433bbUCAC4 proper motion measurements consistent with Taurus membership. | M4.25 | LRS | |
| J04384725+1737260 | M5.5 | LRS | |
| J04440164+1621324ccThe PPMXL (Roeser et al., 2010) proper motions are inconsistent with Taurus, but based on six astrometric positions (UKIDSS, WISE, 2MASS, The Guide Star Gatalog, USNO-B1.0, APM-North; Lasker et al. 2008), we calculate a proper motion of = 14 4, -19 4 mas/yr, which is in good agreement with that of the neighboring L1551 cluster (Tau VI; Luhman et al., 2009). | M6 | SpeX | |
| J04480632+1551251 | M4.5 | SpeX | |
| J04481348+2924537 | M1.75 | LRS | |
| J04485745+2913521ddCompanion to 2MASS J04485789+2913548 | M6 | SpeX | |
| J04485789+2913548 | M | SpeX | |
| J04504003+1619460bbUCAC4 proper motion measurements consistent with Taurus membership. | M4.75 | LRS | |
| J04520970+3037454eeHaro 6-39 | M | SpeX | |
| J04585141+2831241ffBS Tau A+B | M2.5+M5.5 | SpeX | |
| J04591661+2840468 | SpeX | ||
| J05023483+2745499bbUCAC4 proper motion measurements consistent with Taurus membership. | M4.25 | LRS | |
| J05023985+2459337bbUCAC4 proper motion measurements consistent with Taurus membership. | M4.25 | LRS | |
| J05073903+2311068 | M4.5 | SpeX | |
| J05080709+2427123 | M4 | SpeX | |
| Non-members | |||
| J04001359+3059035ggThe spectrum indicates that it is young, but it is probably too far from the known Taurus population to be a member. | M5 | SpeX | |
| J04064531+1759436 | M4V | SpeX | |
| J04094207+2128000hhSpectra obtained for both components of a close pair. | M1+early | SpeX | |
| J04135394+1634015 | M3V | SpeX | |
| J04152336+3006258 | M3.5V | SpeX | |
| J04183835+2719596 | M0 | SpeX | |
| J04185139+2531380 | M3V | SpeX | |
| J04214429+1929454 | M0 | SpeX | |
| J04221376+1525298 | F2-F4 | SpeX | |
| J04222131+2037524 | M5III | SpeX | |
| J04332503+1526460 | galaxy | SpeX | |
| J04401083+1628586 | M0 | SpeX | |
| J04403220+2959143 | M5III | SpeX | |
| J04404770+2739469 | galaxy | SpeX | |
| J04420028+2042566 | M3V | SpeX | |
| J04422696+2941426 | galaxy | SpeX | |
| J04431538+2444558 | M6III | SpeX | |
| J04482211+3018479 | early | SpeX | |
| J04494524+2001529 | galaxy | SpeX | |
| J04503102+1514127 | M2.5V | SpeX | |
| J04531985+1915276 | galaxy | SpeX | |
| J05024059+1922373 | M5III | SpeX | |
| J05041551+2702196 | galaxy | SpeX | |
| J05043642+2716380 | galaxy | SpeX | |
| J05064796+1922501 | M5III | SpeX | |
| J05062981+2245367hhSpectra obtained for both components of a close pair. | late K/early M + M2.5V | SpeX | |
| J05071092+2602125 | galaxy | SpeX | |
| WISEaaCoordinate-based identifications from the WISE All-Sky Source Catalog. | ||||
|---|---|---|---|---|
| J040442.58+290211.8 | ||||
| J040802.82+292331.4 | ||||
| J041422.20+193626.8 | ||||
| J041858.20+193901.3 | ||||
| J041955.26+290613.4 | ||||
| J042230.61+192332.7 | ||||
| J042252.96+243618.5 | ||||
| J042408.29+172531.4 | ||||
| J042430.06+245254.2 | ||||
| J042734.86+190427.1 | ||||
| J042737.75+245928.4 | ||||
| J042849.81+232640.5 | ||||
| J043013.06+293615.5 | ||||
| J043058.15+180329.6bbClassified as a young stellar object by Gutermuth et al. (2009). | ||||
| J043152.94+282605.3 | ||||
| J043426.11+201559.9 | ||||
| J043755.35+163611.4 | ||||
| J044023.91+292218.5 | ||||
| J044118.52+293616.2 | ||||
| J044337.55+210508.7 | ||||
| J044508.99+250831.1 | ||||
| J045018.05+203636.8 | ||||
| J045037.11+201059.3 | ||||
| J045123.89+261627.3 | ||||
| J045301.44+255349.5 | ||||
| J045333.41+200249.3 | ||||
| J045429.42+280135.7 | ||||
| J045910.18+262621.5 | ||||
| J045945.80+263434.7 | ||||
| J050158.72+150819.5 | ||||
| J050317.83+295910.3 | ||||
| J050343.07+263004.0 | ||||
| J050619.25+292717.5 | ||||
| J050902.08+302841.3 |
| (x,y) |
|---|
| vs. |
| vs. |
| vs. |
| vs. |
| vs. |
| vs. |