Time-lapsed graphene moiré superlattice on Cu(111)
Abstract
The detailed study of the graphene (gr) moiré superlattices emerging due to the mismatch between the substrate’s and gr-overlayer crystal lattices is inevitable because of its high technological relevance. However, little is known about the dynamics of moiré superstructures on gr.
Here, we report the first classical molecular dynamics simulation (CMD) of the moiré superlattice of graphene on Cu(111) using a new parameterized Abell-Tersoff-potential for the graphene/Cu(111) interface fitted in this paper to nonlocal van der Waals density functional theory (DFT) calculations. The interfacial force field with time-lapsed CMD provides superlattices in good quantitative agreement with the available experimental results. The long range coincidence supercells
of and with nonequivalent moiré hills have also been identified and analyzed.
The moiré superlattice exhibits a pattern which is dynamical
rather than statically pinned to the support and can be observed
mostly via time lapsing. The
instantaneous snapshots of the periodic moiré pattern
already at low temperature are weakly disordered lacking the apparent sharpness of the time averaged pattern and scanning tunneling
microscopy images.
This suggests the existence of competing orders between a static (1st order) and
a dynamical (2nd order) moiré superstructures.
The revealed random height fluctuations may limit
the important electronic properties of supported graphene such as
the mobility of charge carriers.
I Introduction
Graphene is a subject of intensive and booming research efforts either in its suspended and supported forms Novoselov ; Neto ; Meyer ; Tapaszto . Understanding the properties of the interface between graphene and a metal support has gained considerable attention due to the fact that graphene/metal contacts could be required by future nanoscale electronics Crommie .
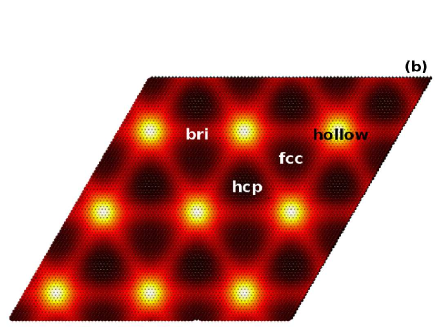
Graphene (gr) when placed on a substrate becomes periodically patterned induced by the lattice misfit between the substrate lattice and the overlayer Batzill ; rev . The emerging long-range periodic moiré nano-superlattice will be influenced mostly by the local binding environment. The small group of Carbon atoms will rise with respect to the substrate when locked-in in a hollow position (the first neighbor substrate atom is in the middle of a Carbon hexagon, hollow humps or protrusions) and other group of atoms will get closer to the substrate which bind to ontop positions (support atoms are nearly covered by Carbon atoms, ontop bumps or bulged-in regions). The alternating arrays of such regions build up the moiré superlattice with different periodicity and height variation on different supports DFT:Ru-Stradi ; Stradi13 ; DFT:Ru-Hutter . Depending on the strength of the gr-support interaction, the height measured from the deepest point of the bump region to the peak of the hump (bump-to-hump corrugation) can be substantial reaching 0.1 nm Batzill ; rev . Four moiré hills (called moirons grru13 ) form a minimal rhombic supercell centered at the corner points of the rhombus. When these moirons are equivalent, the system can be described by a relatively simple supercell which includes one moiron DFT:Ru-Hutter ; grru13 .
However, it turned out, that a larger coincidence superstructure is the ”real” supercell of the gr/Ru(0001) system in which the four humps are translationally and structurally inequivalent grru13 ; SXRD:25X25 ; rotRu ; Parga . The situation is even more complicated because the periodicity of the moiré superlattice further depends on the rotation misalignment of the gr-sheet with respect to the support sheet Gao ; JACS-grcu ; grcu:LEEM ; rotPt ; rotRu ; rotIr2 .
The detailed study of various graphene (gr) superlattices, such as the moiré superstructures Batzill ; rev and the corresponding nanoscale topography requires sophisticated experimental and theoretical methods DFT:Ru-Stradi ; Stradi13 ; DFT:Ru-Hutter ; grru13 . The theoretical modelling of weak adherence of gr to the support is essential to analyse and verify the experimental results. However, ab initio density functional theory (DFT) calculations and geometry optimization can be carried out for systems with few thousand atoms grru13 . Above 1000 atoms in general, however, electronic structure calculations become difficult even on top-level supercomputers. Therefore, it is important to find more efficient approaches which can handle routinly large scale systems. Classical molecular dynamics (CMD) simulations offer a powerfull tool for the structural and energetic analysis of gr-systems Sule13 . The problematic part of such simulations is the interfacial interaction between the gr sheet and support. While few reliable empirical potentials are available for graphene-only simulations airebo ; lcbop , however, little attention has been paid to the adequate description of gr/support interfaces. The weak adherence, the site selected binding of gr on various supports and the periodic moiré topography requires sophisticated modelling which goes beyond the level of simple pairwise force fields Sule13 .
It has been shown recently that the development of a new angular dependent bond order interfacial force field provides the adequate description of the prototypical gr/Ru(0001) system Sule13 . Rotation misorientated moiré superlattices have also been studied recently and a new phase has been explored by STM and CMD simulations Sule14 . First principles calculations (such as DFT) have widely been used in the last few years to understand corrugation of nanoscale gr sheets on various substrates DFT:Ru-Hutter ; DFT:Ru-Stradi ; DFT:Ru_Wang ; DFT:Ru_corrug , modelling larger systems, above Carbon atoms remains, however challenging, especially if geometry optimization is included and/or large supercells are considered grru13 . The minimal supercell of the gr/Cu(111) system includes a few thousands of atoms which definitely exceeds the size limit of accurate DFT geometry optimizations and/or ab initio DFT molecular dynamics.
Here we show that using a new DFT adaptively parameterized interfacial Abell-Tersoff (AT) potential Abell ; tersoff one can quantitatively reproduce even the fine structure of the experimentally observed surface reconstructions of gr on Cu(111) (moiré superstructures). Moreover, the dynamic nature of the periodic moiré pattern has also been revealed which has not yet fully been realized until now.
II Methodology
II.1 Simulation rules
Classical molecular dynamics has been used as implemented in the LAMMPS code (Large-scale Atomic/Molecular Massively Parallel Simulator) lammps . The graphene layer has been placed nearly commensurately on the substrate since the lattice mismatch is small in gr/Cu(111). However, even this tiny misfit is sufficient to form an incommensurate overlayer by occupying partly registered positions (alternating hexagonal hollow and ontop sites) which leads to a moir superstructure.
Periodic triclinic (rhombic) simulations cells have been constructed between and gr-unit cells. The systems are carefully matched at the cell borders in order to give rise to perfect periodic systems. Arbitrary system sizes lead to non-perfect matching at the cell borders. Moreover, nonperiodic cells lead to unstable moiré patterns due to the undercoordinated atoms at the system border which cannot be handled by the present force field with CMD. Nonperiodic structures can be, however, optimized by simple minimizers which also provide moiré patterns. Further refinement of the periodic pattern can be obtained by time-lapsed CMD. The moiré pattern is extremely sensitive to weak effects during CMD such as e.g. the improperly treated border atoms and/or the arising tensile stress or strain at the simulation cell border.
Isobaric-isothermal (NPT ensemble) simulations (with Nose-Hoover thermostat and a prestostat) were carried out at 0-300 K. Vacuum regions were inserted above and below the slab of the gr-substrate system to ensure the periodic conditions not only in lateral directions (x,y) but also in the direction perpendicular to the gr sheet (z). The variable time step algorithm has been exploited. The codes OVITO ovito and Gnuplot have been utilized for displaying atomic and nanoscale structures Sule13 ; Sule_2011 .
The molecular dynamics simulations allow the optimal lateral positioning of the gr layer in order to reach nearly epitaxial displacement and the minimization of lattice misfit. The relaxation of the systems has been reached in 2 steps: first conjugate gradient geometry optimization (cg-min) in combination of simulation box relaxation (boxrel) of the rhomboid simulation cell has been carried out. Finally variable time step CMD simulations have been utilized in few tens of a thousand simulation steps to allow the further reorganization of the system under thermal and pressure controll (NPT, Nose-Hoover thermostat, prestostat). Therefore we use in general the combined cg-min/CMD simulations.
Time-lapsed CMD (TL-CMD) has been used at 0-300 K in order to average the morphology over longer timescale and also to account for the effect of temperature. We found that 10000 time steps are generally sufficient for a stable moiré pattern. The pattern remains stable for time averages of much longer simulations. Time-lapsing is important because the moiré pattern becomes much less sharp for short simulations (for less than 5000-10000 steps) or for single-time-points. This is because sharp moiré patterning seems to appear beyond a certain timeperiod being a dynamic phenomenon rather than a static one in gr/Cu(111). We estimate the frequency of the occurrence of a sharp moiré superlattice Hz with the periodic time of ps.
The AIREBO (Adaptive Intermolecular Reactive Empirical Bond Order) potential has been used for the graphene sheet airebo . The more recently developed long-range bond-order potential for carbon (LCBOP) has also been employed for comparative purpose lcbop , although not much difference have been found in the essential properties, therefore we do not show explicit results on that potential. For the Cu substrate, a recent embedded atomic method (EAM) EAM:Cu potential is employed.
For the C-Cu interaction we developed a new Abell-Tersoff-like angular-dependent potential Abell ; tersoff (see Supplementary Material for further details). In the AT potential file (lammps format) the C-C and Cu-Cu interactions are ignored (nulled out). The CCuC and CuCCu out-of-plane bond angles were considered only. The CuCC and CCuCu angles (with in-plane bonds) are ignored in the applied model. Considering these angles requires the specific optimization of angular parameters which leads to the polarization of angles that does not fit to the original the AT model.
II.2 Ab initio DFT calculations
First principles DFT calculations have also been carried out for calculating the adhesion energy per Carbon atoms vs. the C/Cu distance for a small ideal systems with a flat graphene layer. The obtained potential energy curves (PECs) can be compared with the similar curve of MD calculations. We also calculate the DFT potential energy curves of various binding registries of gr including the hollow and ontop configurations (atop-fcc and hcp) and also the bridge one.
For this purpose we used the SIESTA code SIESTA ; SIESTA2 which utilizes atomic centered numerical basis set. The SIESTA code and the implemented Van der Waals functional (denoted as DF2, LMKLL in the code SIESTA2 ) successfully employed in several cases for gr (see e.g recent refs. sies1 ; sies2 ). We have used Troullier Martin, norm conserving, relativistic pseudopotentials in fully separable Kleinman and Bylander form for both carbon and Cu. A double- polarization (DZP) basis set was used. In particular, 16 valence electrons are considered for Cu atoms and 4 for C atoms. Only point is used for the k-point grid in the SCF cycle. The real space grid used to calculate the Hartree, exchange and correlation contribution to the total energy and Hamiltonian was 300 Ry (Meshcutoff).
III Results and Discussion
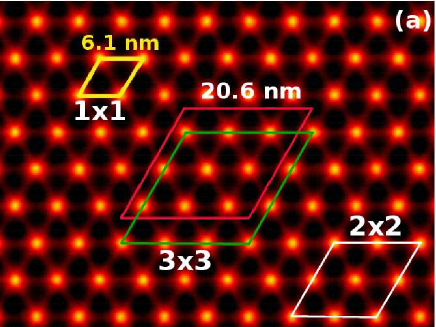
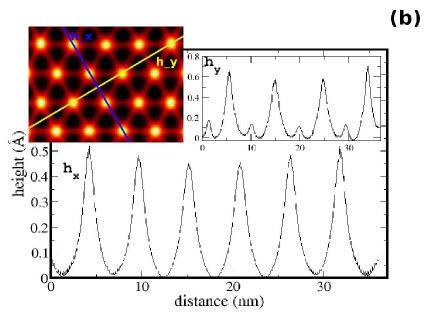
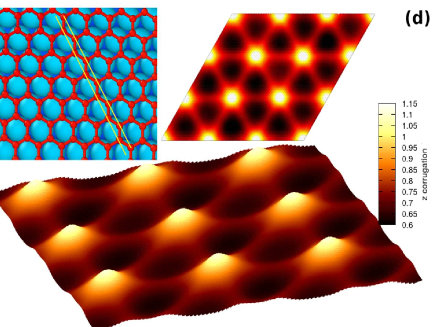
With the new parameter set obtained by the parameter fitting procedure outlined in the Supplementary Material we were able to simulate gr moiré superstructures on Cu(111). The obtained time-lapsed images are shown in Fig. 1. The new AT C-Cu interface potential describes adequately the weak van der Waals adherence in gr/Cu(111): the adhesion energy is around 0.14 eV/C which is comparable with the experimental 0.11 eV/C grcu_adhesion2 . The average interfacial distance is Å which is around the value obtained by a nonlocal vdW-DFT method (present work: 3.05). Concerning the moiré superlattice, the main features, such as the repeat distance of the minimal moiré cell and the corrugation are well reproduced (6.1 nm, and 0.055 nm, respectively vs. the experimental 6 nm and nm STM-grcu ). Moreover, we found the adequate binding registry: hollow-humps (moiré hills) and ontop-bumps (bulged-in regions). The same binding registry has been identified by DFT calculations in small gr/Cu(111) systems Xu_grcu . However, the registry of the moirons (moiré protrusions) has not been studied yet by DFT for larger gr/Cu(111) systems due to the too large size of the supercells (even the minimal cell is too large), however, it is likely, that the optimal position of the moirons is the hollow registry as in gr/Ru(0001). This is because, by a simple Lennard-Jones (LJ) pairwise potential for C-Cu interactions, one can get the incorrect configurations of hollow-bumps and ontop-humps similar to that found for gr/Ru(0001) with LJ potential Sule13 . It has been shown recently, that LJ provides improper binding sites for gr adherence and binds Carbon atoms more strongly to the hollow than to the ontop sites (hcp and fcc sites) Sule13 . However, the angular dependent AT C-Cu potential corrects this deficiency and gives a proper angular orientation at the gr/Cu(111) interface. On the basis of these findings mentioned above we believe that the new force field is suitable for describing properly vdw-adhesion and the moiré superlattice in gr/Cu(111).
III.1 The large corrugated coincidence superlattices
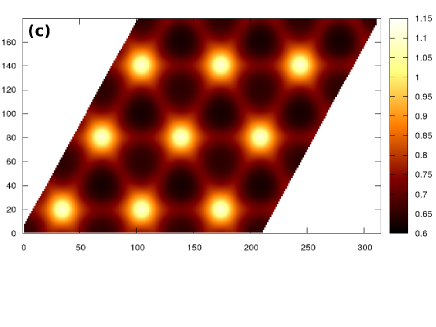
In Figs. 1(a)-(d) results of CMD simulations with periodic simulation cells are shown for aligned gr on Cu(111). It turned out after trial simulations that the superlattice shown in Fig. 1(a) (red and green rhombuses) and Fig. 1(c) the supercell is the minimal stable coincidence superstructure which is nearly commensurate with a misfit of 0.64 %. The various possible supercells of contain moirons (moiré hills) or minimal rhombuses as shown for the supercell in Fig. 1(a). In the and supercells the lattice mismatch is 1.72 % and 0.04 % respectively. In the much larger coincidence cell the misfit is still 0.24 %.
In the , and superstructures , and gr honeycombs sit on the substrate, respectively, nearly commensurately with the support’s lattice. The gr superstructures are commensurate with 27, 55 and 83 Cu(111) atoms, respectively. According to the lattice mismatch values the periodic cells provides the most stable minimal moiré superlattice. The supercell contains only a single moiron and 1682 Carbon atoms. (see Fig. 2(c)). The (Figs. 2(a)-(b)) and supercells include 6498 and 14450 Carbon atoms, respectively.
These findings are in line with the results obtained by Iannuzzi et al. recently for gr/Ru(0001) using vdW-DFT method with geometry optimization DFT:Ru-Hutter . In their work they have demonstrated that the unit cell of the moiré superstructure is the larger coincidence cell in which the moiré hills are inequivalent grru13 . We argue that in the case of gr/Cu(111) although the superlattice could also be sufficient, however, we find the larger supercell is more adequate for the description of the periodic moiré pattern.
In order to further support the superior stability one of the possible superlattices the time averaged cohesive energy of Carbon atoms has been calculated vs. (the number of unit cells in the reputation array ). The following values has been found by CMD simulations: -7.460, -7.464, -7.466, -7.460 and -7.461 eV/atom for N=1,2,3,4 and 5. The minimal supercell of is very close in energetic stability to much larger systems although in this case the moirons are forced to be equivalent. The relative energetics of supercells does not convincingly support the superior stability of any of the superlattices. Nevertheless we use the larger coincidence supercell of for further analysis which is capable of involving the key ingredients of superlattice dynamics.
III.2 Time lapsed moiré superlattice
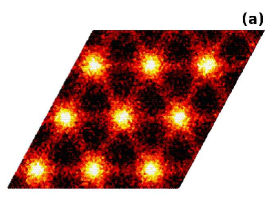
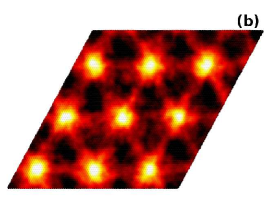
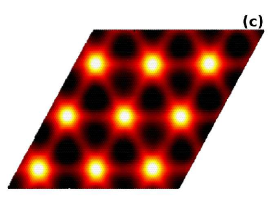
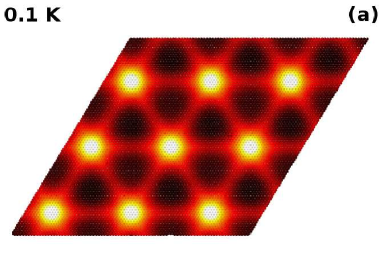
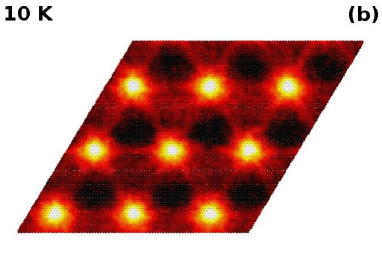
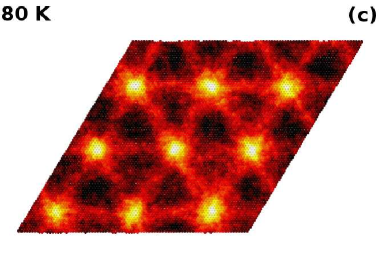
In Figs. 3 the effect of time lapsing on the moiré pattern is shown. In Figs. 3(a)-(c) the time averaged images are shown with various time span. A sharp pattern is obtained at or above 10k time steps. The pattern is never sharp on instantaneous snapshots such as shown in Figs 4(d). This implies that the experimentally seen images are also in fact time lapsed patterns. In particular, one can see the partial disruption of the pattern: e.g. the weak ”dissolution” of the moirons in their neighborhood. However, this process if time averaged on a ps time scale, a sharp moiré pattern appears. The underlying consequence of this mechanism could be that the gr sheet dynamically exhibits an unexpected anisotropy: the surface reconstruction leads to a disordered pattern and becomes ordered beyond a certain time interval only. The weak disordering of the moiré superlattice is a dynamical phenomenon and works on a ps time scale and leads to the break down of the hexagonal symmetry of the moiré superstructures.
Contrary to the stronger adhesion in gr/Ru(0001) dynamic moiré pattern has also been found (not shown here), although it has not fully been realized recently in ref. Sule13 that the time averaged pattern is the real moiré pattern. This is because in gr/Ru(0001 the instantaneous images are much closer to the time lapsed pattern due to the stronger adherence. In gr/Cu(111), the weaker van der Waals interaction at the interface results in in some sense free-standing behavior which favors disordering. However, contrary to the weak adhesion, moiré order is partly retained and the unset of disorder is still under controll. The weak adsorption energy of gr, however, permits the thermal out-of-plane fluctuation of the sheet.
The local variations of the moiré structure has been found recently by AFM and LEED in gr/Ir(111) dynamic_LEED . In particular, it has been found that the measured corrugation varies smoothly over several moiré unit cells dynamic_LEED . This could be due to the dynamic moiré structure mechanism outlined above. In our time averaged structures we also find the slight variation of the bump-to-hump corrugation with some 10 pm which is comparable with that found in ref. dynamic_LEED (12 pm). In these calculations a larger area (rhombic supercell: unit cell2 of the honeycomb lattice) is sampled. The spatial variation of corrugation occurs not only at certain time points but also time-to-time the height of a given moiron varies slightly. This is in line with the conclusion of ref. dynamic_LEED that there is a 2nd order moiré which is not expected to be rigid and likely to exhibit fluctuations. The 2nd order moiré is due to the weak oscillation of occupied positions by Carbon atoms around the idealistic 1st order moiré structure. The latter one is seen by time averaged CMD simulations and the former one in instantaneous snapshots such as shown in Fig. 3(c).
Therefore we argue that the coexistence of competing moiré orders forms the final observable pattern seen by STM. This is surprising since it has been widely accepted that moiré superstructures are nearly static objects due to the fact that the moiré image emerges from the superposition of the relatively rigid graphene lattice on the support’s lattice. While the assumption of lattice rigidity is more or less holds, however, the temperature induced out-of-plane vibrations and the relative lateral mobility and/or the rotation of the lattices are not necessarily negligible.
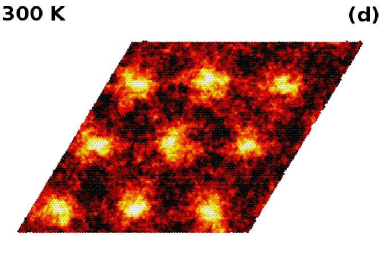
The temperature dependence of the dynamical distortion of the moiré pattern has been studied in detail and typical instantaneous simulated images are shown on Figs. 3(a)-(d) as obtained at 10 k time steps. Close to zero K the pattern remains still nearly sharp, however, with increasing temperature disorder sets in more and more strongly. The time averaged images show nearly perfect moiré order.
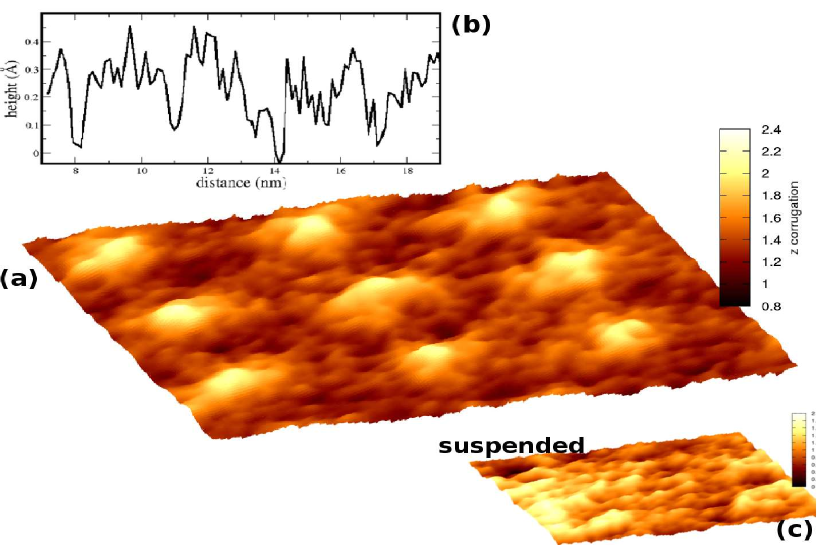
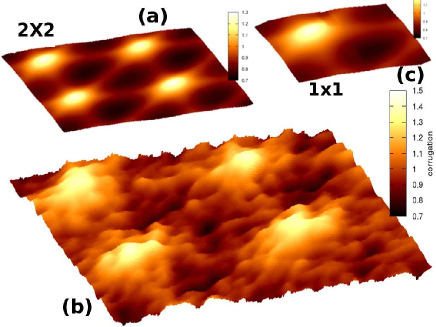
In Fig 5 a more refined instantaneous image is shown for 300 K as obtained at 10 k time steps. The image reveals that corrugation is unexpectedly different from the time lapsed images shown on Fig. 3(c) and Figs. 1(c)-(d). The amplitude of height variation can exceed locally the 0.15 nm which is time averaged to the much lower 0.05 nm. The topography at 300 K becomes then rather wrinkled which leads locally to bulged-in regions. The hexagonal shape of the time lapsed moiré protrusions becomes irregular. In Inset Fig. 5(b) the height profile along a thin section of the surface also reveals the irregular variation of the height profile which is in contrast with the time lapsed regular profile shown in Fig. 1(b).
These findings are somewhat surprising since the generally accepted regularity of supported gr is challenged now. The regularly rippeled surface of gr might be a time averaged phenomenon. Even ultraflat gr gr_ultraflat is in fact can be a dynamical system with a relatively high out-of-plane amplitudes. Therefore, gr within ultra-short time scales (ps and less) shows a much different topography than the available microscopy images. In particular, local height fluctuations partly destroy the first order moiré pattern seen on time lapsed images. The competition of height fluctuation and the moiré pattern might influence the various properties of gr such as the gap, band structure and transport properties. The interplay between lattice deformations and electron dynamics is an important ingredient to understand and control the electronic properties of graphene devices.
| method | (nm) | (Å) | (Å) | (Å) | (Å) | () | (eV/C) | ||
|---|---|---|---|---|---|---|---|---|---|
| freestanding | |||||||||
| susp-min | 2.6 | - | - | 2.462 | - | - | 0.0 | -7.408 | |
| susp-TL/CMD | 2.0 | - | - | 2.462 | - | - | -0.013 | -7.383 | |
| flat-min | 0.0 | - | - | 2.462 | - | - | 0.0 | -7.408 | |
| flat-TL/CMD | 0.0 | - | - | 2.459 | - | - | 0.0 | -7.370 | |
| supported | |||||||||
| MIN | 6.1 | 2.98 | 2.459 | 3.56 | -0.145 | 0.001 | -7.407 | ||
| CMD | 6.1 | 2.99 | 2.457 | 3.56 | -0.146 | -0.016 | -7.386 | ||
| EXP | 6.0a | n/a | n/a | 2.46 | 3.53 | -0.11b | n/a | n/a | |
| DFT | n/a | n/a | n/a | 3.25c, 3.05d | n/a | n/a | -0.062c, -0.198d | n/a | n/a |
[1] pw denotes present work, is the periodicity of the minimal moiré pattern (the edge length of the rhombus with 4 moiré humps, supercell), and are the average corrugation for gr and the topmost Cu(111) layer (Å). is the average inter-layer (C-Cu) distance (Å) at the interface. , are the lattice constant of gr (Å) and the lattice mismatch () after simulations (). CMD: pw, fitted Abell-Tersoff results with cg minimization with CMD at 300 K (gr/Cu(111)). graphene-only simulations: susp: periodic suspended (freestanding) graphene simulations which lead essentially to randomly rippled gr (300 K), flat: periodic 2d CMD simulations with a freestanding flat graphene (300 K), min: periodic cg-minimization only (geometry optimization together with box relaxation), EXP: the experimental results: corrugation (): our STM results, DFT results are also given for comparison DFT:Ru-Hutter ; Batzill ; DFT:Ru_Wang . All quantities are given per Carbon atom. The adhesion energy , where is the potential energy/C after md simulation. can be calculated using the final geometry of md simulation with heteronuclear interactions switched off. Therefore, contains only contributions from interfacial interactions. (eV/C) is the energy difference with respect to the perfectly flat periodic gr. , where and eV/C are the cohesive energy of C atoms in the corrugated and in the relaxed periodic flat (reference) gr sheet as obtained by the AIREBO C-potential airebo . a from refs. Gao ; STM-grcu , b from ref. grcu_adhesion2 ., double cantilever beam method: =0.72 J/m2. c from ref. RPA , obtained by accurate random phase approximation for a very small modell system. d present work: nonlocal vdw-DFT calculation for a small flat system (463 atoms): hcp: -0.198 eV/C ( Å), hollow: -0.182 eV/C ( Å), vdw-DFT geometry optimized structures: ontop hcp: -0.350 eV/C, hollow: -0.133 eV/C.
The amplification of structural fluctuations in suspended gr has been known for a while called intrinsic corrugation (ripples) Meyer ; Fasolino , however, little is known about similar features in supported gr. The topographic image of a typical rippled suspended gr system (gr-Cu(111) interaction is switched off) is shown in Fig. 5(c). The ripples are randomly distributed here as opposed to Fig. 5(a) in which ripples are still ordered embedded in the background ”noise” of the randomly arranged height fluctuations. The latter one are similar to that seen on Fig. 5(c).
The fluctuations of the corrugation, called flexural phonons, have been proposed to be the source of the intrinsic limit in the electronic mobility of graphene suspended samples flexph . It has also been found recently that intrinsic corrugation is partly damped in supported gr although not fully suppressed rippledgr_sio2 ; extrinsic . Therefore the observed random height fluctuation (can be seen in Fig. 5(b)) can be attributed to the persistence of intrinsic corrugation which competes with moiré ordering induced by the partial conformation of the gr sheet to the substrate.
Therefore contrary to the presence of the moiré order as a time averaged pattern the relatively high amplitude height variations could significantly influence the performance of electronic devices made from supported gr. However, higher adhesion leads to smaller intrinsic noise as can be seen in gr/Ru(0001) Sule13 .
It should also be noted that the observed height fluctuations are different from other reported buckling such as the one e.g. on the elastic response of gr nanodomes buckling . While the periodic buckling of the moiré humps is present and can be induced or amplified by the AFM tip in contact mode with decreasing tip-sample distance buckling , the random height fluctuation of the periodic moiré pattern presented in this work as already mentioned above is intrinsic. Unfortunately, these random intrinsic height fluctuations of gr are not visible by commonly used experimental methods because ultrafast nanoscale processes are well beyond the spatial and temporal resolution limits of current scanning probe characterization techniques. Time-resolved surface X-ray diffraction timeres_SXRD could offer a way in the near future to probe the ps-scale dynamics of the moiré superlattice.
III.3 Details of structural and energetic properties
In Table I. the various structural and energetic properties of the simulated rotated structures have been summarized. The notable features are the following:
In spite of the significant lattice misfit of the aligned moiré corrugated gr phase is slightly deeper in energy than the perfectly relaxed flat gr, the energy difference eV/C). This can be attributed to the efficient strain relief in the large coincidence supercells grru13 . The cohesive energy of the suspended (freestanding) rippled gr shown in Fig. 5(c) is -7.383 eV/C which is very similar to that of the periodically moiré patterned supported gr (-7.386 eV/C). Therefore, gr in its bound state is as stable as the rippled sheet which is intrinsically buckled as obtained by the CMD simulations of the present work. The eV/C is, however, below the magnitude of thermal motion at 300 K (0.026 eV).
IV Conclusions
A new C-Cu interfacial force field has been developed for the graphene/Cu(111) system with which we are able to describe adequately moiré superlattice formation. We find that a large coincidence unit cell (the unit cell of the superlattice) reproduces many important properties of the system such as corrugation, missorientations, moiré superlattice and adhesion energy. A stable and sharp moiré pattern becomes visible by time-lapsing over at least 10 k simulation steps. The instantaneous images shows up disordered pattern in various magnitude depending on the temperature. The competition between the intrinsic corrugation induced disordering and moiré ordering leads finally to regular moiré superlattice in time averaged images in a ps timescale. The competing moiré order is driven by inhomogeneous local out-of-plane fluctuations (disordered buckling instability).
The present study reveals then that supported gr is much more rippled than is widely accepted. The constant presence of the large amplitude (0.15 nm) height fluctuations might deteriorate the performance of supported gr as an electronic device. The electrons encounter and interact with the out-of-plane vibrations of the gr-sheet, and that can affect the material’s conductivity. Stronger adhesion could help, though the minimization of the amplitude of the height variations to the lowest possible level.
V Supplementary Material
Supplementary Material is available on parameter fitting and on the details of the force field.
VI acknowledgement
The calculations (simulations) have been done mostly on the supercomputers of the NIIF center (Hungary). The availability of codes LAMMPS (S. Plimpton) and OVITO (A. Stukowski) are also greatly acknowledged.
References
- (1)
- (2) K. Novoselov, A. Geim, S. Morozov, D. Jiang, M. Katsnelson, I. Grigorieva, S. Dubonos, and A. Firsov, Nature (London), 438, 197 (2005).
- (3) A. H. Castro Neto, F. Guinea, N. M. R. Peres, K. S. Novoselov, and Y. Pan, H. Zhang, D. Shi, J. Sun, S. Du, F. Liu, and H.-J. Gao, A. K. Geim, Rev. Mod. Phys. 81, 109 (2009).
- (4) J. C. Meyer, A. K. Geim, M. I. Katsnelson, K. S. Novoselov, T. J. Booth, S. Roth, Nature 446, 60-63 (2007).
- (5) L. Tapasztó, T. Dumitric, S. Jin Kim , P. Nemes-Incze, C. Hwang, and L. P. Biró, Nature Physics, 8, 739 (2012).
- (6) Y. Zhang, V. W. Brar, F. Wang, C. Girit, Y. Yayon, M. Panlasigui, A. Zettl, M. F. Crommie, Nature Physics 4, 627. (2008).
- (7) M. Batzill, The surface science of graphene: Metal interfaces, CVD synthesis, nanoribbons, chemical modifications, and defects, Surface Science Reports, 67, 83. (2012).
- (8) J. Wintterlin, M.-L. Bocquet, Graphene on metal surfaces, Surf. Sci. 603, 1841-1852 (2009).
- (9) D. Stradi, S. Barja, C. Dıaz, M. Garnica, B. Borca, J. J. Hinarejos, D. Sanchez-Portal, M. Alcami, A. Arnau, A. L. Vazquez de Parga, R. Miranda, and F. Martin, Phys. Rev. Lett. 106 186102 (2011).
- (10) D. Stradi, S. Barja, C. Díaz, M. Garnica, B. Borca, J. J. Hinarejos, D. Sánchez-Portal, M. Alcami, A. Arnau, A. L. Vázquez de Parga, R. Miranda, and F. Martín,2, Phys. Rev. B88, 245401 (2013).
- (11) M. Iannuzzi, J. Hutter, Surf. Sci., 605 1360 (2011).
- (12) M. Iannuzzi, I. Kalichava, H. Ma, S. J. Leake, H. Zhou, G. Li, Y. Zhang, O. Bunk, H. Gao, J. Hutter, P. R. Willmott, and T. Greber, Phys. Rev. B88 125433 (2013).
- (13) L. Gao, J. R. Guest, and N. P. Guisinger, Nano Lett. 10, 3512. (2010).
- (14) K. L. Man and M. S. Altman, Phys. Rev B84, 235415 (2011).
- (15) D. Martoccia, P. R. Willmott, T. Brugger, M. Bjorck, S. Gunther, C. M. Schleputz, A. Cervellino, S. A. Pauli, Phys. Rev. Lett. 101, 126102. (2008).
- (16) B. Borca , S. Barja, M. Garnica, M. Minniti, A. Politano, J. M Rodriguez-García, J. J. Hinarejos, D. Farias, A. L Vázquez de Parga, and Rodolfo Miranda, New Journal of Physics, 12 093018 (2010),
- (17) L. Zhao, K. T. Rim, H. Zhou,R. He, T. F. Heinz, A. Pinczuk, A., G. W. Flynn, A. N. Pasupathy, Solid State Commun. 151, 509. (2011), W. Kim, K. Yoo, E. K. Seo, S. J. Kim, C. Hwang, J. Korean Phys. Soc., 59, 71. (2011).
- (18) T. Niu, M. Zhou, J. Zhang, Y. Feng, and W. Chen*, J. Am. Chem. Soc., 135, 8409 (2013).
- (19) S. Nie, J. M. Wofford, N. C. Bartelt, O. D. Dubon, K. F. McCarthy, Phys. Rev. B84, 155425 (2011).
- (20) P. Merino, M. Svec, A. L. Pinardi, G. Otero, and J. A. Martın-Gago, Acs Nano, 5 5627. (2011).
- (21) E. Starodub, A. Bostwick, L. Moreschini, S. Nie, F. El Gabaly, K. F. McCarty, and E. Rotenberg, Phys. Rev. B83, 125428 (2011), A. T. N’Diaye, J. Coraux, T. N. Plasa, C. Busse, and T. Michely, New J. Phys. 10, 043033 (2008), J. Coraux, A. T. N’Diaye, C. Busse, and T. Michely, Nano Lett. 8, 565 (2008).
- (22) P. Süle, M. Szendrő, Surf. Interf. Anal., 46, 42 (2014).
- (23) P. Süle, M. Szendrő, C. Hwang, L. Tapasztó, Rotation misorientated graphene moiré superlattices on Cu(111): classical molecular dynamics simulations and scanning tunneling microscopy studies, eprint: arXiv:1401.1716
- (24) Z. Xu and Markus. J. Buehler, J. Phys.: Condens. Matter 22 485301. (2010).
- (25) J. Klimes, D. R. Bowler and A. Michaelides, J. Phys.: Condens. Matter, 22, 022201. (2009).
- (26) D. Jiang, M.-H., Du and S. Dai, J. Chem. Phys. 130 074705, (2009),
- (27) B. Wang, S. Günther, J. Wintterlin and M.-L. Bocquet, New J. Phys. 12, 043041 (2010).
- (28) S. J. Plimpton, Fast Parallel Algorithms for Short-Range Molecular Dynamics, J. Comp. Phys., 117, 1-19 (1995), see also the URL http://lammps.sandia.gov.
- (29) S.J. Stuart, A.B. Tutein, J.A. Harrison, J. Chem. Phys. 112, (2000) 6472.
- (30) J. H. Los and A. Fasolino, Phys. Rev. B68, 024107 (2003).
- (31) H.W. Sheng, M.J. Kramer, A. Cadien, T. Fujita and M.W., Phys. Rev. B83, 134118 (2011).
- (32) G. C. Abell, Phys. Rev. B31 6184, (1985).
- (33) J. Tersoff, Phys. Rev. Lett. 61, 2879. (1988), Phys. Rev. B39, 5566. (1989), D. W. Brenner, Phys. Rev. Lett. 63, 1022. (1989).
- (34) A. Stukowski, Modell. and Simul. in Mater. Sci. and Eng., 18, 015012 (2010).
- (35) P. Süle, J. Chem. Phys., 134, 244706 (2011).
- (36) E. Artacho, E. Anglada, O. Dieguez, J. D. Gale, A. García, J. Junquera, R. M. Martin, P. Ordejón, J. M. Pruneda, D. Sánchez-Portal and J. M. Soler, J. Phys.: Condens. Matter 20, 064208 (2008).
- (37) User’s Guide, SIESTA 3.1, trunk-367, www.icmab.es/siesta
- (38) M. Birowska, K. Milowska and J.A. Majewski, Acta Physica Polonica A, 120, 845 (2011).
- (39) M. A. Akhukov, A. Fasolino,1 Y. N. Gornostyrev, and M. I. Katsnelson, Phys. Rev. B85, 115407 (2012).
- (40) J.P. Perdew, K. Burke, M. Ernzerhof, Phys. Rev. Lett. 77 (1996) 3865.
- (41) M. Szendrő, P. Süle, code potfit: parameter fitting of the Tersoff potential using ab initio DFT data base (2013).
- (42) T. Yoon, W. C. Shin, T. Y. Kim, J. H. Mun, T.-S. Kim, B. J. Cho, Nano Lett. 12, 1448. (2012)
- (43) T. Olsen, and K. S. Thygesen, Phys. Rev. B87, 075111. (2013).
- (44) K. Hermann, J. Phys.: Condens. Matter 24, 314210 (2012).
- (45) S. Rusponi, M. Papagno, P. Moras, S. Vlaic, M. Etzkorn, P. M. Sheverdyaeva, D. Pacilé, H. Brune,1 and C. Carbone, Phys. Rev. Lett. 105, 246803. (2010).
- (46) S. K. Hämäläinen, M. P. Boneschanscher, P. H. Jacobse, I. Swart, K. Pussi, W. Moritz, J. Lahtinen, P. Liljeroth, J. Sainio, The Structure and Local Variations of the Graphene moiré on Ir(111), Phys. Rev. B88, 201406(R) (2013).
- (47) C. Hung Lui, L. Liu, K. Fai Mak, G. W. Flynn, T. F. Heinz, Nature, 462, 339. (2009), J. Xue , J. Sanchez-Yamagishi, D. Bulmash , P. Jacquod, A. Deshpande1, K. Watanabe, T. Taniguchi , P. Jarillo-Herrero and B. J. LeRoy, Nat. Mat., 10, 282 (2011).
- (48) E. V. Castro, H. Ochoa, M. I. Katsnelson, R. V. Gor- bachev, D. C. Elias, K. S. Novoselov, A. K. Geim, and F. Guinea, Phys. Rev. Lett. 105, 266601. (2010).
- (49) A. Fasolino, J. H. Los, M. I. Katsnelson, Intrinsic ripples in graphene, Nature Mat., 6, 858. (2007).
- (50) V. Geringer, M. Liebmann, T. Echtermeyer, S. Runte, M. Schmidt, R. Rückamp, M. C. Lemme, M. Morgenstern, Intrinsic and extrinsic corrugation of monolayer graphene deposited on SiO2. Phys. Rev. Lett. 102, 076102. (2009).
- (51) T. Li, Extrinsic morphology of graphene, Modelling Simul. Mater. Sci. Eng. 19, 054005 (2011).
- (52) S. Koch, D. Stradi, E. Gnecco, S. Barja, S. Kawai, C. Diaz, M. Alcami, F. Martin, A. L. Vázquez de Parga, R. Miranda, T. Glatzel, and E. Meyer, ACS Nano, 7, 2927. (2013).
- (53) J. Gustafson, M. Shipilin, C. Zhang, A. Stierle, U. Hejral, U. Ruett, O. Gutowski, P.-A. Carlsson, M. Skoglundh, E. Lundgren Science, 343, 758. (2014).
VII Supplementary Material
The details of parameter fitting for the gr/Cu(111) interface
The force field parameters were fitted against a data set including few small representatives of gr/Cu(111), binding energies and potential energy curves derived from DFT calculations. The trained force field was then used to study moiré superlattice and the corrugation of graphene. In this Supplementary Material the technical details of the parameter fitting procedure are shown. In particular, we discuss the least square fitting of the interfacial C-Cu Tersoff potential which is suitable for simulating the gr/Cu(111) weakly bound complex.
VII.1 The Abell-Tersoff potential
The Abell-Tersoff (AT) potential Abell ; Tersoff ; Brenner ; Liang is given in the following form:
| (1) |
The radial part of the AT potential is composed of the following repulsive and attractive functions,
| (2) |
| (3) |
The angular dependence is introduced via the attractive part term by the .
| (4) |
| (5) |
where the cutoff function is
Å is the cutoff distance and Å is the damping distance.
The angular term ,
| (6) |
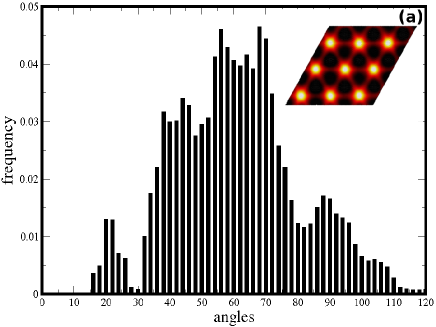
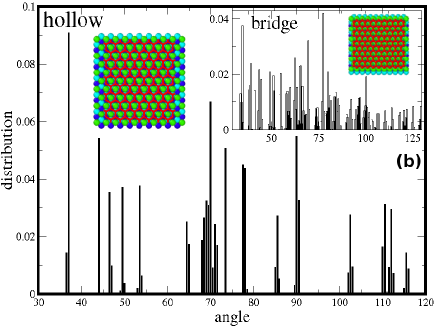
where . In a typical gr/Cu(111) system the interfacial bond angles (CCCu, CuCuC, CCuC, CuCCu) varies in a wide range of within cutoff distance of the interatomic distances. This is especially true if the cutoff distance is chosen to be relatively long-ranged. In our case Å, which is already long enough to account for van der Waals interactions. A typical angular distribution is shown in Fig. 6(a) as obtained for the corrugated moiré patterned superlattice. In Fig. 6(b) the angular histogram is shown for a purely hollow modell system used for parameter fitting and for DFT calculations. The occurrence of various angles is much less denser than in the superstructure. This is partly due to the flattnes of the hollow system, but mostly to the special angular orientation of the hollow registry. This orientation favors specific bond angles (more discretized spectrum). In particular, acute angles in the range of [ also appears here. This is important in that sense that our fitting code finds rather low due to the acute angles in the hollow bound region.
The main difficulty in the fitting of the Tersoff function is that it is almost impossible to fully account for the precise angular distribution within the mean field approach incorporated into the function in the bond order term in which each C-Cu heteronuclear bond angles are treated with the same parameters. Therefore to find a proper value for which physically also makes sense is challenging. We noticed that the exclusion of the in-plane bond angles (CCCu, CCuCu), in which the first two atoms of the atom triad in the angle are in the gr or topmost Cu(111) layer (angles with in-plane bonds), simplifies the problem. These angles do not influence significantly the orientation of the interface being much softer bond angles than the out-of-plane (”improper”) angles (C-Cu-C, Cu-C-Cu).
It turned out that these angles (out-of-plane angles) responsible for the proper orientation of the interface: the lack of the proper choice of results in the weakening of the angular dependence and leads to nanomesh-like topology instead of the required hump-and-bump like topography Sule13 . Typical nanomesh topography occurs in nature e.g. in h-BN/Rh(111) hbn .
The nanomesh moiré superstructure includes hollow-bumps (bulged-in regions) and ontop-humps (protrusions) and always provided by simple pair-potentials such as the Lennard-Jones interface potential Sule13 . Setting in proper angular dependence in the interface potential (e.g. the Tersoff bond order potential) the nanomesh topography turns into an inverted topology in which the nanomesh pores become hollow-humps and ontop-humps fall into bumps. The topographic features are organized as rhombic arrays of protrusions.
We also find that other angular dependent potentials such as the Stillinger-Weber sw or simple pairwise+harmonic hookean angular term-like potentials do not provide proper topography and always fall into nanomesh. This is because these force-fields are not bond order potentials (BOPs). Only BOPs in the form of Eq. (1) can handle adequately the bonding environment Tersoff via the angular-dependent bond order term. The proper choice of the form of sets in the proper 3-body interaction in the Abell-Tersoff potential Abell ; Tersoff ; Brenner ; Liang . The bond order for instance drops for weak interactions strongly influencing the angular orientation for such 3-body interactions. The in-plane bond angles (e.g. CCCu) in this respect also differ from the out-of-plane angles (e.g. C-Cu-C) since the latter ones do not include 1st order chemical bonds. Hence the short-ranged C-C or Cu-Cu bond order terms dominate for in-plane bond angles which makes these angles much less angular dependent. In the out-of-plane angles the long-ranged weak C-Cu bonds are much more sensitive to angular fluctuations hence these angles drive angular orientation of the gr/Cu(111) interface. In particular, we confirmed this behavior by fitting a Tersoff function with a polarized bond angle dependence and no significant dependence of the topography on the onset of in-plane angles has been found. In practice this means that the averaged contribution of the term is negligible for in-plane angles with respect to that of the out-of-plane ones. This is because the bond distance difference fluctuates more strongly for C-Cu-C angles than for C-C-Cu atomic triads at the interface.
After many trial fitting procedures and simulations we find that provides the best moiré pattern. This is a somewhat surprising value if we take a look at Fig. 6 in which the angular distribution is shown in a large flat and corrugated system. The optimal interfacial angle occurs in the wide range of . However, attempts were failed either with the apparent physical choice of () or with () which did not lead to perfect pattern. The selection of the less physical acute angle of gives the best pattern. The fitting procedure leads to this small angle without any constrain in the parameter space.
VII.2 The fitting procedure
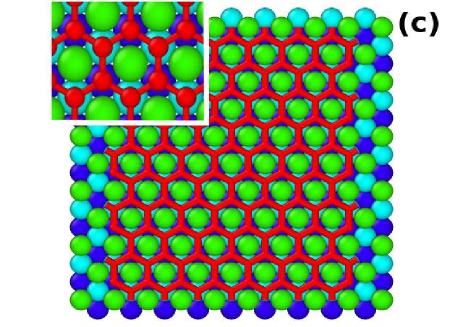
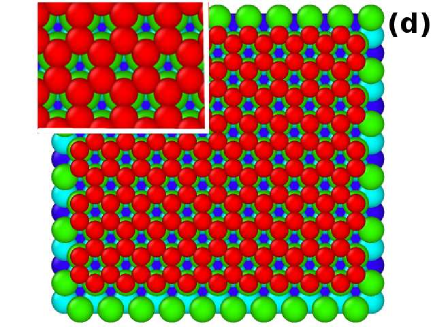
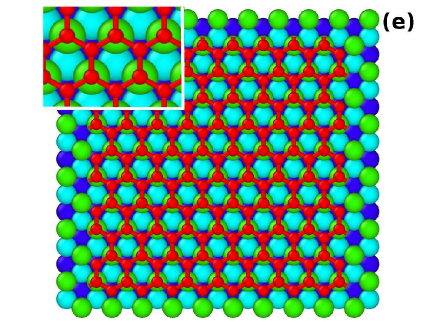
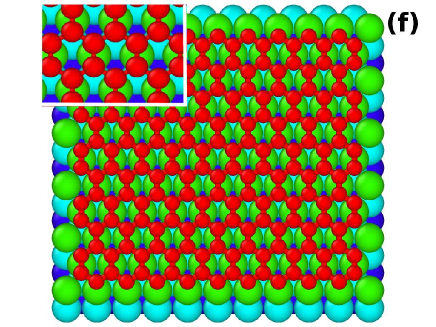
We used typical small representative gr/Cu(111) configurations (with flat gr) for binding registries of hollow, top-fcc, top-hcp and bridge alignments (see Figs. 8(c)-(f)). The potential energy curve (PEC) of the rigid gr-Cu(111) sheet-to-sheet separation has been calculated by nonlocal VdW-DFT LMKLL using the SIESTA code SIESTA . Then using a code developed by us potfit the interfacial Tersoff potential has been fitted to these DFT PECs. A Levenberg-Marquardt least-squares algorithm has been implemented in the code potfit potfit to find a combination of parameters which minimizes the deviation between the properties in the fitting database and the properties predicted by the Tersoff potential.
The employed properties are the followings: DFT sheet-to-sheet distance at the interface, DFT adhesion energy of the corresponding structure. Moreover DFT PECs are used for fitting. Using these essential 3 properties per configurations, we were able to obtain a DFT-adaptive force field for the interface. The fitting database can include various structures, although more than 2-4 modell structures not only slows down parameter fitting but also leads to a less DFT adaptive force field (FF). Our primary purpose was to develop a nearly perfectly macthed FF to suitably chosen PECs and the corresponding representative structures. After successful parameter fitting further conditions must be satisified by the new FF which can be tested only by test MD simulations.
The following conditions had to be satisfied by the new FF: (i) minimal rhomboid supercell edge size ( nm) for flat aligned gr (ii) proper topology of the gr-surface: hump-and-bump morphology with a corrugation of Å. Hollow-humps (moiré hills) and ontop-bumps (wells) are required as it has been found in other gr/substrate systems (e.g. gr/Ru(0001) Sule13 ). (iii) interface energy: adsorption or adhesion energy eV/atom (iv) correct interfacial distances: Å.
Among these requirements we imposed directly only conditions (iii) and (iv) under parameter fitting. However, the new parameter set also satisfied automatically conditions (i)-(ii). Conditions (iii)-(iv) seem to be sufficiently strict to restrict the parameter space in order to account for the morphology, structure and energetics of the moiré superstructures of gr/Cu(111). The obtained parameter set is shown in Table 2.
The fitting procedure has been carried out in a few steps.
Step (1): First an initial guess of radial parameters have been obtained
using the receipt given by Albe and Erhart SiC ; GaN .
Then using formulas in ref. Sule13 one can estimate the initial guess for ,
, and .
Step (2): Finally, the obtained parameter set
has been refined by an additional code written in our laboratory
potfit .
In this case we consider ab initio DFT potential energy curves and/or equilibrium
DFT geometries of small gr/Cu(111) modell systems.
Using this way of parameter fitting we were able to
get an adequate force field which describe gr/Cu(111) interfacial bonding properly.
The traditional way of fitting procedure (see e.g. refs. SiC ; GaN ) does not work in this special case when a weak interface potential is to be parameterized. In a standard situation one should fit the Tersoff function to the experimental lattice constants, cohesive energies and bulk moduli of various polymorphs of CuC. However, in this case the interface potential would bind graphene too strongly to Cu(111) (chemical adhesion). The bonding situation and the chemical environment is completely different in gr/Cu(111) and in CuC. Even if a weak chemical bonding takes place in gr/Cu(0001), it is far much weaker than in CuC. Using a CuC based fitted potential the adhesion energy of gr/Cu(111) would be eV/C, which is far higher than the measured and the DFT calculated eV/C grcu_adhesion . Hence one can not use the available experimental data set of CuC for parameterization.
Instead we directly fitted the free parameters in the Tersoff expression on a training set of small configurations of gr/Cu(111) in a similar way as it has been done for gr/Ru(0001) in ref. Sule13 . The only difference is that we do not employ here the code PONTIFIX pontifix , instead we estimate the initial guess of the parameters as described above in step (1). In step (2) we used our code for fitting the parameters on this realistic data base.
Additional requirements are the following (besides mentioned already above): the average corrugation is being below Å even at 300 K, moreover, the 0 K structure should be stable at 300 K with minor corrugation increase, minimal C-Cu distance Å, maximal C-Cu distance Å, no decorations occurs on the surface besides the regular hexagonally shaped humps (no further protrusions, vacancy islands, or holes).
| C-Cu (Tersoff) | |
|---|---|
| A (eV) | 977.795817888248 |
| B (eV) | 320.779495004024 |
| 3.13081741577273 | |
| 2.04559654256718 | |
| 0.08831675114170 | |
| c | 40.9755961701790 |
| d | 0.95287532769728 |
| h | 0.90505284108358 |
| (Å) | 4.197860487827 |
| (Å) | 0.479447718668 |
| () | 1.0 |
| 1.552786576027 | |
| n,m | 1 |
VII.3 The fitting database
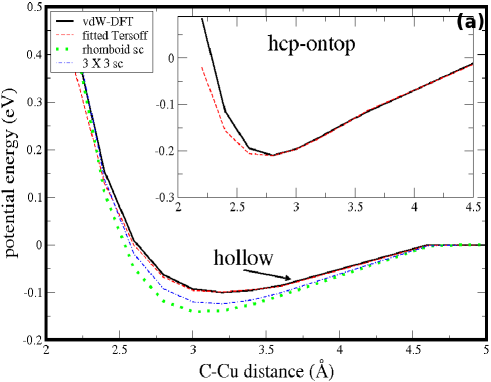
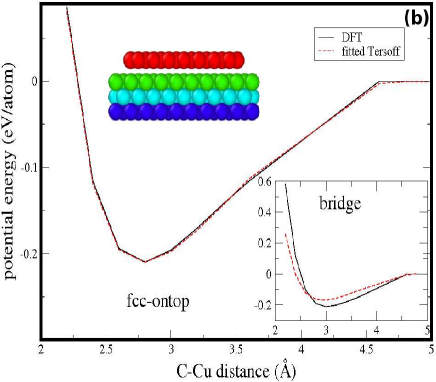
For fitting we used small representative gr/Cu(111) systems which are suitable for DFT calculations. These are typically smaller than 1000 atoms. We also separated different binding registry systems. We found it important because one has to force the free parameters to account correctly for weaker hollow adherence and for stronger ontop adhesion. In our fitting code potfit we were able to select in the fitting database and we could use different weights for different systems depending on the required results. In Figs 8(a) and 8(b) the obtained potential energy curves can be seen as obtained by a nonlocal vdW-DFT method LMKLL and by the fitted Tersoff potential for hollow, hcp-ontop (a) and for fcc, bridge (b) configurations. It can clearly be seen that in the hollow position adherence is much weaker, roughly the half of that of the hcp position. In general, the interfacial Tersoff potential follows the DFT curve and alters slightly from it mostly for the hcp and bridge systems at short C-Cu atomic separations (repulsive part of the curve). This could be the reason that the adhesion energy is slightly overestimated. The bridge system, which was not included in the training set, shows up some deviation from the DFT curve. Including, however, the bridge registry system in the fitting data base leads to the further deepening of the adhesion energy and to the deterioration of the match to the other DFT PECs. After many trials we found the hcp-hollow systems are suitable for fitting.
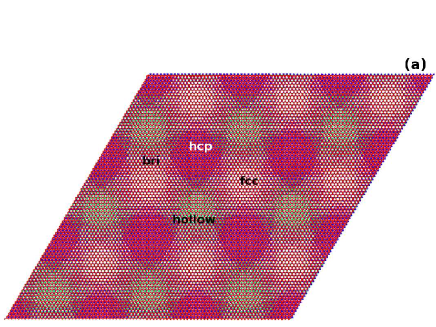
The potential energy curve (PEC) as a function of the C-Cu (sheet-to-sheet) distance has also been calculated by the fitted Tersoff potential for flat rhomboid supercells of different sizes. The corresponding PECs are also shown in Figs. 8(a) and 8(b). Increasing the size of the systems the PEC is getting closer to the PEC of the hollow system. Although for these large systems no DFT data is available, however, the calculated Tersoff potential provides PEC rather similar in shape to that of the hollow system and the well depth and position are also in the same range. The larger supercell is a mixed system with various binding sites (hollow, hcp, fcc and bridge, see Fig. 7(b))). The corresponding PEC in Fig. 8(a) reports us that the PEC is, however, ruled by the hollow registry, although the more strongly bound ontop sites (hcp, fcc and bridge) have also significant contribution to the average PEC.
References
- (1)
- (2) G. C. Abell, Phys. Rev. B31 6184, (1985).
- (3) J. Tersoff, Phys. Rev. B37, 6991 (1988).
- (4) D.W. Brenner, Phys. Rev. B42, 9458. (1990), D. W. Brenner, Phys. Rev. Lett. 63, 1022. (1989).
- (5) T. Liang, Y. Kyung Shin, Y-T. Cheng, D. E. Yilmaz, K. Guda Vishnu, O. Verners, C. Zou, S. R. Phillpot, S. B. Sinnott, and A. C.T. van Duin, Annu. Rev. Mater. Res. 43, 12.1-12.21, (2013).
- (6) P. Süle, M. Szendrő, Surf. Interf. Anal., 46, 42 (2014).
- (7) M. Corso et al., Boron Nitride Nanomesh. Science 303 217–220 (2004).
- (8) F. H. Stillinger and T. A. Weber, Phys Rev B31, 5262 (1985).
- (9) J. Klimes, D. R. Bowler and A. Michaelides, J. Phys.: Condens. Matter, 22, 022201. (2009).
- (10) E. Artacho, E. Anglada, O. Dieguez, J. D. Gale, A. García, J. Junquera, R. M. Martin, P. Ordejón, J. M. Pruneda, D. Sánchez-Portal and J. M. Soler, J. Phys.: Condens. Matter 20, 064208 (2008).
- (11) M. Szendrő, P. Süle, code potfit: parameter fitting of the Tersoff potential using ab initio DFT data base (2013).
- (12) P. Erhart and K. Albe, Phys. Rev. B71, 035211 (2005).
- (13) J. Nord , K. Albe , P. Erhart and K. Nordlund, J. Phys.: Condens. Matter 15 5649 (2003).
- (14) T. Yoon, W. C. Shin, T. Y. Kim, J. H. Mun, T.-S. Kim, B. J. Cho, Nano Lett. 12, 1448. (2012)
- (15) P. Erhart, K. Albe, Pontifix/Pinguin: A Program Package for Fitting Interatomic Potentials of the Bond-Order (2005), http://www.mm.mw.tu-darmstadt.de/pontifix, see also the manual at this site
- (16) M. Batzill, The surface science of graphene: Metal interfaces, CVD synthesis, nanoribbons, chemical modifications, and defects, Surface Science Reports, 67, 83. (2012).
- (17) S. J. Plimpton, Fast Parallel Algorithms for Short-Range Molecular Dynamics, J. Comp. Phys., 117, 1-19 (1995), see also the URL http://lammps.sandia.gov.
- (18) E. Artacho, E. Anglada, O. Dieguez, J. D. Gale, A. García, J. Junquera, R. M. Martin, P. Ordejón, J. M. Pruneda, D. Sánchez-Portal and J. M. Soler, J. Phys.: Condens. Matter 20, 064208 (2008).