Monte Carlo Simulation of RPC-based PET with GEANT4 ††thanks: partly Supported by National Natural Science Foundation of China (U1232206)
Abstract
The Resistive Plate Chambers (RPC) are low-cost charged-particle detectors with good timing resolution and potentially good spatial resolution. Using RPC as gamma detector provides an opportunity for application in positron emission tomography (PET). In this work, we use GEANT4 simulation package to study various methods improving the detection efficiency of a realistic RPC-based PET model for 511keV photons, by adding more detection units, changing the thickness of each layer, choosing different converters and using multi-gaps RPC (MRPC) technique. Proper balance among these factors are discussed. It’s found that although RPC with materials of high atomic number can reach a higher efficiency, they may contribute to a poor spatial resolution and higher background level.
keywords:
PET, resistive plate chamber, Monte Carlo, GEANT429.30.Kv, 29.40.Cs, 29.85.Fj
1 Introduction
Positron emission tomography (PET) is a nuclear medicine imaging technique that provides three-dimensional (3-D) images of a tissue [2]. Short-life radionuclides, such as 11C and 13N, can emit into the tissue. After a short distance, the emitted positron annihilates with an electron. As a consequence, a pair of photons with about 511keV energy are produced and move in approximately opposite directions. By detecting the photons, a 3-D spatial distribution of the radionuclides can be reconstructed.
One application of PET is on small animal tomography. Considering their small size, high spatial resolution imaging detectors are required. However, a traditional PET system is usually based on a crystal scintillator, which has a limited spatial resolution and is rather expensive [3]. A few years ago, a novel PET based on Resistive Plate Chambers (RPC) was proposed [4] due to its good timing resolution, potentially good spatial resolution and low cost.
RPC is a gas detector that has been widely used in high energy physics for decades [5]. It exploits gas amplification in a uniform electric field between two resistive parallel plates. When a charged particle passes through the chambers, gas molecules in the gap are ionized into electrons and ions. In a strong electric field, the liberated electron causes an avalanche (usually with spatial development of sub-mm size). By detecting the avalanche signal, the position and time when the charged particle is hit can be recorded. RPC is typically used to detect a charged particle. Photons, as neutral particles, can be detected by RPC only after they have been converted to electrons. However, the efficiency of RPC for 511keV photons is low (). Therefore, a major topic on the RPC-PET technique is to enhance its detection efficiency for 511keV photons.
A small-animal PET system with timing RPC technology has been built and tested [7]. Detailed simulation of converter-plate stacks made of three materials has been performed, and efficiency measurements has confirmed the reliability of the simulation results [8]. In Ref. [9], three designs of RPC have been discussed, the best one is a sandwich-type gas-insulator-converter detector, with bismuth or lead converters. It can reach a high efficiency and significantly suppress the RPC’s respond of low-energy photons.
In this paper, we want to further study the performance of a RPC-PET structure by using Monte Carlo simulation, based on more realistic detector structure compared to previous works. Our experience on multi-gap RPC (MRPC) [11][12][13][14] is used for this study. We essentially introduced four methods to improve the RPC detection efficiency for 511keV photons: adding more detection units, changing the thickness of each layer, choosing different converters and using multi-gaps RPC. Furthermore, we found that a compromise between the detection efficiency and spatial resolution should be made. At last, several image reconstructions are performed to check the reconstruction ability of RPC with different converters.
2 Detector Configureation
The detector configuration is shown in Fig. 1. A detection unit, sandwiched between left glass (L Glass) and right glass (R Glass) plates, is composed of 2 printed circuit boards (PCB), 2 graphite layers and 1 copper (readout pad) layer. Between two readout layers, one or more inner glass (I Glass) plates can be inserted. The glasses serve as the highly resistive material, while graphite layers between the PCB and glass are used as HV electrode. The gas gap is filled with a mixture of . The size of RPC is . The thickness of each layers can affect the detection efficiency, and will be discussed later in the article. The gamma source is simplified as a point-like source emitting 511keV photons, which is placed in front of the RPC and the direction of incident is set perpendicular to the surface. The criterion of whether a photon is detected is that at least one electron converted from the photon, emerges in the gas gap and deposits non-zero energy. The GEANT4 package (version Geant4-09-02-patch-01) has been used for the simulation [15].

3 Results and discussion
A primary 511keV photon is converted to electron mainly through two processes: photoelectric effect and Compton scattering. For clarity, various converted electrons that come directly from the primary photon, either through photoelectric effect or Compton scattering, are called A-type electrons. All other electrons that come from multiple Compton scattering, with or without photoelectric effect, are called B-type electrons. The spatial resolution of the former electron is found to be much better than the latter since the secondary photon deviates from the original direction after undergoing Compton scattering. When B-type electrons (converted from the secondary photons) are detected, we can not accurately distinguish the original photon direction. Hence, the spatial resolution deteriorates and the photon pair reconstruction of the PET is unprecise.
According to the simulation, only of the produced electrons pass through the gas gap with zero energy deposited. That means if an electron emerges in the gap, it would cause an avalanche at probability. Meanwhile, a positron can be located by detecting the pair of photons coming from the annihilation. If the detection efficiency of RPC for a 511keV photon is and the percentage of A-type electrons (among all converted electrons) is , then of all emitted photons are useful for image reconstruction. It’s thus clear that the efficiency and the percentage of A-type electrons are both important for the PET image reconstruction.
3.1 Efficiency
Since the detection efficiency of RPC currently used in high energy physics experiments for 511keV photons is low, our main goal is to improve it. We have attempted to vary the parameters used in our simulation and have found that efficiency mainly depends on four factors: the number of gaps, the thickness of material, the thickness of converter, and the number of inner glasses.

3.1.1 Number of gaps
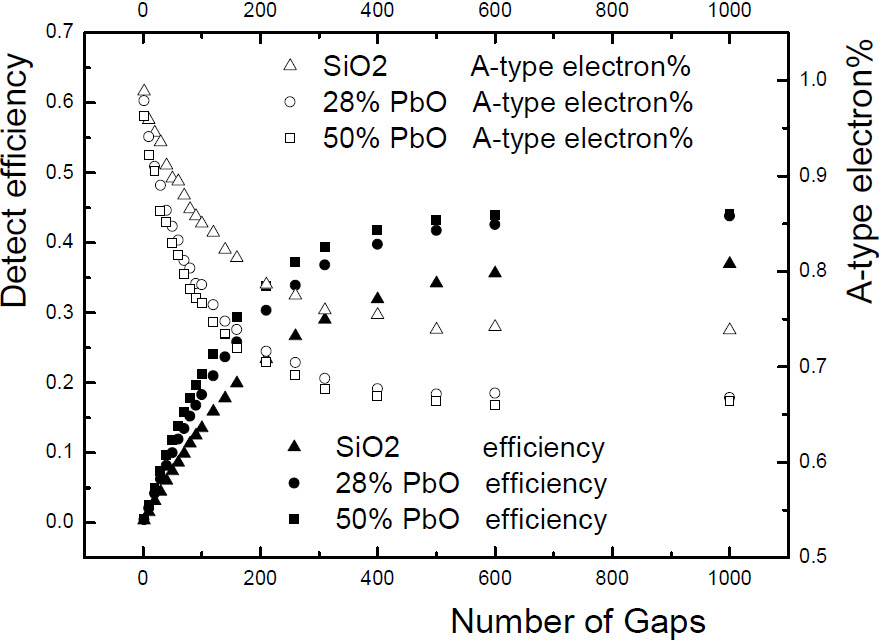
We can enhance the detection efficiency by using more gas gaps, as shown in Fig. 2. Here, the gaps means the total gaps of all the RPC units (e.g. the total number of gaps for 45 RPC units with one inner glass is 90). The efficiency increases with the number of gaps and reaches saturation afterwards. If the RPC has a large number of gaps, almost all the photons will be absorbed by RPC so that adding more units would be meaningless. Also, we can find that RPC with lead glass has a higher detection efficiency. In Fig. 2, ”SiO2” refers to RPC with normal glass as converter, while / PbO means lead glass convertor containing / PbO in weight. In the following sections we’ll choose 90 gaps for further disucssion, considering the feasibility in producing a real prototype [8][13]. The configuration of RPC is as follows: an active area of , one inner glass, normal glass as converter, and 90 gaps in total. The thickness of each layer are: PCB 0.2 mm, Copper 0.035 mm, graphite 0.02 mm, glass 0.1 mm, and gas gap 0.22 mm. In the rest of this paper, this defined configuration is always used unless otherwise specified.
3.1.2 Thickness
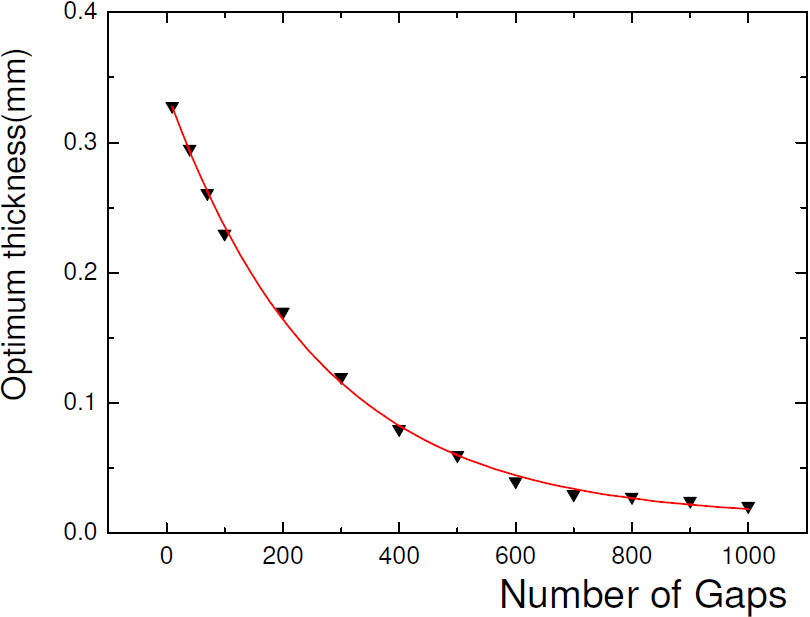
The dependence of efficiency on the converter thickness was discussed in Ref. [9]. Efficiency increases with converter thickness until a maximum value is reached, and after which it will start to decrease. Our simulation results indeed confirms this conclusion. As Shown in Fig. 3, for a 70-gap RPC the efficiency reaches its maximum when the thickness of glass is approximately 0.26mm (optimal thickness), then decreases. Furthermore, we find that the optimal thickness has an exponential relation to the number of gaps, see Fig. 4. As the number of total gas gaps increase, to maximize the detection efficiency the convertor has to be thinner. A RPC can be simplified as a converter-gap-stacks model, thus the number of electrons emerging in gaps reads [9]:
, with .
In this formula, is the initial number of photons, is the photon interaction coefficient, is the electron interaction coefficient, and is the photon beam attenuation coefficient. All the coefficients , and are constants. However, from this model the exponential relationship in Fig. 4 can not be deduced. Besides, for thin converters, a fraction of electrons converted in non-converter materials (such as PCB) can emerge into the gas gap and contribute to the overall efficiency. This discrepancy may arise from the simplification in [9] that the electron interaction coefficient is constant, which is not true considering eg. the asymmetric photon energy distribution in forward and backward scatter direction and the non-linear absorption tail at the end of an electron’s range. Non-converters, such as PCB, copper layer and graphite, can also influence detection efficiency.Based on an overall consideration of various factors, the optimal thickness simply decreases exponentially with the number of gaps. This simple relationship is useful when designing a practical RPC.
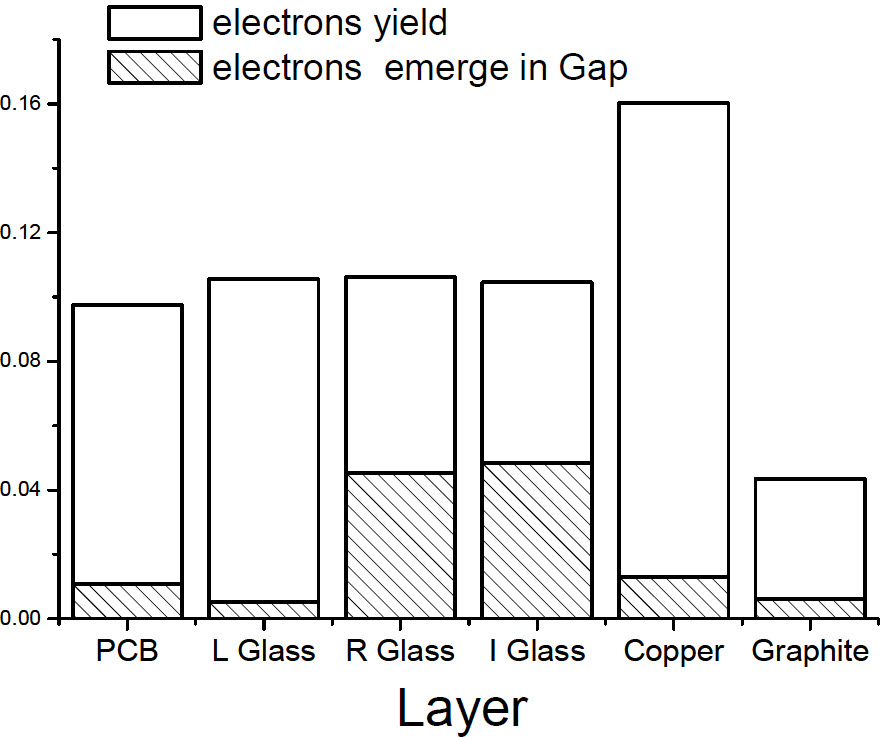
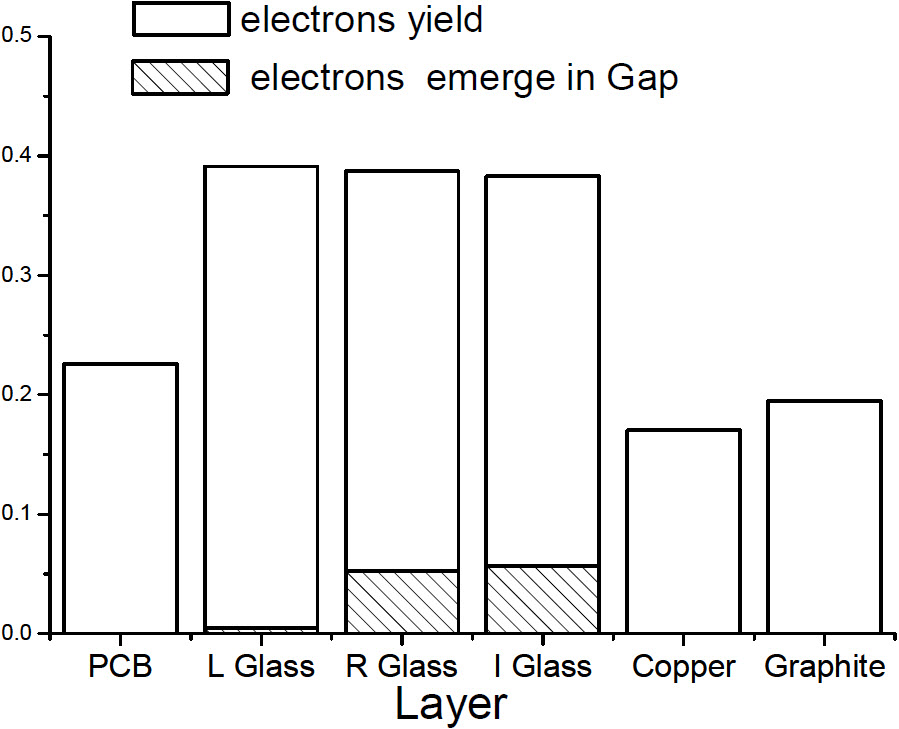
Detection efficiency depends on two processes: photon interaction with materials and electron propagation through materials. Electrons converted in a non-converter is more likely stopped by glasses and be unable to emerge in the gap. Thus, these electrons (which are converted in non-converter materials) make less contribution in photon detecting, but rather consuming photons. As shown in Fig. 5(a), most of the electrons converted in a non-converter (PCB, copper, and graphite electrode) do not emerge in the gap as a result of stopping by glasses and other materials. In contrast, half of the electrons converted in inner and right glasses can emerge in the gas gap, thus be detected. Consequently, the thinner the non-converter materials are, the higher the efficiency is for a larger number of gaps. Furthermore, electrons converted in left glass can hardly emerge in the gap. Therefore, it could be thinner than the I and R Glasses. In Fig. 5(b) thicker non-converter and converter are used to compare with thinner materials in Fig. 5(a). It’s found although the efficiency to detect an electron is similar, the ratio of detected to produced electron is much smaller in Fig. 5(b). This will affect the final detection efficiency at large gas gap limit. Note in Fig. 5(b) the number of electrons yield is larger than the number of original 511keV photons, since one photon can produce more than one electron. Both the number of electrons yield and electrons emerging in the gap are normalized by the number of original 511keV photons in Fig. 5. Hence the sum of electron yield from all layers can be larger than 1.
3.1.3 Converter
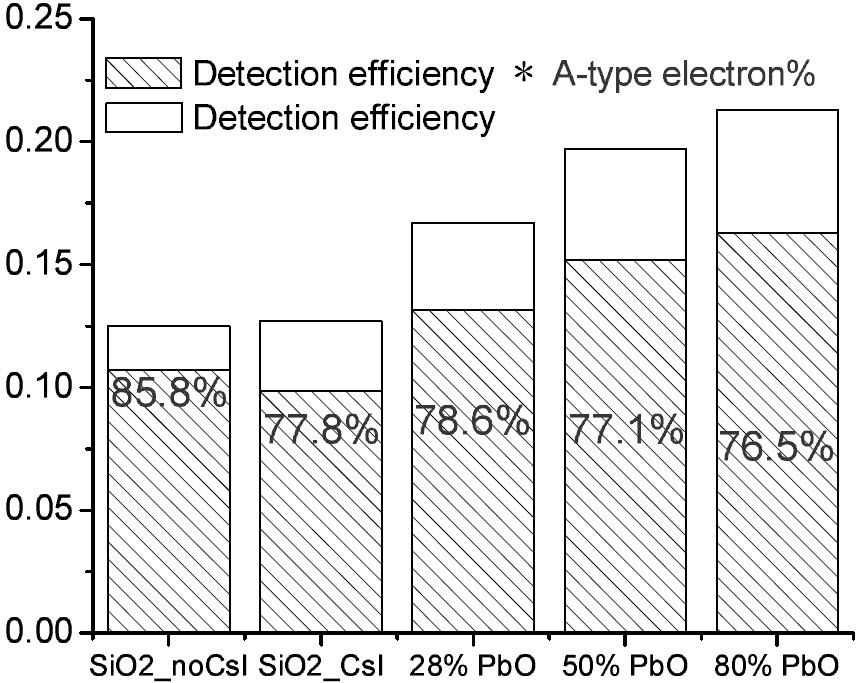
The cross-sections for photon interactions with materials increase with atomic number. Therefore, materials with high atomic number elements are considered in the simulation. We have attempted to use several materials as converters: normal glass, lead glass containing PbO, and normal glass coated with CsI. As shown in Fig. 6, glass with CsI coating has only slightly higher efficiency than normal glass, because the CsI layers not only produce electrons, they also block electrons from emergin into the gas gaps. For lead glass, although the detection efficiency increase with the percentage of PbO, the A-type electron percentage decreases (ie. B-type electron percentage increses). A larger percentage of B-type electrons in lead glass lead to a poorer spatial resolution. With glass containing PbO, the overall detection efficiency of RPC reaches , while the A-type electron percentage drops to .
The A-type electron percentage also depends on the number of total gas gaps, as shown in Fig. 2. Adding more detection units and using high atomic materials will increase detection efficiency and meanwhile decrease the A-type electron percentage. At large number of gas gap, the efficiency and A-type electron percentage curve of PbO and PbO have only little difference. In such a case it’s not sensitive to vary the percentage (eg. ) of PbO.
3.1.4 Number of inner glasses
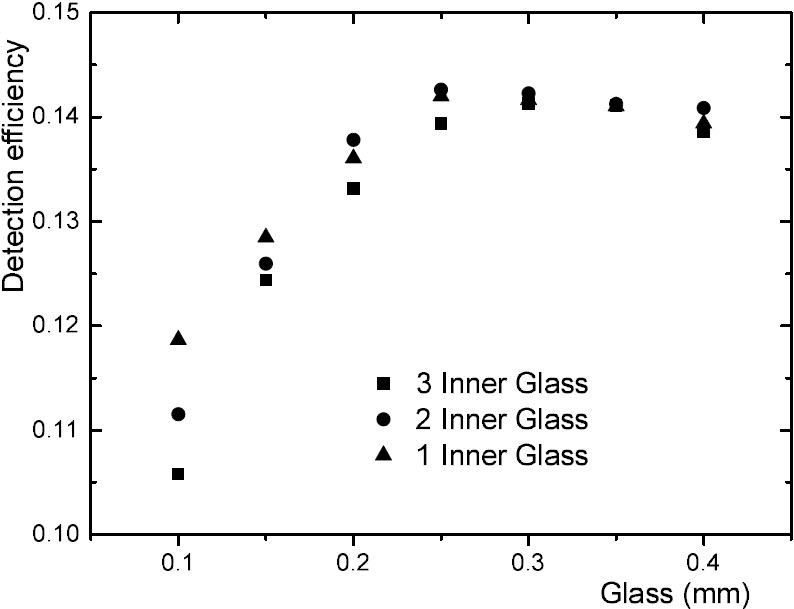
Different numbers of inner glass (I Glass) can also influence efficiency. The efficiency of RPC with different numbers of inner glass (ie. MRPC) are compared, as shown in Fig. 7. When the thickness of the I glass is around the optimal value (), the RPCs with 1, 2 or 3 inner glasses show little difference in efficiency.
Note in the simulation the total number of gas gaps and thickness of each layer (except I glass) are fixed, and normal glass is used as converter.

3.2 Spatial resolution
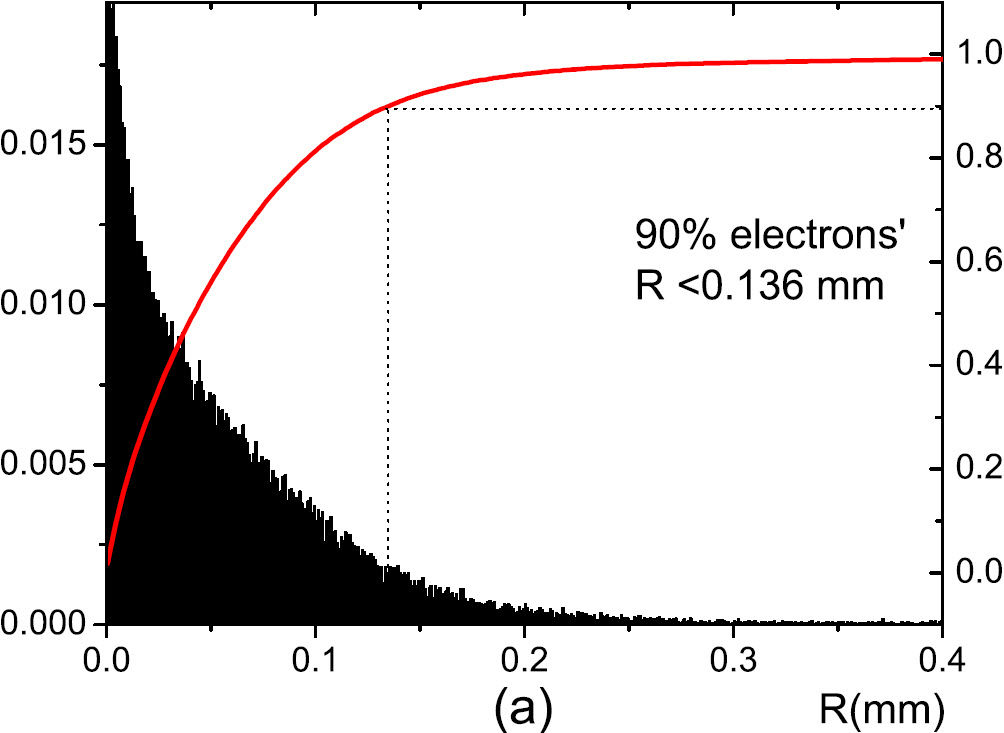
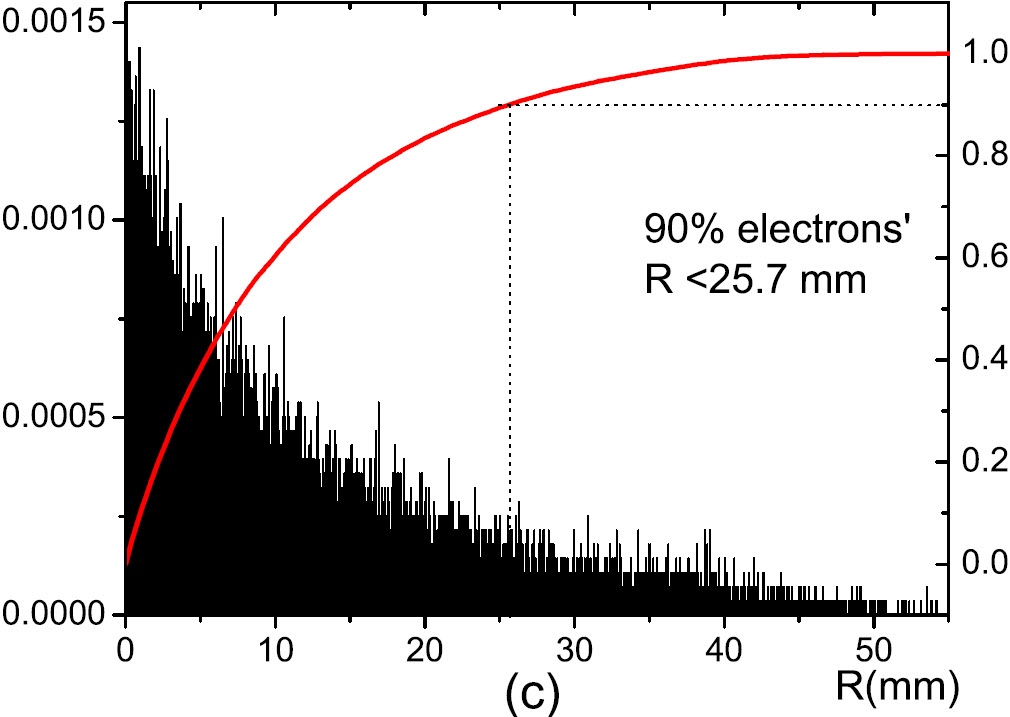
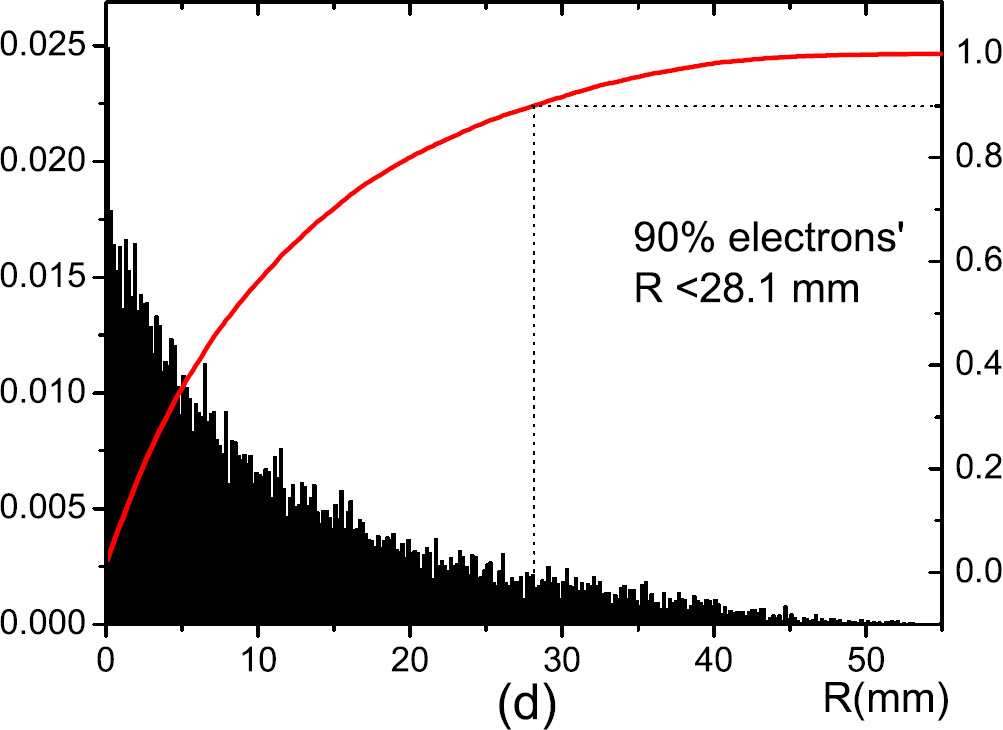
We have discussed the A-type and B-type electrons previously, and mentioned the spatial resolution of A-type electrons is much better than that of B-type electrons. Based on the simulation data, we calculate the distribution of hit position, the results of which are as shown in Fig. 8. R is defined as the deviation of the position when the electron is hit from the incident direction of the original photon. As shown in Figs. 8(a) and 8(b), the R value of almost electrons is less than 0.15 mm for the A-type electrons. However, more than B-type electrons’ R value is larger than 10 mm, as shown in Figs. 8(c) and 8(d). Noticeably, a small percentage of A-type electrons leads to a much worse spatial resolution. Hence, the percentage of B-type electrons should be suppressed for good PET reconstruction. A compromise should be made between the detection efficiency and spatial resolution. Lead glass may be selected in cases RPC with fewer gaps are needed (eg. 10 gaps and lead glass of PbO). If a higher resolution is required, a converter of normal glass with more gas gaps should be considered (eg. 90 or more gas gaps and normal glass).
3.3 Image reconstruction
In order to check the capability of image reconstruction, four RPCs are placed in the x-y plane with an isotropic 511keV gamma source at the center of the four RPCs. We are not mainly concerned with image reconstruction method in this paper. Therefore, we only use a simple back-projection algorithm for demonstration purpose. Various sophisticated methods in the field of PET exist, including the filter back-projection (FBP) algorithm [16], a standard reconstruction algorithm. Each event is composed of a pair of 511keV photons that are emitted from the center of four RPCs and move in opposite directions. If both photons are detected, two hits are recorded. We can then reconstruct the image by connecting the two hit points.
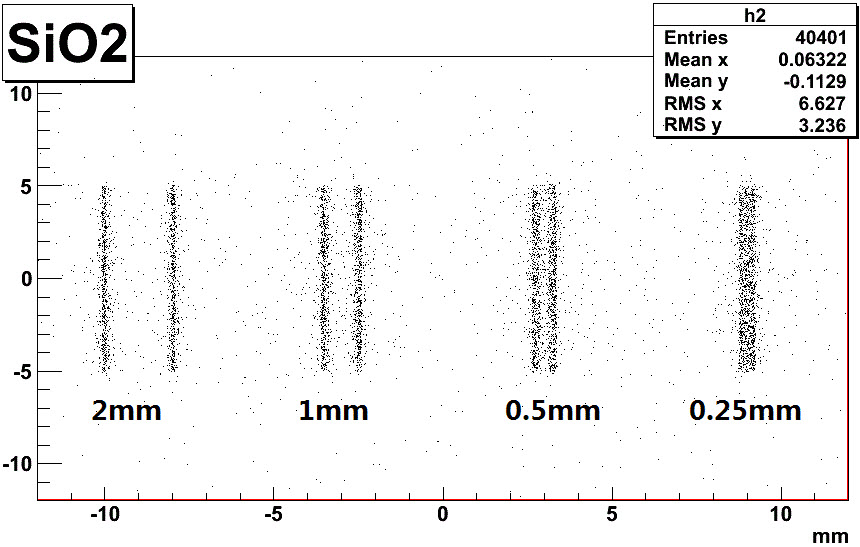
We have performed several reconstructions of double-line sources, as shown in Fig. 9. We can observe that RPC has the ability to distinguish two lines separated by about . Please note in Fig. 9 no other factors are considered, such as the hit positioning uncertainty of the RPC.
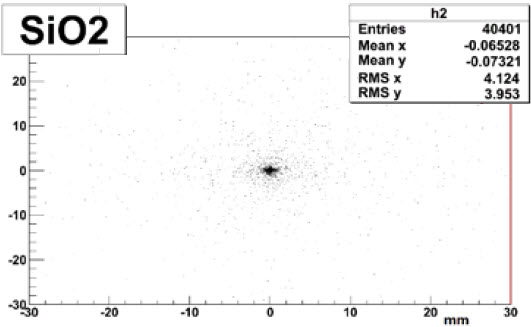
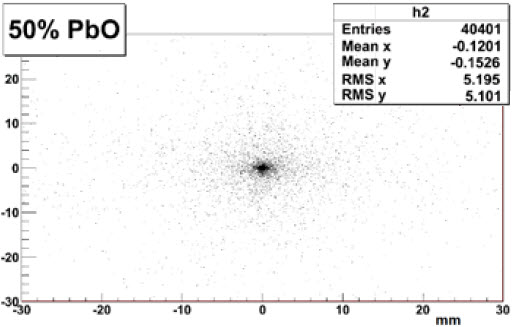
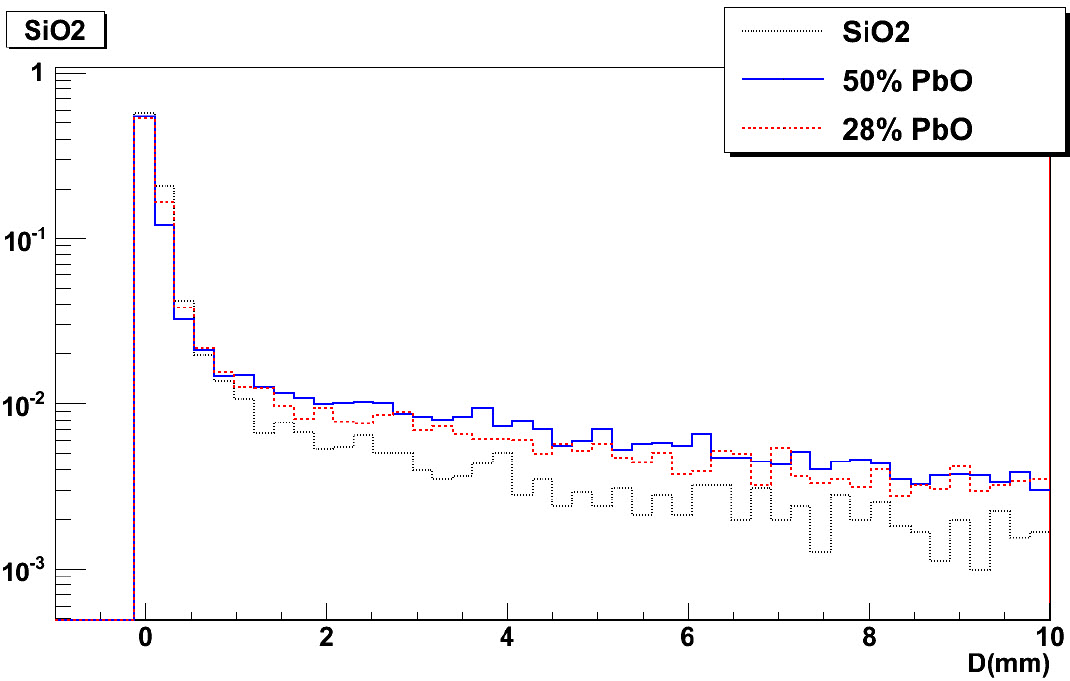
To compare the difference of spatial resolution between lead glass and normal glass converter, we have performed several reconstructions image using three different RPC converter materials. The back-projected scatter points are shown in Fig. 10, while the distributions of D are shown in Fig. 11. Here, D is defined as the distance between each line connecting the two hits and the source points, which is at the center of the four RPCs. Lead glass has definitely a stronger background compared with normal glass. The reconstructed background level when using PbO converter is approximately times larger than when using normal glass. So if heavy elements such as Pb, Bi and Au are used in converters, a strong background may seriously influence image reconstructions. For example, considering that a strong source and a weak source are close to each other, the high background level from lead glass by the strong source may cause a low-quality reconstruction of the weak source. Thus a comprise may be needed between improving the detection efficiency and decreasing the spatial uncertainty.
4 Conclusion
Various methods are attempted to improve the detection efficiency of RPC for 511keV photons, by adding more gaps, tuning the thickness of the converter, choosing thin non-converter materials, using converter containing high atomic number elements, and selecting multi-gaps RPC. Although RPCs with materials of high atomic number elements can reach a higher efficiency, they may lead to a stronger background, thus worsens the spatial resolution. A compromise should then be made between detection efficiency and spatial resolution. Lead glass can be chosen as the converter in cases that RPC with fewer gaps are used and short imaging time is needed. A converter composed of normal glass having more gaps should be considered if a higher resolution is required. With the RPC structure described in this paper, when 90 gaps is chosen, the detection efficiency of RPC with lead glass containing PbO can reach , while that of RPC with normal glass is . Meanwhile the A-type electron percentage decrease from to .
References
- [1]
- [2] G. Muehllehner, J.S. Karp, Phys. Med. Biol. 51 (2006) 117.
- [3] Y.-C. Tai et al., Phys. Med. Biol. 48 (2003) 1519.
- [4] A. Blanco et al., Nucl. Instr. Meth. A 508 (2003) 88.
- [5] Santonico R. and Cardarelli R., Nucl. Instr. and Meth. 187 (1981) 377.
- [6] P. Fonte et al., Nucl. Instr. Meth. A 477 (2002) 17.
- [7] A. Blanco et al., Nucl. Instr. Meth. A 533 (2004) 139.
- [8] A. Blanco et al., Nucl. Instr. Meth. A 602 (2009) 780.
- [9] G. Georgiev et al., JINST 8 (2013) P01011.
- [10] Zeballos Cerron E. et al., Nucl. Instr. Meth. A 374 (1996) 132.
- [11] M. Shao et al., Nucl. Instr. Meth. A 492 (2002) 344.
- [12] Y.J. Sun et al., Nucl. Instr. Meth. A 593 (2008) 307.
- [13] S.An et al., Nucl. Instr. Meth. A 594 (2008) 39.
- [14] Y.E. Zhao et al., Nucl. Instr. Meth. A 547 (2005) 334.
- [15] S. Agostinelli et al., Nucl. Instr. Meth. A 506 (2003) 250-303; J. Allison et al., IEEE Trans. on Nucl. Sci. 53 (2006) 270-278.
- [16] P.E. Kinahan and J.G. Rogers, IEEE Trans. Nucl. Sci. 36 (1990) 964.