Superconducting Properties of the KxWO3 Tetragonal Tungsten Bronze and the Superconducting Phase Diagram of the Tungsten Bronze Family
Abstract
We report the superconducting properties of the KxWO3 tetragonal tungsten bronze. The highest superconducting transition temperature ( K) was obtained for K0.38WO3. decreases linearly with increasing K content. Using the measured values for the upper critical field , and the specific heat , we estimate the orbital critical field (0), coherence length (0), Debye temperature and coupling constant . The magnitude of the specific heat jump at suggests that the KxWO3 tetragonal tungsten bronze is a weakly-coupled superconductor. The superconducting phase diagram of the doped tungsten bronze family is presented.
pacs:
74.25.-q,74.25.Dw,74.25.F-,74.25.fc,74.20.PqI Introduction
The WO3 tungsten bronzes, where is an ion that donates electrons to the WO3 framework, show a wide range of interesting physical properties and several distinct crystal structures. Many studies have been performed on the superconductivity in this family since its initial discovery. mattias1964 Tungsten bronzes share features with other oxide superconducting systems, such as having a relatively low density of electronic states at the Fermi Energy and s that are highest close to a structural phase boundary. The superconducting WO3 tungsten bronzes are non-stoichiometric compounds that can have hexagonal bronze ( HTB), tetragonal bronze (TTB-I), or perovskite-derived tetragonal (TTB-II) and cubic (CTB) structures. sweedler1965 ; 2sweedler1965 ; mattias1964 ; sleight1975 ; brusetti2007 ; cadwell1981 ; wiseman1973 ; ostenson1978 ; kasl2013 ; lee1997 ; sagar2010 ; ingham2005 ; 2ting2007 ; skakon1979 ; stanley1979 ; howard1975 ; guo2008 ; banks1968 ; remeika1967 ; daigo2011 ; josh2013 ; shein2011
Although the superconducting HTBs in particular have been well studied, a detailed investigation of the superconducting properties of the tetragonal tungsten bronze (TTB-I) system is lacking up to the present time. Superconductivity in TTB-I bronzes has been reported for NaxWO3 , KxWO3 and Ba0.13WO3, howard1975 ; sweedler1965 ; 2sweedler1965 but contradicting this, TTB-I K0.58WO3 has recently been reported as a semiconductor. fan2000 Here we report a detailed study on the superconducting KxWO3 tetragonal tungsten bronze TTB-I phase. The experimental characterization is supplemented by electronic structure calculations. Finally, we present a phase diagram for superconductivity across the full HTB, TTB-I, and CTB tungsten bronze family.
II Experiment and Calculation
The KxWO3 samples were prepared by solid state reaction method starting from pre-made K2WO4, purified WO2 (99.8; Alfa Aesar) and WO3 (99.8; Alfa Aesar) according to the following reaction:
| (1) |
The K2WO4 precursor was prepared by reacting stoichiometric amounts of K2CO3 and WO3 in air at 650 0C for 12 hrs. Stoichiometric amounts of materials according to equation 1 were mixed and pressed into pellets inside an Ar-filled glove box. The pellets were transferred into alumina crucibles and sealed inside evacuated quartz glass tubes that were heated at 650 0C and 800 0C for two nights with intermediate grinding. The reacted samples were kept inside the glove box. (Such handling is necessary to avoid the decomposition that possibly results in the observation of semiconducting behavior.) The purity and cell parameters of the samples were evaluated by powder X-ray diffraction (PXRD) data at room temperature on a Bruker D8 FOCUS diffractometer (Cu. Lattice parameters were refined by the Rietveld method rietveld1969 using the FULLPROF program integrated in the WINPLOTR software. fullprof Elemental analysis performed using energy dispersive spectroscopy (EDS) showed that the potassium contents in the samples are very close to the nominal values; therefore the nominal potassium stoichiometries are used in this report.
The electrical resistivity was measured using a standard four-probe dc-technique with an excitation current of 10 mA; small diameter Pt wires were attached to the sample using silver paste. Data were collected from 0.4 K to 300 K in zero-field and also in magnetic fields up to 1 T using a Quantum Design Physical Property Measurement System (QD-PPMS) equipped with a 3He cryostat. The specific heat was measured between 0.4 K and 20 K under fields of H = 0 T and 1 T in the PPMS using the time-relaxation method. The electronic structure calculations were performed by density functional theory (DFT) using the WIEN2K code with a full-potential linearized augmented plane-wave and local orbitals [FP-LAPW + lo] basis blaha2001 ; sign1996 ; madsen2001 ; sjosted2000 together with the PBE parameterization perdew1996 of the GGA, including spin orbit coupling (SOC). The plane-wave cutoff parameter RMTKMAX was set to 7 and the Brillouin zone was sampled by 2000 k points. Experimental lattice parameters from the Rietveld refinements were used in the calculations. A fully ordered K0.6WO3 TTB crystal structure (K6W10O30) was employed for the calculations.
III Results and Discussion
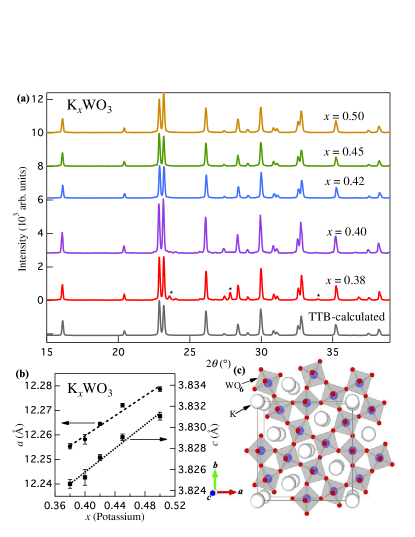
Fig. 1 shows the structural analysis of the materials by PXRD. Samples from to are purely the tetragonal-I phase (P4/, space group number 127) without any impurities. The sample shows a small amount of HTB impurity (asterisk marks in Fig. 1(a)). A linear variation of lattice parameters with composition can be observed in Fig. 1(b). This behavior is a good indicator that the TTB-I series is successfully formed in this composition range. The sample falls very well on the trend, and also on the trend of the linear variation of with potassium doping (see inset of Fig. 2(b)). These observations, in addition to the presence of the small amount of impurity phase in the PXRD pattern indicates that is very close to the HTB-TTB phase boundary. The crystal structure of the KxWO3 tetragonal tungsten bronze is shown in Fig. 1(c).
WO3 itself is a semiconductor with a band gap of approximately 2.5 eV. kopp1977 For the tungsten bronzes, alkali metals such as K or Na in the tunnels donate one electron per ion to the WO3 framework, inducing metallic behavior and superconductivity in the framework at a sufficient electron doping level. Fig. 2 shows the electrical resistivity data for the KxWO3 TTB-I phase in the range of . Fig. 2(a) shows the normalized resistivity from 300 K to 0.4 K. The normal state resistance behavior of the TTB-I system is quite different from that of the HTB system, which shows anomalous peaks in (T) and semiconducting behavior in some composition ranges. cadwell1981 ; josh2013 The present system is a bad metal, showing an almost temperature independent resistance in the normal state for most compositions of the TTB-I phase, with a residual resistivity ratio () that decreases with increasing K doping. This may indicate that the disordered K in the tunnels (which would be filled for K0.60WO3) has a stronger influence on the resistivity at higher electron doping levels.
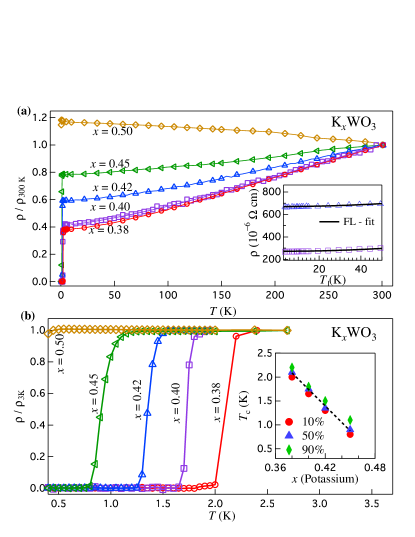
The temperature dependence of the resistivites for the and samples between 2 K and 50 K are shown in the inset for Fig. 2(a). The behavior is metallic . The normal-state resistivity is fairly low (about at room temperature) and the residual resistivity ratio () is small. The low-temperature resistivity data can be described by the power law, with , the residual resistivity , and the coefficient . The Fermi-liquid fits are shown as solid lines in the inset to Fig. 2(a). The value of is small, an indication of the good quality of the polycrystalline samples employed for the measurements. The value of is often taken as a measure of the degree of electron correlations; the value found here suggests that KxWO3 is a weakly correlated electron system and the variation of the low temperature resistivity with indicates Fermi-liquid behavior. kittel Fig. 2(b) shows the superconducting transition for all the K-doped TTB-I bronze samples. The quality of the superconducting transition is high - the 10 to 90 width for all the samples is smaller than 0.2 K. The raw data clearly show that the superconducting decreases with increasing electron doping (i.e. increasing K content) of the TTB-I phase. The behavior of with doping is extracted from these data and is presented in the inset of Fig. 2(b).
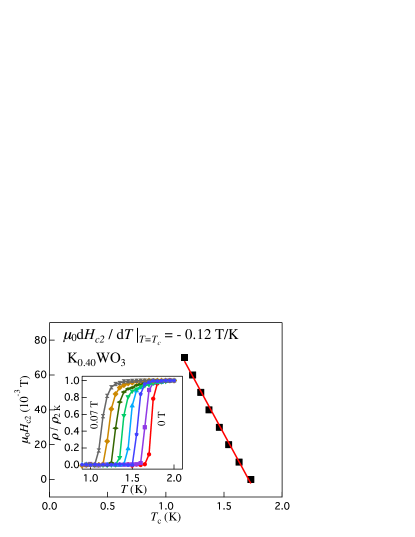
Fig. 3 shows an analysis of the magnetoresistance data for the sample. The width of the superconducting transition increases slightly with increasing magnetic field. Selecting the 50 normal resistivity point as the transition temperature, we estimate the orbital upper critical field, (0), from the Werthamer-Helfand-Hohenberg (WHH) expression, . A very linear relationship is observed in the Fig. 3 between and . The slope is used to calculate 0.14 T for . The value of is much smaller than the weak coupling Pauli paramagnetic limit T for . Small values of upper critical field are an intrinsic property of the superconducting tungsten bronze family; the upper critical field () that we find for the KxWO3 TTB-I superconductor is lower than that reported for the HTB and CTB systems (see Table. 1), with the exception of the Rb doped HTB, ting2007 which shows similar values of . The upper critical field value of the K0.40WO3 TTB-I superconductor can be used to estimate the Ginzburg-Landau coherence length Å, where is the magnetic flux quantum. clogston1962 ; werthamer1966 This value is comparable to that for the Rb doped HTB and larger than that for the F doped CTB. daigo2011 ; ting2007
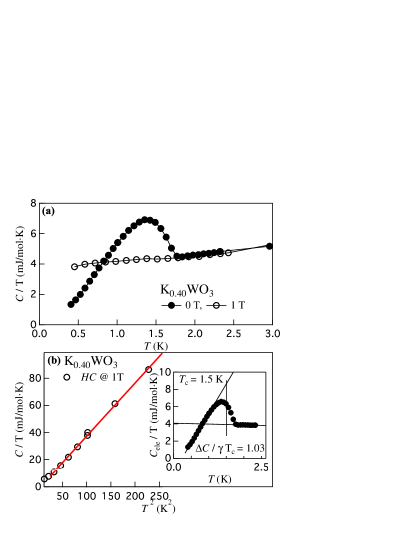
Fig. 4 shows the characterization of the superconducting transition by specific heat measurements. Fig. 4(a) shows as a function of , which shows the specific heat jump at the thermodynamic transition. This jump is completely suppressed under 1 T applied magnetic field. The superconducting transition temperature () = 1.5 K is shown in the inset of Fig. 4(b), as extracted by the standard equal area construction method. The ratio can be used to measure the strength of the electron-phonon coupling. padamsee1973 The low temperature normal state specific heat can be well fitted with , where represents the electronic contribution and represents the lattice contribution to the specific heat. The solid line in Fig. 4(b) shows the fitting; the electronic specific heat coefficient and phonon/lattice contribution are extracted from the fitting.
The value of obtained is relatively small, but is slightly higher than that of the cubic tungsten bronze superconductor at approximately the same degree of electron doping. daigo2011 ; zumsteg1976 The low value of is an indication of a low density of states near the Fermi level, which is a characteristic of the superconducting tungsten bronze family (see Table. 1). The specific heat jumps for the sample is about 5 mJ mol-1 K2, setting the values of to 1.03 for . This is smaller than the theoretical value of 1.43 for a conventional BCS superconductor. The results suggest that TTB-I KxWO3 is a weakly electronphonon coupled superconductor.
In a simple Debye model for the phonon contribution to the specific heat, the coefficient is related to the Debye temperature through , where . The calculated Debye temperature for K0.40WO3 is 242.4 K. This value of Debye temperature slightly lower than that of the CTB daigo2011 ; zumsteg1976 and HTB bevolo1974 superconductors. High values of Debye temperature are often deduced for the tungsten bronze family. This can be explained by including an Einstein term in the heat capacity, due to the rattling of the dopant ion in its cavity. The measurements give only the sum of the framework Debye and dopant ion Einstein contributions. bevolo1974
| Parameter | Units | HTB | TTB | CTB | |
|---|---|---|---|---|---|
| (Ref. 24, 22) | (Ref. 15) | ||||
| RbxWO3 | K0.40WO3 | WO2.59F0.41 | |||
| K | 2.7-4.3 | 1.73 | 0.4 | ||
| 0.27 | |||||
| -0.067 to -0.4 | -0.12 | -1.89 | |||
| T | 53-140 | ||||
| T | 0.11-1.2 | 0.14 | 0.53 | ||
| T | 4.9-7.9 | 3.22 | 0.74 | ||
| Å | 538-113 | 485 | 250 | ||
| Å | 2450-1506 | ||||
| 4.2 | 4.15 | 1.59 | |||
| 1.43 | 1.03 | 1.1 | |||
| 415 | 242 | 340 | |||
| 0.52 | |||||
| 0.27 |
An estimation of the strength of the electron-phonon coupling can be derived from the McMillan formula. mcmillan1968 ; poole1999
| (2) |
McMillan’s model contains the dimensionless electron-phonon coupling constant , which, in the Eliashberg theory, is related to the phonon spectrum and the density of states. This parameter represents the attractive interaction, while the second parameter accounts for the screened Coulomb repulsion.
Using the Debye temperature , critical temperature , and assuming , the electron-phonon coupling constant () obtained for K0.40WO3 is 0.52, which suggests weak-coupling behavior. This agrees well with . The value of extracted from the measured specific heat data corresponds to an electronic density of states at the Fermi energy of 0.27 states/(eV f.u.) (f.u. = formula unit), as estimated from the relation kittel
| (3) |
Assuming that the diamagnetic and vanVleck contributions to the magnetic susceptibility are small, susceptibility at 10 K () can be considered as the spin susceptibility and estimate Wilson ratio = 0.6, which is small but close to the free electron value of 1. Also, the coefficient of the quadratic resistivity term can be normalized with the effective mass term from the heat capacity, which gives the Kadowaki-Woods ratio . This ratio is found to be 0.24 , where = 10. and both indicate that K0.42WO3 is a weakly-correlated electron system. jacko2009 ; wilson1975 ; yamada1975 ; amar2011
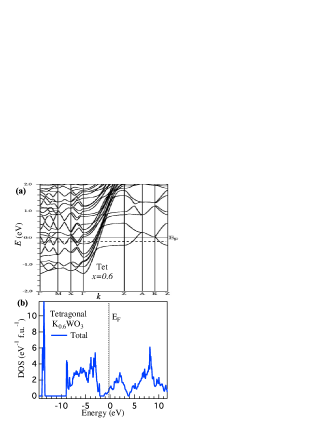
Fig. 5 shows the analysis of the electronic density of states for the potassium doped tetragonal tungsten bronze. Fig. 5(a) shows the band structure in the vicinity of EF, and (b) shows the total DOS, of K0.6WO3 as a function of energy. A similar calculation was done on tetragonal WO3 without potassium, suggesting that the rigid band model works well for K doped TTB-I. The dotted lines in Fig. 5(a and b) represent the Fermi level for doping level, which was found by integrating the DOS. The band structure calculation clearly shows that near the Fermi level transitions through a van Hove singularity (vHs) followed by a flat band between the and points. This anomalous electronic structure is found close to the change from hexagonal to tetragonal structural phases in the KxWO3 system. Although it is generally expected that a vHs has a significant influence only on superconductivity in 2D electronic systems hirsch1986 ; dzaloshinskii1987 ; felser1999 ; felser1997 the highest observed at in the doped TTB-I phase appears to be well correlated with the vHs present in the band structure. Fig. 5(b) shows the potassium doping effect, i.e. of increased electronic concentration, on the insulating WO3 system. The Fermi level (EF) is shifted upward, shein2011 ; ingham2005 into the bottom of the conduction band. This leads to the metallic behavior of the KxWO3 TTB-I phase up to the highest possible K doping level .
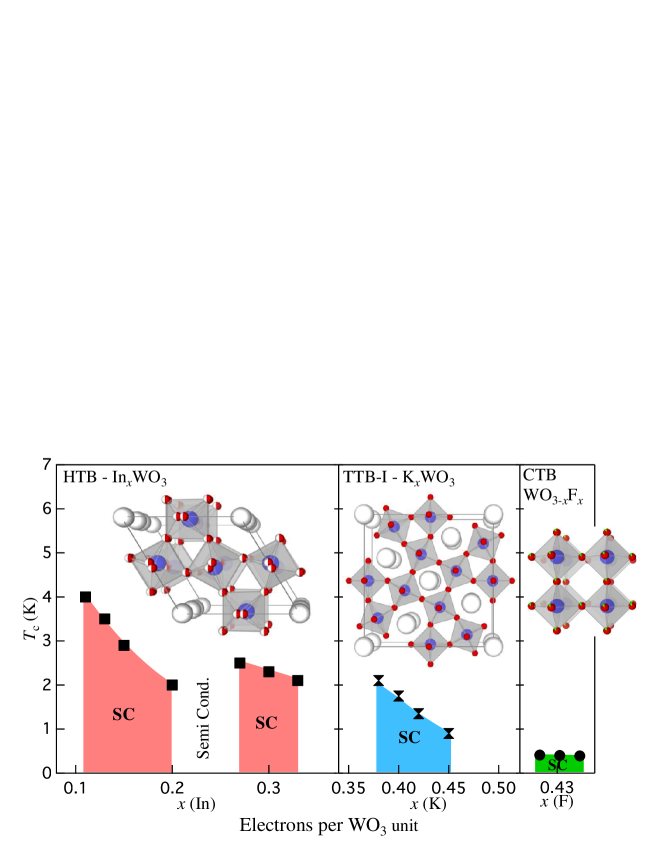
The superconducting parameters for representative HTB, TTB-I and CTB doped tungsten bronzes are presented in Table. 1. Our determined values for the TTB-I phase are employed. The phase diagrams for all the characteristic structure types in the superconducting tungsten bronze family are shown in Fig. 6. The diagram shows that the superconducting s generally decrease with increasing electron doping of the WO3 framework. It also shows that the superconducting transition temperatures are highest at the lowest doping levels for both the HTB and TTB-I systems; the well-known anomaly in the HTB system near = 0.25 is displayed. josh2013 ; cadwell1981 ; 2sweedler1965 Finally, it is seen that at comparable doping levels, the perovskite-based CTB is a significantly worse superconductor than the TTB-I bronze phase. This is one of the few systems known where a direct comparison of perovskite-based and non-perovskite-based structure superconductors is possible at the same electron count; in this case the perovskite is the worse superconductor.
IV Conclusion
We have synthesized and characterized the superconducting properties of the K-doped tungsten bronze with the tetragonal-I structure type. A bulk superconducting transition for the TTB-I phase is confirmed through resistivity and heat capacity measurements of KxWO3. The highest observed is 2.1 K. The electronic contribution to the specific heat is relatively small, = 4.15 and the electron-phonon coupling constant . The electronic density of states calculations indicate that close to the HTB-TTB structural phase boundary, the Fermi Level in the TTB-I phase transitions through a van Hove singularity at ; the highest in the tetragonal-I system is at a correspondingly low doping level. Finally, with this characterization of the TTB-I superconductor, it is now possible to present a complete superconducting phase diagram for the tungsten bronze family. The highest superconducting is observed in general at the lowest electron doping level for the WO3 framework, and also at the lowest doping level for the HTB and TTB-I superconductors individually; it is almost independent of doping for the CTB. The cubic bronze phase is less favored for superconductivity than the tetragonal bronze phase, where the connectivity of the WO6 octahedra is different from what is seen in the perovskite. The data provided suggest that a global theoretical treatment of all the compounds in this family of superconductors would be of interest.
V acknowledgments
This work was supported by the Department of Energy Division of Basic Energy Sciences, grant DE-FG02-98ER45706. NH would like to thank Mazhar N. Ali and T. Klimczuk for useful discussions.
References
- (1) Ch. J. Raub, A. R. Sweedler, M. A. Jensen, S. Broadston, and B. T. Matthias, Phys. Lett. 13, 746 (1964).
- (2) A. R. Sweedler, Ch. J. Raub and B. T. Matthias, Phys. Letters, 15, 108-109 (1965).
- (3) P. J. Wiseman and P. G. Dickens, J. of Solid State Chemistry 6, 374-377 (1973).
- (4) L. H. Cadwell, R. C. Morris and W. G. Moulton, Phy. Rev. B 23, 2219-2223 546 (1989).
- (5) A. R. Sweedler, J. K. Hulm, B. T. Matthias and T. H. Geballe, Physics Letters 19, 82 (1965).
- (6) A. W. Sleight, J. L. Gillson, P. E. Bierstedt, Solid State Comm. 17, 27-28 (1975).
- (7) J. E. Ostenson, H. R. Shanks and D. K. Finnemore, J. of Less-Common Metals, 62, 149-153 (1978).
- (8) Juan Guo, Cheng Dong, Lihong Yang and Hong Chen, Materials Research Bulletin 43, 779-786 (2008).
- (9) C. Kasl and M. J. R. Hoch, J. Mater Sci 48, 3003-3012 (2013).
- (10) E. Banks and A. Goldstein, Inorganic Chemistry 7, 966-969 (1968).
- (11) J. P. Remeika, T. H. Geballe, B. T. Matthias, A. S. Cooper, G. W. Hull and E. M. Kelly, Physics Letters 24A, 565-566 (1967).
- (12) R. Brusetti, P. Bordet, and J. Bossy, Phy. Rev. B 76, 174511 (2007).
- (13) Howard R. Shanks, Solid State Comm. 15, 753—756 (1974).
- (14) J. D. Bocarsly, Daigorou Hirai, M. N. Ali and R. J. Cava, Euro Phys. Lett. 103, 17001 (2013).
- (15) D. Hirai, E. Climent-Pascual and R. J. Cava, Phy. Rev. B 84, 174519 (2011).
- (16) I. R. Shein and A. L. Ivanovskii, JETP Lett. 95, 66-69 (2011).
- (17) K. S. Lee, D. K. Seo and M. H. Whangbo, J. Am. Chem. Soc. 110, 4043-4049 (1997).
- (18) D. M. Sagar, D. Fausti, S. van Smaalen and P. H. M. van Loosdrecht, Phy. Rev. B 81, 045124 (2010).
- (19) B. Ingham, S. C. Hendy, S. V. Chong and J. L. Tallon, Phy. Rev. B 72, 075109 (2005).
- (20) L. C. Ting, H. H. Hsieh, H. H. Kang, D. C. Ling, H. L. Liu, W. F. Pong, F. Z. Chien and P. H. Hor, J. Sup. and Novel Mag. 20, 249-253 (2007).
- (21) M. R. Skokan, W. G. Moulton and R. C. Morris, Phy. Rev. B 20, 3670-3677 (1979).
- (22) R. K. Stanley, R. C. Morris and W. G. Moulton, Phy. Rev. B 20,1903-1913 (1979).
- (23) R. Fan, X. H. Chen, Z. Gui, Z. Sun, S. Y. Li and Z. Y. Chen, J. of Phy. and Chem. of Solids 61, 2029-2033 (2000).
- (24) L. C. Ting, J. J. Pan, T. W. Liao, H. H. Hsieh, F. Z. Chien, P. H. Hor and D. C. Ling, Chinese Journal of Physics 45, 237-244 (2007).
- (25) F. Wang, C. Di Valentin and G. Pcchioni, Phy. Riv. B 84, 073103 (2011).
- (26) S. A. Reisinger, M. Lablanc, A. M. Mercier, C. C. Tang, J. E. Parker, F. D. Morrison and P. Lightfoot, Chem. of Materials 23, 5440-5445 (2011).
- (27) K. R. Dey, C. H. Ruscher, Th. M. Gesing and A. Husain, Mat. Res. Bul. 42, 591-599 (2007).
- (28) M. J. Sienko and S. M. Morehouse, Inorganic Chemistry 02, 485-489 (1963).
- (29) S. Paul, G. D. Mukherjee, A. Ghosh, S. Oishi and S. Raj, Applied Physics Letter 98, 121910 (2011).
- (30) A. D. Walkingshaw, N. A. Spaldin and E. Artacho, Phy. Rev. B 98, 165110 (2004).
- (31) J. Rodriguez-Carvajal and T. Roisnel, FULLPROF, WWINPLOTR, and accompanying programs, (2008) .
- (32) H. Rietveld, Journal of Applied Crystallography 2, (2) 65-71 (1969).
- (33) B. W. Brown and E. Banks, J. Am. Chem. Soc. 76, 963 (1954).
- (34) Charles Kittel, Introduction to Solid State Physics, Seventh Edition, John Wiley and Sons, Inc. New York (1996)
- (35) P. Blaha, K. Schwarz, G. Madsen, D. Kvasnicka and J. Luitz, WIEN2k, An Augmented Plane Wave Local Orbitals Program for calculating Crystal Properties, Technische Universitat Wien, Austria, (2001).
- (36) D. J. Singh, L. Nordstrom, Planewaves, Pseudopotentials, and the LAPW Method, Springer, New York, 2nd ed. (1996).
- (37) G. K. H. Madsen, P. Blaha, K. Schwarz, E. Sjostedt, L. Nordstrom, Efficient linearization of the augmented plane-wave method, Phys. Rev. B 64 19, 195134 (2001).
- (38) E. Sjostedt, L. Nordstrom, D. J. Singh, An alternative way of linearizing the augmented plane-wave method, Solid State Communications 11415-20 (2000).
- (39) J. P. Perdew, K. Burke and M. Ernzerhof, Phys Rev Lett. 77, 3865 (1996).
- (40) N. R. Werthamer, E. Helfand and P. C. Hohenberg, Phys. Rev. 147, 295 (1966).
- (41) A. M. Clogston, Phys. Rev. Lett. 09, 266 (1962).
- (42) H. Padamsee, J. E. Neighbor, and C. A. Shiffman, J. Low Temp. Phys. 12, 387 (1973).
- (43) L. Kopp, H. N. Harmon, , S. H. Liu, Solid State Commun. 22, 677 (1977).
- (44) F. C. Zumsteg, Phys. Rev. B 14, 1406 (1976).
- (45) A. J. Bevolo, H. R. Shanks, P. H. Sidles and C. G. Danielson, Phys. Rev. B 9, 3220-3229 (1974).
- (46) W. L. McMillan, Phys. Rev. 167, 331 (1968).
- (47) Handbook of Superconductivity, edited by C. P. Poole Jr. (Academic Press, New York, 1999), Chap. 9, Sec. G, p. 478.
- (48) A. C. Jacko, J. O. Fjaerestad and B. J. Powell, Nature Physics 5, 422 (2009).
- (49) K. G. Wilson, Rev. Mod. Phys. 47, 773 (1975).
- (50) K. Yamada, Prog. Theor. Phys. 53, 970 (1975).
- (51) A. B. Karki, Y. M. Xiong, N. Haldolaarachchige, W. A. Phelan, Julia Y. Chan, S. Stadler, I. Vekhter, P. W. Adams, and D. P. Young, Phy. Rev. B, 83, 144525 (2011).
- (52) J. E. Hirsch and D. J. Scalapino, Phys. Rev. Lett. 56, 2732-2735 (1986).
- (53) I. E. Dzaloshinskii, Zh.Eksp. Teor. Fiz. 93, 1487 (1987).
- (54) C. Felser, K. Thieme, and R. Seshadri, J. Mat. Chem. 9, 451 (1999).
- (55) C. Felser, J. Alloys Comp. 262, 87 (1997).