Constraints on the synchrotron self-Compton mechanism of TeV gamma ray emission from the Milagro TeV source MGRO J2019+37 within the pulsar wind nebula scenario
Abstract
Origin of the TeV gamma ray emission from MGRO J2019+37 discovered by the Milagro experiment is investigated within the pulsar wind nebula (PWN) scenario using multiwavelength information on sources suggested to be associated with this object. We find that the synchrotron self-Compton (SSC) mechanism of origin of the observed TeV gamma rays within the PWN scenario is severely constrained by the upper limit on the radio flux from the region around MGRO J2019+37 given by the Giant Metrewave Radio Telescope (GMRT) as well as by the x-ray flux upper limit from SWIFT/XRT. Specifically, for the SSC mechanism to explain the observed TeV flux from MGRO J2019+37 without violating the GMRT and/or Swift/XRT flux upper limits in the radio and x-ray regions, respectively, the emission region must be extremely compact with the characteristic size of the emission region restricted to for an assumed distance of few kpc to the source. This is at least four orders of magnitude less than the characteristic size of the emission region typically invoked in explaining the TeV emission through the SSC mechanism within the PWN scenario. On the other hand, inverse Compton (IC) scattering of the nebular high energy electrons on the cosmic microwave background (CMB) photons can, for reasonable ranges of values of various parameters, explain the observed TeV flux without violating the GMRT and/or SWIFT/XRT flux bounds.
keywords:
Atmospheric Cherenkov Technique, Extensive air shower simulations, -ray astronomy1 Introduction
The Cygnus region of the Galaxy hosts a number of extended, unidentified sources of TeV -ray emission, the most prominent of which is MGRO J2019+37 discovered by the Milagro experiment [1, 2]. Detailed analysis [3] of the observational data on this object collected during the period 2005–2008 gives a detection of this source with a statistical significance in excess of between 1 and 100 TeV. The measured flux [3] from this source is (with a systematic uncertainty) at 10 TeV with a spectrum that is best described by a power-law with a spectral index of (with a systematic uncertainty of ) and an exponential cutoff at an energy .
Although no confirmed counterparts of the TeV source MGRO J2019+37 at lower energies are known, several possible associations with other observed sources have been suggested. The emission from MGRO J2019+37 may be due to either a single extended source or several unresolved sources. The EGRET sources 3EG J2021+3716 and 3EG J2016+3657 are positionally close to MGRO J2019+37, and thus could be the GeV counterparts of MGRO J2019+37 if it is a multiple source. At the same time, the EGRET source 3EG J2021+3716 is suggested to be associated with the radio and GeV pulsar PSR J2021+3651 (and its associated pulsar wind nebula PWN G75.2+0.1 [4, 5]) observed at GeV energies by AGILE (AGL J2020.5+3653) [6] as well as FERMI (2FGL J2021.0+3651) [7]. A SWIFT/XRT observation [8] was also done within the positional uncertainty region of MGRO J2019+37 reported in [1, 2] and three x-ray sources were reported in the region with a total x-ray flux corresponding to in the 2–10 keV energy region, which can, therefore, be taken as an upper limit on the possible x-ray flux from any x-ray counterpart of MGRO J2019+37 in this energy region. In addition, a wide-field deep radio survey of the MGRO J2019+37 region at 610 MHz was made by the Giant Metrewave Radio Telescope (GMRT) [9], yielding no detectable radio source, thus giving a conservative upper limit of 1.0 mJy on the radio flux from any point-like radio counterpart of MGRO J2019+37. Recently, a deep very high energy (VHE) observation by the VERITAS experiment [10] has resolved the VHE emission from the region of MGRO J2019+37 into two VHE sources. One of these, namely, VER J2019+378, which is also positionally coincident with the energetic GeV pulsar PSR J2021+3651 and its PWN, has been suggested to be associated with the bulk of the TeV emission from MGRO J2019+37.
In this paper, we study the implications of a scenario in which the observed TeV -ray emission from MGRO J2019+37 arises from a Pulsar Wind Nebula (PWN) type source. Pulsar Wind Nebulae (PWNe) (see, e.g., [11] for a review), a well-known example of which is the Crab Nebula (see [12] for a review), are known to be sources of very high energy gamma rays extending to TeV energies (see, e.g., [13, 14] for reviews). The TeV photons are thought to be emitted mainly through (a) inverse Compton (IC) interaction of high energy electrons with the low energy synchrotron photons emitted by the electrons themselves in the ambient magnetic field in the nebula — the so-called synchrotron self-Compton (SSC) mechanism, and/or (b) IC interaction with the photons constituting the cosmic microwave background (CMB) and infrared background — hereafter referred to as the “IC-CMB” mechanism. The high energy electrons themselves are thought to be accelerated in the wind termination shock where the relativistic wind from the pulsar residing within the nebula is stopped by the nebular material. In principle, in addition to electrons high energy protons (and in general heavier nuclei) may be also accelerated [15, 16, 17, 18], which can produce high energy photons through decay of neutral pions produced in inelastic - collisions. In this paper we shall restrict our attention to the leptonic scenario, i.e., we assume that the TeV emission is due to electrons. We use multiwavelength data and flux upper limits from observations in the region around MGRO J2019+37 including the radio upper limit given by GMRT [9], x-ray flux upper limit from SWIFT/XRT observations [8], GeV observations by FERMI [7], EGRET [19] and AGILE [6] and the TeV data from Milagro [1, 2, 3] and VERITAS [10] to study the implications of both the SSC and IC-CMB mechanisms for the macroscopic parameters of the underlying PWN, namely, its energetics (e.g., the total energy contained in the high energy electrons), the characteristic size of the emission region and the ambient magnetic field within the nebula.
We find that the SSC mechanism of origin of the observed TeV gamma rays from MGRO J2019+37 is severely constrained by the GMRT upper limit on the radio flux from the region around MGRO J2019+37 as well as by the SWIFT/XRT x-ray flux upper limit. Specifically, for the SSC mechanism to explain the observed TeV flux from MGRO J2019+37 without violating the GMRT and/or Swift/XRT flux upper limits, the emission region within the PWN must be extremely compact with the characteristic size of the emission region restricted to for an assumed distance of few kpc to the source. This is at least four orders of magnitude less than the characteristic size of the emission region typically invoked in explaining the TeV emission through the SSC mechanism within the PWN scenario. On the other hand, the IC-CMB mechanism can, for reasonable ranges of values of various parameters, explain the observed TeV flux without violating the GMRT and/or SWIFT/XRT flux bounds.
The reason for the upper limit on the size of the emission region in the SSC scenario is not hard to understand: Ignoring for the moment the details of the energy spectrum of the electrons, let denote the number density of the electrons and the characteristic radius of the (assumed spherical) emission region in the source. Recall that in the SSC mechanism the TeV photons are produced through IC interaction of the nebular high energy electrons with the synchrotron photons produced by the electrons themselves in the magnetic field in the nebular region. Since the number density of the synchrotron photons scales as , the number density of the TeV photons produced by the electrons through the SSC mechanism roughly scales as . Thus, for a given distance to the source, the emerging total TeV flux from the source scales as . The requirement of producing the observed TeV flux of MGRO J2019+37, therefore, fixes the product . On the other hand, the photon fluxes in the radio and x-ray regions due to synchrotron emission by the electrons scale with the product . Therefore, with the product fixed by the observed TeV flux of MGRO J2019+37, an upper limit on the radio flux given by GMRT or the x-ray flux given by SWIFT/XRT directly yields an upper limit on . These arguments are elaborated upon more quantitatively in the following sections within the context of a simple power-law form of the energy spectrum of the electrons within the nebula.
The rest of the paper is organized as follows: First, in Section 2 we set up the formulae to calculate the multiwavelength photon spectra and compare the resulting theoretically calculated multiwavelength photon spectra with the observed multiwavelength data and constraints pertaining to MGRO J2019+37, and discuss the implications — in particular the constraints on the characteristic size of the emission region — for the SSC mechanism of production of the observed TeV flux from MGRO J2019+37. Finally, we summarize our results and conclude in Section 3.
2 Multiwavelength photon spectra and constraints
For simplicity we shall assume a simple power-law form (with a high energy cutoff) of the energy spectrum of the high energy electrons within the system, namely,
| (1) |
where denotes the number density of the electrons, is the Lorentz factor of the electron, and , and are parameters of the model.
In general, the electron spectrum may be more complicated than the single power-law form assumed above. However, from the discussions given below it will be clear that the qualitative natures of the interrelationships between and constraints on the macroscopic parameters of the system we derive below are quite general and are independent of the exact form of the electron spectrum.
It is clear that, unlike in the cases of well-studied specific PWNe such as the Crab Nebula for which the existence of detailed multiwavelength data allows one to determine the parameters of the underlying model by performing detailed spectral fits to observational data (see, e.g., [20] in the case of the Crab nebula), it is not practical or even meaningful to attempt to “determine” the parameters appearing in equation (1) in the case of MGRO J2019+37 because of lack of such multiwavelength observational data. Instead, we shall focus on the plausible ranges of values of the most relevant parameters of the system by requiring that the resulting multiwavelength photon spectra be such as to be able to explain the observed TeV flux from MGRO J2019+37 without violating the upper limits on the x-ray and radio fluxes from the region around the object.
For a given set of the electron parameters in (1), the total energy contained in the electrons, , can be expressed as
| (2) |
where is the radius of the (assumed) spherical region within which the electrons are assumed to be distributed uniformly, and is a calculable function of the set of parameters .
Now, the energy spectrum of synchrotron photons produced by an electron of energy with a pitch angle in a magnetic field can be written as [21]
| (3) |
where is the electron charge,
| (4) |
is the characteristic frequency of the emitted synchrotron radiation, and is the modified Bessel function of fractional order 5/3. In our calculations described below, we shall average over the electron pitch angle and adopt a value of [20].
For simplicity, we shall work within the framework of the so-called “constant B-field” scenario [22, 20] and assume the magnetic field to be constant within the nebular region.
Thus, for a source (assumed to be in steady state and emitting radiation isotropically) at a distance , the synchrotron radiation flux (energy/area/time/frequency) at frequency at earth can be written as
| (5) | |||||
where we have used equations (3), (1) and (2) in the second line and written the equation in a suggestive form by extracting the explicit dependence on dimensionful quantities thus making a numerically calculable dimensionless function of the indicated parameters. (Note that the combination has the dimension of energy squared.)
Similarly, the energy spectrum of photons produced by an electron of energy due to IC scattering off a background of soft photons is given by [21]
| (6) | |||||
where is the Thomson cross section, is photon energy after scattering, is the number density of the background soft photons between energy and , and
with
For the synchrotron self-Compton (SSC) process the target photons for the IC interaction of the high energy electrons are the synchrotron photons produced by the electrons themselves. As already mentioned in the Introduction, since the number density of these synchrotron photons scales with the electron number density, the SSC luminosity from the source will scale with the square of the electron number density. Thus, the total SSC flux at earth can be written as
| (7) | |||||
where again we have used equations (1), (2) and (6) (with target photon density in equation (6) replaced by the synchrotron photon density which scales with ), and is another numerically calculable dimensionless function of the indicated parameters. Note the explicit dependence of on , the radius of the emission region.
Finally, for IC interaction on the universal CMB photons, with in equation (6) replaced by
| (8) |
with K, the IC-CMB flux at earth can be written as
| (9) |
where is again a numerically calculable dimensionless function.
Equations (5), (7) and (9) allow us to generate the multiwavelength spectra for our model of the MGRO J2019+37 for any chosen set of values of the various parameters involved. For a given source distance and the set of electron parameters , there are three macroscopic parameters that control the multiwavelength spectra of the system, namely, the total energy contained in the electrons (), the magnetic field () and the radius of the emission region (). For judicious choices of values of these parameters, one can obtain multiwavelength spectra for our model of MGRO J2019+37 that provide reasonably good fit to the observed TeV data without violating the GMRT and SWIFT/XRT constraints. We shall discuss such multiwavelength spectra below. However, even without considering the full numerically generated multiwavelength spectra, we can see that within the context of the SSC mechanism of explaining the observed TeV data of MGRO J2019+37, the GMRT and SWIFT/XRT flux upper limits impose an upper limit on the radius of the emission region, . This can be simply seen as follows:
2.1 Upper limit on in the SSC scenario
For an appropriate choice of the values of the magnetic field and the parameter set , requiring that we be able to explain the observed TeV flux from MGRO J2019+37 at some energy, say, 10 TeV, by the SSC flux (7), we get
| (10) |
where is the observed flux from MGRO J2019+37 at 10 TeV. But, at the same time, we must ensure that, for the same values of and the parameter set , the synchrotron flux given by equation (5) at not exceed the radio flux upper limit given by GMRT [9], , from the region around the observed position of MGRO J2019+37. This gives the condition
which, upon substituting for from equation (10), gives an upper limit on :
| (11) | |||||
Similarly, one can derive an upper limit on from the SWIFT/XRT x-ray flux upper limit. The actual value of the upper limit on will be the lower of the two upper limits.
Clearly, the upper limit on depends on the electron parameters, the magnetic field and on the distance to the source. Below we shall present the results of our detailed numerical calculations for various values of the parameters involved. However, rough estimates of the upper limit on can be obtained simply by comparing the observed TeV flux of MGRO J2019+37 and the GMRT (SWIFT/XRT) upper limit on its radio (x-ray) flux with the observed TeV and radio (x-ray) fluxes, respectively, of a known PWN system such as the Crab nebula, for example. Let us define the ratio
| (12) |
where and are given by equations (5) and (7), respectively. Let us demand that the measured TeV flux of both Crab and MGRO J2019+37 be explained by the SSC process. Then, for a given set of the electrons’ spectral parameters and magnetic field , assumed same for the moment for both Crab and MGRO J2019+37, it is easy to see, using equations (12), (5), (7) and (10), that
| (13) |
where the sub(super)scripts Crab and MGRO refer to quantities relevant to Crab and MGRO J2019+37, respectively.
From the observed multiwavelength spectral energy distribution of the Crab (see, e.g., [20] for a compilation of the data; also see the Figures below) it can be seen that Crab emits comparable amount of energy at TeV and radio wavelengths, with and . In contrast, for MGRO J2019+37, while the energy emitted at TeV energies is comparable with that for Crab, with , the GMRT upper limit restricts the possible flux of MGRO J2019+37 in the radio region to , about 6 orders of magnitude less than the corresponding quantity for Crab at that frequency. Thus we have and , whereas .
Using these numbers in equation (13) we get the constraint
| (14) |
The distance to MGRO J2019+37 is not precisely known. The radio and GeV pulsar PSR J2021+3651 with its associated pulsar wind nebula PWN G75.2+0.1 [4, 5, 6, 7] that has been suggested to be associated with MGRO J2019+37 is inferred to be at a distance of 3–4 kpc [23]. Below, for our numerical calculations, we shall take . For the Crab nebula we shall take and [20]. With these numbers, we get
| (15) |
Similarly one can derive a rough estimate of the upper limit on using the SWIFT/XRT flux upper limit.
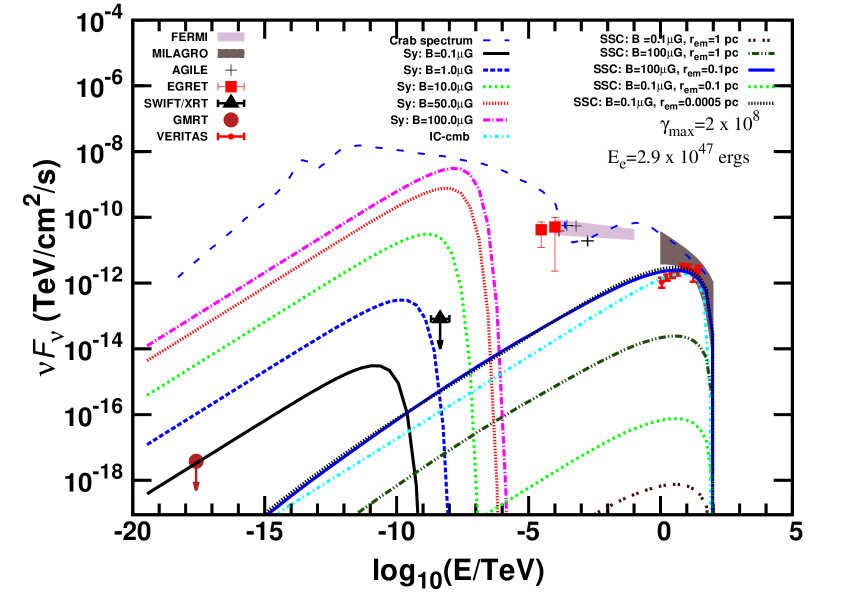
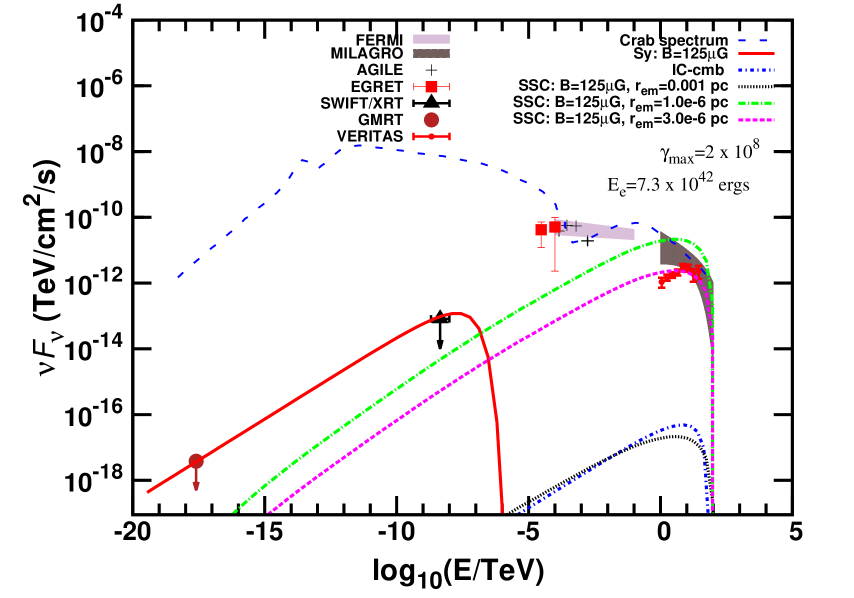
These upper limit values indicate that if the spectral parameters of the electron population and the magnetic field of MGRO J2019+37 are same as those of the Crab nebula, then within the context of the SSC mechanism of production of TeV photons, the MGRO J2019+37 has to be a significantly more compact source than the Crab. Of course, the electron parameters and the magnetic field inside MGRO J2019+37 have no reason to be same as those in Crab. However, this does not alter the above general inference on the compactness of the source, the main reason for which is the strong constraint (upper limits) on the possible radio and x-ray fluxes from MGRO J2019+37 imposed by the GMRT and the SWIFT/XRT observations, respectively. To demonstrate this, we have generated a large set of multiwavelength spectra for our model of MGRO J2019+37 for a wide range of values of the parameters , and and electron parameters both for the SSC as well as IC-CMB mechanisms of production of TeV energy photons111We have included the contribution from IC scattering of the electrons with the interstellar radiation field (ISRF) (taken from Ref. [24]) in addition to the CMB within the “IC-CMB” contribution in our numerical calculations.. Samples of such multiwavelength spectra are shown in Figures 1 and 2 for illustrating our main results. In these Figures the electron spectrum parameters have been taken to be and (corresponding to exponential cutoff energy of the electron spectrum at 100 TeV); our basic results and conclusions do not change for other reasonable values of these parameters.
To set the scale for the possible ranges of values of the parameters , and for our numerical calculations, we note the typical values of these parameters invoked in explaining the multiwavelength emission from the Crab nebula, namely, , G and (see, e.g., [20]). We, however, keep in mind that the Crab is one of the most powerful PWNe, and the values of the above parameters for the MGRO J2019+37 may be quite different from those for the Crab. Indeed, as we see from the Figures shown below, the values of these parameters required to explain the observed TeV data maintaining consistency with GMRT and SWIFT/XRT flux upper limits are rather different from those invoked for the Crab.
From Figure 1 we see that for a value of , which is about 5% of mentioned above, the GMRT and the SWIFT/XRT flux upper limits restrict the magnetic field within MGRO J2019+37 to below G, three orders of magnitude lower than mentioned above. For larger values of , the magnetic field has to be even lower. However, for G, we require a value of (compared to ) to explain the observed TeV data of MGRO J2019+37 with the SSC mechanism. The physical reason for this is that, for the chosen value of , with a value of as low as G the target synchrotron photon density is not large enough to produce the observed TeV flux through the SSC mechanism unless the size of the emission region is sufficiently small. Note that, for the same value of , a magnetic field of G can explain the TeV flux with a value of , but such a large value of produces synchrotron flux that violates the GMRT and SWIFT/XRT upper limits. Note also that, with the above value of the IC-CMB mechanism can well explain the observed TeV flux.
In general, for consistency with the GMRT and SWIFT/XRT flux upper limits, larger values of magnetic field require smaller values of the total energy contained in electrons, . For example, as shown in Figure 2, a magnetic field of G will produce synchrotron flux consistent with GMRT and SWIFT/XRT upper limits only for , a value about six orders of magnitude lower than . However, for such a low value of , the target synchrotron photon density is again not large enough to produce the observed TeV flux through the SSC mechanism unless the emission region is sufficiently compact with . Note further that with such a low value of , the IC-CMB mechanism is unable to explain the observed TeV flux.
In the above discussions we have made the simplifying assumption of the electrons — and consequently the photons generated by them — being uniformly distributed within a spherical “emission region” of radius within the nebula. More realistically, the radius may be considered as a kind of characteristic length scale of a possible non-uniform spatial distribution of the electrons and/or the photons generated by them [20, 22]. Also, the magnetic field inside the nebula is likely to be not spatially constant, but rather varying with a characteristic length scale similar to . These details, however, are unlikely to change the general conclusion regarding the extreme compactness of the emission region of MGRO J2019+37 in the case of SSC mechanism of production of the observed TeV emission from MGRO J2019+37 within the context of the general PWN model of the source.
3 Summary and conclusions
To summarize, in this paper we have considered a PWN scenario of the origin of the observed TeV gamma ray emission from MGRO J2019+37. We find that, while no lower energy counterparts of this object have yet been identified, the upper limits on possible radio and x-ray emissions from the source provided by the GMRT and SWIFT/XRT, respectively, already imply that the observed TeV emission of MGRO J2019+37 must originate from a highly compact region with characteristic size of the emission region if the observed TeV flux from MGRO J2019+37 is dominantly produced by the SSC mechanism. Such a compact size of the emission region is difficult to envisage within the usual PWN scenario. On the other hand, IC scattering of the high energy electrons on the CMB photons can explain the observed TeV flux without violating the radio and x-ray flux upper limits given by GMRT and SWIFT/XRT, respectively, for reasonable ranges of values of various relevant parameters.
References
References
- [1] A. A. Abdo, B. Allen, D. Berley, E. Blaufuss, S. Casanova, C. Chen, D. G. Coyne, R. S. Delay, B. L. Dingus, R. W. Ellsworth, L. Fleysher, R. Fleysher, I. Gebauer, M. M. Gonzalez, J. A. Goodman, E. Hays, C. M. Hoffman, B. E. Kolterman, L. A. Kelley, C. P. Lansdell, J. T. Linnemann, J. E. McEnery, A. I. Mincer, I. V. Moskalenko, P. Nemethy, D. Noyes, J. M. Ryan, F. W. Samuelson, P. M. Saz Parkinson, M. Schneider, A. Shoup, G. Sinnis, A. J. Smith, A. W. Strong, G. W. Sullivan, V. Vasileiou, G. P. Walker, D. A. Williams, X. W. Xu, G. B. Yodh, Discovery of TeV Gamma-Ray Emission from the Cygnus Region of the Galaxy, ApJL 658 (2007) L33–L36. arXiv:astro-ph/0611691, doi:10.1086/513696.
- [2] A. A. Abdo, B. Allen, D. Berley, S. Casanova, et al., TeV Gamma-Ray Sources from a Survey of the Galactic Plane with Milagro, ApJL 664 (2007) L91–L94. arXiv:0705.0707, doi:10.1086/520717.
- [3] A. A. Abdo, U. Abeysekara, B. T. Allen, T. Aune, D. Berley, E. Bonamente, G. E. Christopher, T. DeYoung, B. L. Dingus, R. W. Ellsworth, J. G. Galbraith-Frew, M. M. Gonzalez, J. A. Goodman, C. M. Hoffman, P. H. Hüntemeyer, C. M. Hui, B. E. Kolterman, J. T. Linnemann, J. E. McEnery, A. I. Mincer, T. Morgan, P. Nemethy, J. Pretz, J. M. Ryan, P. M. Saz Parkinson, A. Shoup, G. Sinnis, A. J. Smith, V. Vasileiou, G. P. Walker, D. A. Williams, G. B. Yodh, Spectrum and Morphology of the Two Brightest Milagro Sources in the Cygnus Region: MGRO J2019+37 and MGRO J2031+41, ApJ 753 (2012) 159. arXiv:1202.0846, doi:10.1088/0004-637X/753/2/159.
- [4] M. S. E. Roberts, J. W. T. Hessels, S. M. Ransom, V. M. Kaspi, P. C. C. Freire, F. Crawford, D. R. Lorimer, PSR J2021+3651: A Young Radio Pulsar Coincident with an Unidentified EGRET -Ray Source, ApJL 577 (2002) L19–L22. arXiv:astro-ph/0206443, doi:10.1086/344082.
- [5] J. W. T. Hessels, M. S. E. Roberts, S. M. Ransom, V. M. Kaspi, R. W. Romani, C.-Y. Ng, P. C. C. Freire, B. M. Gaensler, Observations of PSR J2021+3651 and its X-Ray Pulsar Wind Nebula G75.2+0.1, ApJ 612 (2004) 389–397. arXiv:astro-ph/0403632, doi:10.1086/422408.
- [6] J. P. Halpern, F. Camilo, A. Giuliani, E. V. Gotthelf, M. A. McLaughlin, R. Mukherjee, A. Pellizzoni, S. M. Ransom, M. S. E. Roberts, M. Tavani, Discovery of High-Energy Gamma-Ray Pulsations from PSR J2021+3651 with AGILE, ApJL 688 (2008) L33–L36. arXiv:0810.0008, doi:10.1086/594117.
- [7] A. A. Abdo, M. Ackermann, M. Ajello, W. B. Atwood, M. Axelsson, L. Baldini, J. Ballet, D. L. Band, G. Barbiellini, D. Bastieri, et al., Fermi/Large Area Telescope Bright Gamma-Ray Source List, ApJS 183 (2009) 46–66. arXiv:0902.1340, doi:10.1088/0067-0049/183/1/46.
-
[8]
R. Landi, L. Bassani, A. Bazzano, A. de Rosa, A. J. Dean, A. J.
Bird, N. Gehrels, J. A. Kennea, M. Perri,
Swift/XRT observation
of MGRO J2019+37, The Astronomer’s Telegram 1097 (2007) 1.
URL http://www.astronomerstelegram.org/?read=1097 - [9] J. M. Paredes, J. Martí, C. H. Ishwara-Chandra, J. R. Sánchez-Sutil, A. J. Muñoz-Arjonilla, J. Moldón, M. Peracaula, P. L. Luque-Escamilla, V. Zabalza, V. Bosch-Ramon, P. Bordas, G. E. Romero, M. Ribó, Radio continuum and near-infrared study of the MGRO J2019+37 region, A&A 507 (2009) 241–250. arXiv:0909.0406, doi:10.1051/0004-6361/200912448.
-
[10]
E. Aliu, T. Aune, B. Behera, M. Beilicke, W. Benbow, K. Berger, et al.,
Spatially Resolving the
Very High Energy Emission from MGRO J2019+37 with VERITAS, ApJ 788 (1)
(2014) 78.
URL http://stacks.iop.org/0004-637X/788/i=1/a=78 - [11] B. M. Gaensler, P. O. Slane, The Evolution and Structure of Pulsar Wind Nebulae, ARAA 44 (2006) 17–47. arXiv:astro-ph/0601081, doi:10.1146/annurev.astro.44.051905.092528.
- [12] J. J. Hester, The Crab Nebula: An Astrophysical Chimera, ARAA 46 (2008) 127–155. doi:10.1146/annurev.astro.45.051806.110608.
- [13] F. Aharonian, Very High Energy Cosmic Gamma Radiation: A crucial window on the extreme universe, World Scientific, Singapore, 2004.
- [14] O. Kargaltsev, G. G. Pavlov, M. Durant, Pulsar Wind Nebulae from X-rays to VHE -rays, in: W. Lewandowski, O. Maron, J. Kijak (Eds.), Electromagnetic Radiation from Pulsars and Magnetars, Vol. 466 of ASP Conf. Ser., 2012, p. 167. arXiv:1207.1681.
- [15] A. M. Atoyan, F. A. Aharonian, On the mechanisms of gamma radiation in the Crab Nebula, MNRAS 278 (1996) 525–541.
- [16] W. Bednarek, R. J. Protheroe, Gamma Rays and Neutrinos from the Crab Nebula Produced by Pulsar Accelerated Nuclei, PRL 79 (1997) 2616–2619. arXiv:astro-ph/9704186, doi:10.1103/PhysRevLett.79.2616.
- [17] E. Amato, D. Guetta, P. Blasi, Signatures of high energy protons in pulsar winds, A&A 402 (2003) 827–836. arXiv:astro-ph/0302121, doi:10.1051/0004-6361:20030279.
- [18] W. Bednarek, M. Bartosik, Gamma-rays from the pulsar wind nebulae, A&A 405 (2003) 689–702. arXiv:astro-ph/0304049, doi:10.1051/0004-6361:20030593.
- [19] R. C. Hartman, D. L. Bertsch, S. D. Bloom, A. W. Chen, P. Deines-Jones, J. A. Esposito, C. E. Fichtel, D. P. Friedlander, S. D. Hunter, L. M. McDonald, P. Sreekumar, D. J. Thompson, B. B. Jones, Y. C. Lin, P. F. Michelson, P. L. Nolan, W. F. Tompkins, G. Kanbach, H. A. Mayer-Hasselwander, A. Mücke, M. Pohl, O. Reimer, D. A. Kniffen, E. J. Schneid, C. von Montigny, R. Mukherjee, B. L. Dingus, The Third EGRET Catalog of High-Energy Gamma-Ray Sources, ApJS 123 (1999) 79–202. doi:10.1086/313231.
- [20] M. Meyer, D. Horns, H.-S. Zechlin, The Crab Nebula as a standard candle in very high-energy astrophysics, A&A 523 (2010) A2. arXiv:1008.4524, doi:10.1051/0004-6361/201014108.
- [21] G. R. Blumenthal, R. J. Gould, Bremsstrahlung, Synchrotron Radiation, and Compton Scattering of High-Energy Electrons Traversing Dilute Gases, RMP 42 (1970) 237–271. doi:10.1103/RevModPhys.42.237.
- [22] A. M. Hillas, C. W. Akerlof, S. D. Biller, J. H. Buckley, D. A. Carter-Lewis, M. Catanese, M. F. Cawley, D. J. Fegan, J. P. Finley, J. A. Gaidos, F. Krennrich, R. C. Lamb, M. J. Lang, G. Mohanty, M. Punch, P. T. Reynolds, A. J. Rodgers, H. J. Rose, A. C. Rovero, M. S. Schubnell, G. H. Sembroski, G. Vacanti, T. C. Weekes, M. West, J. Zweerink, The Spectrum of TeV Gamma Rays from the Crab Nebula, ApJ 503 (1998) 744. doi:10.1086/306005.
- [23] A. Van Etten, R. W. Romani, C.-Y. Ng, Rings and Jets around PSR J2021+3651: The “Dragonfly Nebula”, ApJ 680 (2008) 1417–1425. arXiv:0802.3707, doi:10.1086/587865.
- [24] J. S. Mathis, P. G. Mezger, N. Panagia, Interstellar radiation field and dust temperatures in the diffuse interstellar matter and in giant molecular clouds, A&A 128 (1983) 212–229.
 |
 |