Decay-assisted collinear resonance ionization spectroscopy:
Application to neutron-deficient francium
Abstract
This paper reports on the hyperfine-structure and radioactive-decay studies of the neutron-deficient francium isotopes 202-206Fr performed with the Collinear Resonance Ionization Spectroscopy (CRIS) experiment at the ISOLDE facility, CERN. The high resolution innate to collinear laser spectroscopy is combined with the high efficiency of ion detection to provide a highly-sensitive technique to probe the hyperfine structure of exotic isotopes. The technique of decay-assisted laser spectroscopy is presented, whereby the isomeric ion beam is deflected to a decay spectroscopy station for alpha-decay tagging of the hyperfine components. Here, we present the first hyperfine-structure measurements of the neutron-deficient francium isotopes 202-206Fr, in addition to the identification of the low-lying states of 202,204Fr performed at the CRIS experiment.
I Introduction
Recent advances in high-resolution laser spectroscopy have resulted in the ability to measure short-lived isotopes with yields of less than 100 atoms per second Cheal and Flanagan (2010); Blaum et al. (2013). The Collinear Resonance Ionization Spectroscopy (CRIS) experiment Procter and Flanagan (2013), located at the ISOLDE facility, CERN, aims to push the limits of laser spectroscopy further, performing hyperfine-structure measurements on isotopes at the edges of the nuclear landscape. It provides a combination of high-detection efficiency, high resolution and ultra-low background, allowing measurements to be performed on isotopes with yields below, in principle, one atom per second.
The first optical measurements of francium were performed in 1978. Liberman identified the 7s 2S 7p 2P3/2 atomic transition, performing hyperfine-structure and isotope-shift measurements first with low-resolution Liberman et al. (1978) and later with high-resolution laser spectroscopy Liberman et al. (1980). The wavelength of this transition (D2) = 717.97(1) nm was in excellent agreement with the prediction of Yagoda Yagoda (1932), made in 1932 before francium was discovered. Further measurements of francium followed in the next decade. High-resolution optical measurements were performed on both the 7s 2S 7p 2P3/2 atomic transition Coc et al. (1985); Touchard et al. (1984); Bauche et al. (1986), as well as the 7s 2S 8p 2P3/2 transition Duong et al. (1987), along with transitions into high-lying Rydberg states Andreev et al. (1987). The CRIS technique, a combination of collinear laser spectroscopy and resonance ionization was originally proposed by Kudriavtsev in 1982 Kudriavtsev and Letokhov (1982), but the only experimental realization of the technique was not performed until 1991 on ytterbium atoms Schulz et al. (1991).
The ability to study the neutron-deficient francium (Z = 87) isotopes at the CRIS beam line offers the unique opportunity to answer questions arising from the study of the nuclear structure in this region of the nuclear chart. As the isotopes above the Z = 82 shell closure become more neutron deficient, a decrease in the excitation energy of the (1i13/2), (2f7/2), (1i13/2) and (3s) states is observed. In 185Bi (Z = 83) and 195At (Z = 85), the (3s) deformed intruder state has been observed to be the ground state Davids et al. (1996); Kettunen et al. (2003).
Recent radioactive-decay measurements suggest the existence of a (3s) proton intruder state for 203Fr and, with a lower excitation energy, for 201Fr, suggesting that this state may become the ground state in 199Fr Uusitalo et al. (2005); Jakobsson et al. (2012). The intruder configurations polarize the nucleus, creating significant deformation. From the study of the nuclear structure of the neutron-deficient francium isotopes towards 199Fr (by measuring the magnetic dipole moments and change in mean-square charge radii of the ground and isomeric states), the quantum configuration of the states and the shape of the nuclei can be investigated.
Radioactive-decay measurements on the neutron-deficient francium isotopes have aimed to determine the level structure of the low-lying nuclear states, but their exact nature is still unknown Huyse et al. (1992); Uusitalo et al. (2005); Jakobsson et al. (2012, 2013). High-resolution collinear laser spectroscopy has allowed determination of the ground-state properties of 204,205,206Fr Voss et al. (2013), confirming the tentative spin assignments. The spin of 205Fr was measured to be 9/2-, the ground-state spins of 204,206Fr were confirmed as 3(+), but the low-lying spin (7+) and (10-) isomers are still under investigation.
General methods of isomer identification have already been achieved with in-source laser spectroscopy Fedosseev et al. (2012a) (and references therein). In the case of 68,70Cu Weissman et al. (2002), following the selection of isomeric beams, experiments such as Coulomb excitation Stefanescu et al. (2007) and mass measurements Van Roosbroeck et al. (2004) have been performed. However, these experiments suffered from isobaric contamination, as well as significant ground-state contamination due to the Doppler broadening of the hyperfine resonances of each isomer Cheal and Flanagan (2010). One way of addressing the difficulties of in-source laser spectroscopy (isobaric contamination, Doppler broadening, pressure broadening) is selecting the ground or isomeric state of interest by resonance ionization in a collinear geometry.
In a sub-Doppler geometry, the process of isomer selective resonance laser ionization Fedosseev et al. (2012a) can result in a high-purity isomeric beam. Deflection of the pure-state ion beam to the decay spectroscopy station allows identification of the hyperfine component with alpha-decay spectroscopy.
II Experimental technique
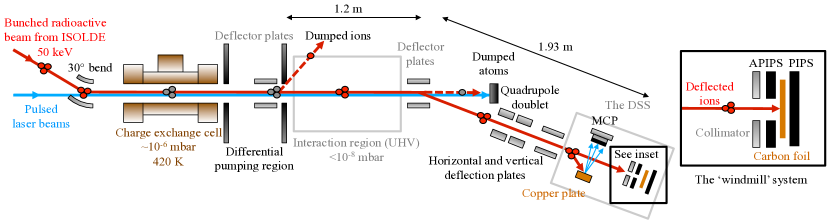
Radioactive ion beams of francium were produced at the ISOLDE facility, CERN Kugler (2000) by impinging 1.4 GeV protons onto a thick UCx target (up to 2 A integrated proton current). The radioisotopes were surface ionized through interaction with the rhenium coating on the hot (2400 K) tantalum transfer line and extracted from the target-ion source at 50 keV. The isotope of interest was mass selected using the high-resolution HRS separator and bunched (at 31.25 Hz) with the radio-frequency cooler-buncher ISCOOL Jokinen et al. (2003); Mané et al. (2009). The bunched-ion beam was deflected into the CRIS beam line and transported through a potassium-vapour charge exchange cell (CEC) (420 K, 10-6 mbar chamber pressure, 6 mbar vapour pressure Haynes (2013)) to be neutralized. In the 1.2 m long interaction region, the arrival of the atomic bunch was synchronized with two co-propagating pulsed laser beams to excite the state of interest followed by ionization in a step-wise scheme. The temporal length of the atomic bunch was 2-3 s, corresponding to a spatial length of 45-70 cm. To reduce the background signal resulting from non-resonant collisional ionization, the interaction region aims at ultra-high vacuum (UHV) conditions. A pressure of 10-8 mbar was achieved during this experiment. A schematic diagram of the CRIS beam line is shown in Fig. 1.
II.1 Collinear resonance ionization spectroscopy
The resonant excitation step from the 7s 2S1/2 electronic ground state to the 8p 2P3/2 state was probed with 422.7-nm light. The laser light of this resonant step was provided by a narrow-band titanium:sapphire (Ti:Sa) laser of the ISOLDE RILIS installation Fedosseev et al. (2012b); Rothe et al. (2013), pumped by the second harmonic output of a Nd:YAG laser (Model: Photonics Industries DM-60-532, 10 kHz). The fundamental output from the tuneable Ti:Sa laser was frequency doubled using a BBO crystal to produce the required 422.7-nm laser light. The light was fibre-coupled into the CRIS beam line through 35 m of multimode optical fibre (100 mW output). The laser linewidth of 1.5 GHz limited the resolution achieved in the present experiment, allowing only the lower-state (7s 2S1/2) splitting to be fully resolved. The second (non-resonant) transition from the 8p 2P3/2 state to the continuum was driven using 1064-nm light. This light was produced by a fundamental Nd:YAG laser (Model: Quanta-Ray LAB 130, operated at 31.25 Hz) next to the CRIS setup, temporally overlapped with the 422.7-nm laser beam and aligned through the laser/atom interaction region. The standard repetition rate of the RILIS lasers (10 kHz) limited the repetition rate of the 1064-nm laser light to 31.25 Hz (one out of every 320 pulses of 422.7-nm laser light was utilized). The bunching of the ion beam with ISCOOL was matched to the lower repetition rate of 31.25 Hz to overlap the atom bunch with the two laser pulses every 32 ms.
The synchronization of the first- and second-step laser pulses and the release of the ion bunch from ISCOOL was controlled by a Quantum Composers digital delay generator (Model: QC9258). The 10 kHz pulse generator of the Ti:Sa pump laser acted as the master clock, triggering the delay generator to output a sequence of TTL pulses to synchronize the 1064-nm laser light and the ion bunch with the 422.7-nm light, allowing resonance ionization of the francium atoms to occur. The laser ions were detected by a micro-channel plate (MCP) housed in the decay spectroscopy station (DSS). The electronic signal from the MCP was digitized by a LeCroy oscilloscope (Model: WavePro 725Zi, 2 GHz bandwidth, 8 bit ADC, 20 GS/s), triggered by the digital delay generator. The data were transferred from the oscilloscope using a LabVIEW™ program.
The frequency of the resonant excitation step, the 422.7-nm laser light, was scanned to study the 7s 2S 8p 2P3/2 atomic transition. The scanning and stabilization of the frequency was controlled by the RILIS Equipment Acquisition and Control Tool (REACT), a LabVIEW control program package that allows for remote control, equipment monitoring and data acquisition Rossel et al. (2013). This was achieved by controlling the etalon tilt angle inside the Ti:Sa laser resonator to adjust the laser wavelength, which was measured with a HighFinesse wavemeter (Model: WS7), calibrated with a frequency stabilised HeNe laser. The francium experimental campaign at CRIS marked the first implementation of the REACT framework for external users. The remote control LabVIEW interface for the Ti:Sa laser ran locally at the CRIS setup, allowing independent laser scanning and control.
II.2 Decay-assisted laser spectroscopy
The technique of decay-assisted collinear laser spectroscopy was further developed at the CRIS beam line to take advantage of the ultra-pure ion beams produced by resonance ionization in a collinear geometry Lynch et al. (2013a). The selectivity from resonance ionization of an isotope is a result of the selectivity of the Lorentzian profile of the natural linewidth (12.5 MHz) of the state and the Gaussian profile of the laser linewidth (1.5 GHz). At a frequency separation of 4 GHz, the Gaussian component falls to 1% of its peak intensity and the selectivity is dominated by the natural linewidth of the state. Thus, the maximum selectivity from resonance ionization is given by Eq. (1),
| (1) |
where is the separation in frequency of the two states (A and B), is the FWHM of the natural linewidth of the state, is the selectivity of the transition and is the number of transitions used. The total selectivity of a resonance ionization process is given by the product of the individual selectivities. In the case of the two states being the ground state and isomer, the selectivity can be calculated from Eq. (1). When the two states are the isotope of interest and contamination from a neighbouring isotope, additional selectivity can be gained from the kinematic shift since the laser is overlapped with an accelerated beam.
In addition to hyperfine-structure studies with ion detection, the decay spectroscopy station can be used to identify the hyperfine components of overlapping structures. This allows the hyperfine structure of two states to be separated by exploiting their characteristic radioactive-decay mechanisms. This results in a smaller error associated with the hyperfine parameters, and a better determination of the extracted nuclear observables.
The decay spectroscopy station (DSS) consists of a rotatable wheel implantation system Rajabali et al. (2013). It is based on the design from KU Leuven Dendooven (1992) (Fig. 1 of Ref. Andreyev et al. (2010)), which has provided results in a number of successful experiments Elseviers et al. (2013) (and references therein). The wheel holds 9 carbon foils, produced at the GSI target laboratory Lommel et al. (2002), with a thickness of 20(1) g cm-2 (90 nm) into which the ion beam is implanted (at a depth of 25 nm).
Two Canberra Passivated Implanted Planar Silicon (PIPS) detectors for charged-particle detection (e.g. alpha, electron, fission fragments) are situated on either side of the implantation carbon foil, as shown in Fig. 1. One PIPS detector (Model: BKA 300-17 AM, thickness 300 m) sits behind the carbon foil and another annular PIPS (APIPS) (Model: BKANPD 300-18 RM, thickness 300 m, with an aperture of 4 mm) is placed in front of the carbon foil. The detectors are connected to charge sensitive Canberra preamplifiers (Model: 2003BT) via a UHV type-C sub-miniature electrical feed-through.
Laser-produced ions from the interaction region in the CRIS beam line are deflected to the DSS by applying a potential difference between a pair of vertical electrostatic plates, see Fig. 1. The deflected ion beam is implanted into the carbon foil, after passing though a collimator with a 4 mm aperture and the APIPS detector. The collimator shields the APIPS detector from direct implantation of radioactive ions into the silicon wafer, see Fig. 1. Decay products from the carbon foil can be measured by either the APIPS or PIPS detector, with a total solid-angle coverage of 63% (simulated, assuming a uniform distribution of implanted activity). Operation of the single APIPS detector during the experiment gave an alpha-detection efficiency of 25%. An electrical contact is made to the collimator, allowing the current generated by the ion beam when it strikes the collimator to be measured and the plate to be used as a beam monitoring device. When it is not in use, it is electrically grounded to avoid charge build-up. A Faraday cup is installed in the location of one of the carbon foils. This copper plate (thickness 0.5 mm, diameter 10 mm) is electrically isolated from the steel wheel by PEEK rings and connected by a spot-welded Kapton cable attached to a rotatable BNC connection in the centre of the wheel Rajabali et al. (2013).
The alpha-decay spectroscopy data is acquired with a digital data acquisition system (DAQ), consisting of XIA digital gamma finder (DGF) revision D modules Hennig et al. (2007). Each module has four input channels with a 40 MHz sampling rate. Signals fed into the digital DAQ are self-triggered with no implementation of master triggers.
Due to the reflective surface of the inside of the vacuum chambers, a significant fraction of 1064-nm laser light was able to scatter into the silicon detectors. Despite the collimator in front of the APIPS detector to protect it from ion implantation (and laser light), the infra-red light caused a shift in the baseline of the signal from the silicon detector. This required the parameters for the DGF modules to be adjusted to account for this effect online, since the reflections were due to the particular setup of the experiment (power and laser-beam path).
The low energy resolution of the APIPS detector was associated with the necessity of optimizing the DGF parameters online with the radioactive 221Fr (t1/2 = 4.9(2) min). In addition, a fluctuating baseline resulting from the changing power of the 1064-nm laser light meant that only a resolution of 30 keV at 6.341 MeV was achieved. This however was sufficient to identify the characteristic alpha decays of the neutron-deficient francium isotopes under investigation.
III Results
The hyperfine structures of the neutron-deficient francium isotopes 202-206Fr were measured with collinear resonance ionization spectroscopy, with respect to the reference isotope 221Fr. This paper follows the recent publication reporting the hyperfine-structure studies of 202,203,205Fr Flanagan et al. (2013). During the experimental campaign, the neutron-rich francium isotopes 218m,219,229,231Fr were also studied. A detailed description of the nature of these isotopes will be the topic of a future publication Budinc̆ević et al. .
The resonance spectrum of the 7s 2S1/2 8p 2P3/2 transition was fit with a -minimization routine. The hyperfine factor was fixed to the ratio of the 7s 2S1/2 8p 2P3/2 transition of , given in literature Duong et al. (1987). For the 8p 2P3/2 state, the hyperfine factor is small enough to have no impact on the fit to the data, and was consequently set to zero Cocolios et al. (2013).
The intensities of the hyperfine transitions between hyperfine levels and (with angular momentum and respectively) are related to the intensity of the underlying fine structure transition Blaum et al. (2013). The relative intensities of the hyperfine transitions are given by
| (2) |
where denotes the Wigner 6- coefficient. Although these theoretical intensities are only strictly valid for closed two-level systems, and there was jitter on the temporal overlap of the two laser pulses in the interaction region, they were used as currently the most reliable estimate.
The factor and the centroid frequency of the hyperfine structure were determined for each scan individually. For isotopes with multiple scans, a weighted mean for the factor and the centroid frequency were calculated based on the error of the fits. The uncertainty attributed to the factor was calculated as the weighted standard deviation of the values. The isotope shifts were determined relative to 221Fr, with the uncertainty propagated from the error of the fits, the scatter and the drift in centroid frequency of the 221Fr reference scans Cocolios et al. (2013).
III.1 Spectroscopic studies of 204Fr
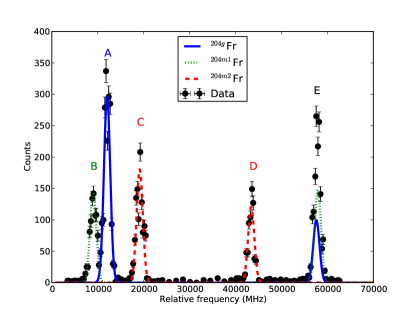
The hyperfine structure of 204Fr is shown in Fig. 2, measured by detecting the laser ions with the MCP detector as a function of the scanned first-step laser frequency. Five peaks are observed in the spectrum. Considering that only the lower-state splitting is resolved (associated with the 1.5 GHz linewidth of the scanning laser), two hyperfine resonances are expected per nuclear (ground or isomeric) state. Consequently, Fig. 2 contains the hyperfine structure of three long-lived states in 204Fr, with one of the resonances unresolved (labeled E). In order to identify the states of the hyperfine resonances, laser assisted alpha-decay spectroscopy was used.
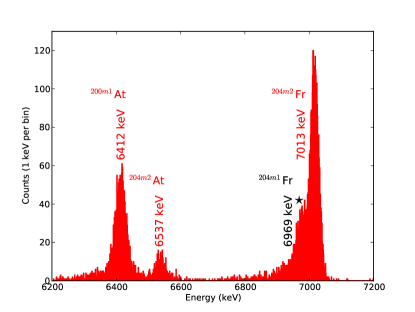
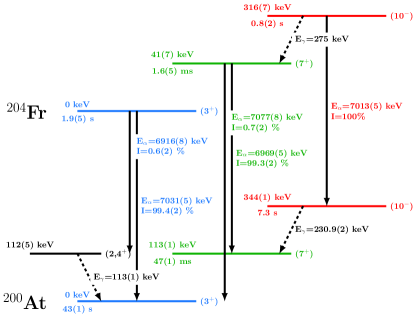
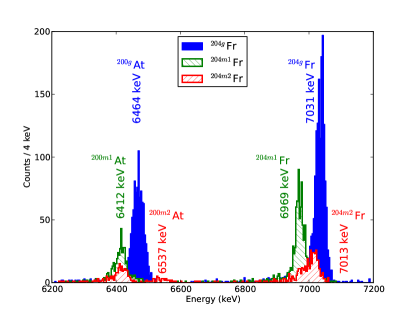
The radioactive decay of the low-lying states in 204Fr is presented in Fig. 3. The characteristic alpha decay of each nuclear state in 204Fr was utilized to identify the hyperfine-structure resonances of Fig. 2. The laser was tuned on resonance with each of the first three hyperfine resonances (labeled A, B and C) and alpha-decay spectroscopy was performed on each. The alpha-particle energy spectrum of these three states is illustrated in Fig. 4. The energy of the alpha particles emitted when the laser was on resonance with an atomic transition of the hyperfine spectrum characteristic of 204gFr is shown in blue. This transition occurred at 11.503 GHz (peak A of Fig. 2) relative to the centroid frequency of 221Fr. Similarly, the alpha-particle energy spectra for 204m1Fr and 204m2Fr are shown in green and red, when the laser was detuned by 8.508 GHz and 18.693 GHz (peak B and C) from the reference frequency, respectively. Present in the alpha-particle energy spectrum are the alpha particles emitted from the decay of the 204Fr states (6950-7050 keV) in addition to those emitted from the nuclear states in the daughter isotope 200At (6400-6500 keV). Each state in 204Fr has a characteristic alpha-particle emission energy: 7031 keV for 204gFr, 6969 keV for 204m1Fr and 7013 keV for 204m2Fr. This was confirmed by the presence of the corresponding daughter decays of 200gAt (6464 keV), 200m1Fr (6412 keV), and 200m2At (6537 keV) in the alpha-particle energy spectrum.
An additional alpha-decay measurement was performed on peak D in the hyperfine spectrum of 204Fr (see Fig. 2) at 43.258 GHz relative to the centroid frequency of 221Fr. The observation of 7013 keV alpha particles allowed this state to be identified as 204m2Fr. This meant the identity of all five hyperfine-structure peaks could be allocated to a state in 204Fr (hence the hyperfine structure peak E is the overlapping structure of 204gFr and 204m1Fr), allowing analysis of the hyperfine structure of each state.
In addition to the 7031 keV alpha particles of 204m2Fr, alpha particles of 6969 keV from the decay of 204m1Fr were also observed when the laser was on resonance with the 204m2Fr state. The decay of the (10-) state to 204m1Fr via an E3 internal transition (IT) has been predicted Huyse et al. (1992) but only recently observed Jakobsson et al. (2012), see Fig. 3. This was achieved by tagging the conversion electron from the internal conversion of 204m2Fr with the emitted 6969 keV alpha particles of 204m1Fr that followed (with a 5 s correlation time). This allowed the predicted energy of the 275 keV isomeric transition to be confirmed. During the CRIS experiment, an additional alpha-decay measurement was performed on 204m2Fr, with the laser detuned by 43.258 GHz relative to the centroid frequency of 221Fr, see Fig. 5. This spectrum confirms the presence of the 6969 keV alpha particle (denoted by ), emitted from the decay of 204m1Fr. The ultra-pure conditions of this measurement allowed the first unambiguous extraction of the branching ratios in the decay of 204m2Fr: % and % Lynch (2013).
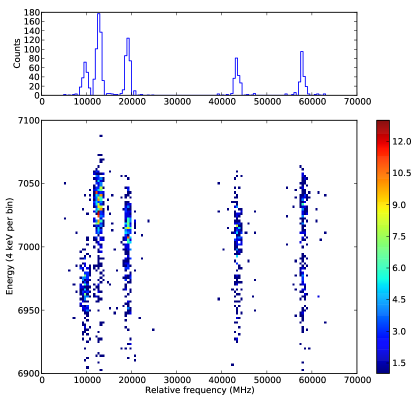
Decay-assisted laser spectroscopy was also performed on the hyperfine structure of the low-lying states of 204Fr. Just as the laser frequency of the resonant 422.7-nm ionization step was scanned and resonant ions were detected in the collinear resonance ionization spectroscopy of 204Fr, the same technique was repeated with the measurement of alpha particles. At each laser frequency, a radioactive-decay measurement of 60 s was made at the DSS, measuring the alpha particles emitted from the implanted ions. Fig. 6 (Top) shows the hyperfine peaks associated with each state in 204Fr. Measurement of the alpha decay as a function of laser frequency allowed production of a matrix of alpha-particle energy versus laser frequency, see Fig. 6.
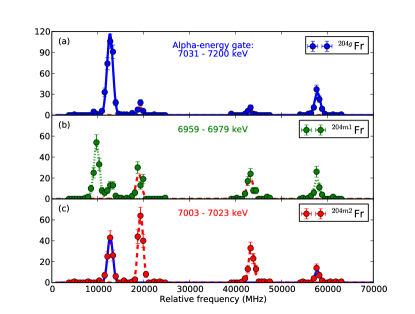
In order to separate hyperfine structures for each states, an alpha-energy gating was used to maximize the signal-to-noise ratio for the alpha particle of interest. The alpha-energy gates were chosen to be 7031-7200 keV for 204gFr, 6959-6979 keV for 204m1Fr and 7003-7023 keV for 204m2Fr.
By gating on the characteristic alpha-particle energies of the three states in 204Fr, the hyperfine structures of individual isomers become enhanced in the hyperfine spectrum. Fig. 7(a) shows the hyperfine structure of 204gFr, (b) 204m1Fr, and (c) 204m2Fr. The presence of 204m2Fr can be observed in the spectra of 204gFr due to the overlapping peaks of the alpha energies: the tail of the 7013 keV alpha peak is present in the gate of the 204gFr alpha peak. The presence of 204m2Fr in the hyperfine structure spectrum of 204m1Fr is attributed to the E3 IT decay of 204m2Fr to 204m1Fr: alpha particles of energy 6969 keV are observed when on resonance with 204m2Fr. Additionally, 204gFr is present in the 204m2Fr spectra due to the similar energies of the 7031 keV and 7013 keV alpha particles. However, despite the contamination in the hyperfine spectra, each peak is separated sufficiently in frequency to be analysed independently.
From the resulting hyperfine structures of Fig. 7 produced by the alpha-tagging process (in comparison to the overlapping ion data of Fig. 2), each state of 204Fr can be analysed individually and the hyperfine factors extracted with better accuracy and reliability. The estimated error of the factors was 30 MHz on account of the scatter of values for 221Fr. Likewise, an error of 100 MHz was assigned to the isotope shifts.
III.2 Identification of the hyperfine structure of 202Fr
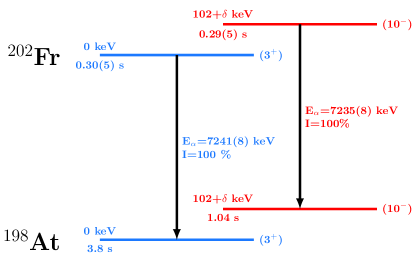
The hyperfine structure of 202Fr obtained with collinear resonance ionization spectroscopy is presented in Fig. 8. The four hyperfine resonances illustrate the presence of the ground (202gFr) and isomeric (202mFr) states. Identification of these two states was performed with laser-assisted alpha-decay spectroscopy. According to literature, the radioactive decay of 202gFr (t1/2 = 0.30(5) s) emits an alpha particle of energy 7241(8) keV, whereas 202mFr (t1/2 = 0.29(5) s) emits an alpha particle of energy 7235(8) keV Zhu and Kondev (2008). The radioactive decay of the ground and isomeric state of 202Fr is presented in Fig. 9.

The laser was tuned onto resonance with peak A (202gFr, 13.760 GHz relative to the centroid frequency of 221Fr) and peak B (202mFr, 20.950 GHz relative to the centroid frequency of 221Fr) of Fig. 8 obtained from ion detection. For each position, an alpha-decay measurement was performed, shown in Fig. 10. The alpha particles emitted when the laser was on resonance with an atomic transition characteristic to 202gFr are shown in blue, and 202mFr in red. Due to the limited statistics of our measurement, and the similarity in energies of the alpha particles (within error), it is impossible to say that alpha particles of different energies are observed in Fig. 10.
Firm identification of the hyperfine components can be achieved however by studying the alpha particles emitted by the daughter isotopes 198g,mAt. Evident in the spectrum of 202gFr are the alpha particles emitted from the decay of the daughter nucleus 198gAt with an energy of 6755 keV. Similarly, present in the 202mFr spectrum are the alpha particles from the decay of 198mAt with an energy of 6856 keV. The difference in energy of these two alpha peaks illustrates the ability of the CRIS technique to separate the two states and provide pure ground state and isomeric beams for decay spectroscopy.
III.3 Isomer identification of the resonance spectrum of 206Fr
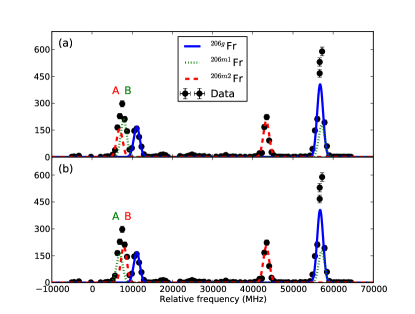
Two sets of data were used in the determination of the nuclear observables from the hyperfine structure scans. The data for the francium isotopes 202-206,221Fr were taken in Run I and the data for 202-205,221Fr were taken in Run II. Consistency checks were carried out, allowing 206Fr to be evaluated with respect to the rest of the data set from Run II. A detailed description of this analysis can be found in Ref. Lynch (2013). In Run I, no alpha-tagging was available and consequently the peaks in the ion-detected hyperfine spectrum needed to be identified in a different way. Recent measurements of the ground-state hyperfine structure of 206gFr provided the factor for the splitting of the 7s 2S1/2 state Voss et al. (2013). One peak of the (7+) isomeric state was also identified in this experiment (see Fig. 1(c) of Ref. Voss et al. (2013)), allowing the positions of the overlapping resonances to be determined. This left only the identity of peaks A and B (shown in Fig. 11) unknown. Fig. 11(a) presents the hyperfine structures when peak A is assigned to 206m2Fr and peak B to 206m1Fr. Fig. 11(b) shows the fit when peak A is 206m1Fr and peak B is 206m2Fr. The suggested identity of the two resonances (based on mean-square charge radii and -factor systematics) is discussed in Sec. IV.
III.4 Yield measurements
| Yield | Proportion of beam | |||
|---|---|---|---|---|
| (ions/s) | Spin 3(+) | Spin (7+) | Spin (10-) | |
| 202 | 76(14)% | 24(6)% | ||
| 203 | ||||
| 204 | 111Estimate based on yield systematics. | 63(3)% | 27(3)% | 10(1)% |
| 205 | ||||
| 206 | 63(7)% | 27(5)% | 9(1)% | |
The yields of the neutron-deficient francium isotopes 202-206Fr are presented in Table 1. The quoted yields, scaled ISOLDE-database yields based on an independent yield measurement of 202Fr, can be expected to vary by a factor of two due to different targets. The quoted value for 204Fr is estimated based on francium yields systematics. The composition of the beam for 202,204,206Fr was calculated from the ratio of hyperfine-peak intensities (based on the strongest hyperfine-structure resonance) from the CRIS ion data. The composition of the beam for 202Fr was confirmed with the alpha-decay data measured with the DSS.
III.5 King-plot analysis
| (s) | (GHz) | () | (GHz) | (fm2) | |||||
|---|---|---|---|---|---|---|---|---|---|
| Lit. | Exp. | Lit. | Exp. | Lit. | Exp. | Exp. | Lit. | ||
| 202g | (3+) | 0.30(5) | +12.80(5) | +3.90(5) | 32.68(10) | -1.596(18) | |||
| 202m | (10-) | 0.29(5) | +2.30(3) | +2.34(4) | 32.57(13) | -1.591(19) | |||
| 203 | (9/2-) | 0.53(2) | +8.18(3) | +3.73(4) | 31.32(10) | -1.530(18) | |||
| 204g222Calculated from the alpha-decay gated hyperfine structure scan of 204Fr. See text for details. | 3(+) | 1.9(5) | +12.99(3) | +13.1499(43)333Literature value taken from Ref. Voss et al. (2013). | +3.95(5) | +4.00(5)22footnotemark: 2,444Literature magnetic-moment values re-calculated in reference to (210Fr) Gomez et al. (2008) | 32.19(10) | -1.571(18) | -1.5542(4)22footnotemark: 2 |
| 204m111footnotemark: 1 | (7+) | 1.6(5) | +6.44(3) | +4.57(6) | 32.32(10) | -1.577(18) | |||
| 204m211footnotemark: 1 | (10-) | 0.8(2) | +2.31(3) | +2.35(4) | 30.99(10) | -1.513(17) | |||
| 205 | 9/2- | 3.96(4) | +8.40(3) | +8.3550(11)22footnotemark: 2 | +3.83(5) | +3.81(4)22footnotemark: 2,33footnotemark: 3 | 30.21(10) | -1.475(17) | -1.4745(4)22footnotemark: 2 |
| 206g | 3(+) | 15.9(3) | +13.12(3) | +13.0522(20)22footnotemark: 2 | +3.99(5) | +3.97(5)22footnotemark: 2,33footnotemark: 3 | 30.04(12) | -1.465(17) | -1.4768(4)22footnotemark: 2 |
| 206m1555Based on the isomeric identity of the hyperfine resonances of Option 1. See text for details. | (7+) | 15.9(3) | +6.61(3) | +4.69(6) | 30.23(16) | -1.475(18) | |||
| 206m244footnotemark: 4 | (10-) | 0.7(1) | +3.50(3) | +3.55(5) | 23.57(12) | -1.153(14) | |||
| 206m1666Based on the isomeric identity of the hyperfine resonances of Option 2. See text for details. | (7+) | 15.9(3) | +6.74(4) | +4.79(6) | 29.69(15) | -1.449(17) | |||
| 206m255footnotemark: 5 | (10-) | 0.7(1) | +3.40(3) | +3.45(5) | 24.13(12) | -1.180(14) | |||
| 207 | 9/2- | 14.8(1) | +8.48(3) | +8.484(1)777Literature value taken from Ref. Coc et al. (1985). | +3.87(5) | +3.87(4)33footnotemark: 3,66footnotemark: 6 | 28.42(10) | -1.386(16) | -1.386(3)888Literature value taken from Ref. Dzuba et al. (2005). |
| 211 | 9/2- | 186(1) | +8.70(6) | +8.7139(8)66footnotemark: 6 | +3.97(5) | +3.98(5)33footnotemark: 3,66footnotemark: 6 | 24.04(10) | -1.171(13) | -1.1779(4)77footnotemark: 7 |
| 220 | 1+ | 27.4(3) | -6.50(4) | -6.5494(9)66footnotemark: 6 | -0.66(1) | -0.66(1)33footnotemark: 3,66footnotemark: 6 | 2.75(10) | -0.134(5) | -0.133(10)77footnotemark: 7 |
| 221 | 5/2- | 294(12) | +6.20(3) | +6.2046(8)66footnotemark: 6 | +1.57(2) | +1.57(2)33footnotemark: 3,66footnotemark: 6 | 0 | 0 | |
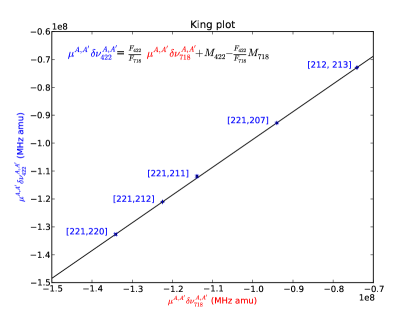
The atomic factors and were evaluated by the King-plot method King (1963). This combines the previously measured isotope shifts by Coc Coc et al. (1985) of the 7s 2S1/2 7p 2P3/2 transition with 718-nm laser light, with those made by Duong Duong et al. (1987) of the 7s 2S1/2 8p 2P3/2 transition (422.7 nm). The isotope shifts of and from this work were combined with and from Duong. These values were plotted against the corresponding isotope shifts from Coc Coc et al. (1985), shown in Fig. 12. From the linear fit of the data, and using
| (3) |
where , enabled the evaluation of and respectively. From these values, the atomic factors for the 422.7-nm transition were calculated to be
For comparison, the atomic factors evaluated for the 718-nm transition were determined by Dzuba to be 20.766(208) GHz/fm2 and 85(113) GHz amu Dzuba et al. (2005).
The mass factor is the linear combination of two components: the normal mass shift, , and the specific mass shift, ,
| (4) |
and is dependent on the frequency of the transition probed. Subtraction of the normal mass shift of the 422.7-nm transition ( GHz amu) from the mass factor allows for calculation of the specific mass shift, giving GHz amu. The specific mass shift for the 718-nm line was determined by Dzuba to be GHz amu Dzuba et al. (2005).
III.6 Hyperfine structure observables
Table 2 presents the hyperfine factor, isotope shift, change in mean-square charge radius and magnetic moment values extracted from the CRIS data for the francium isotopes 202-206Fr with reference to 221Fr. Additional data for 207,211,220Fr (used in the creation of the King plot of Fig. 12) in included for completeness. All values were deduced using the nuclear spins presented.
The hyperfine factor is defined as
| (5) |
with the magnetic dipole moment of the nucleus and the magnetic field of the electrons at the nucleus. For each isotope, it was calculated from the weighted mean of values for isotopes where more than one hyperfine structure scan is present. A minimum error of 30 MHz was attributed to the factor values due to the scatter of the measured for the reference isotope 221Fr Cocolios et al. (2013); Lynch et al. (2013b).
The isotope shift, , between isotopes and is expressed as
| (6) |
As with the values, the isotope shifts were calculated as the weighted mean of all isotope shifts for a given nucleus. The error on the isotope shift was determined to be 100 MHz due to the long-term drift of the centroid frequency of 221Fr as the experiment progressed, and the scan-to-scan scatter in centroid frequency. When the calculated weighted standard deviation of the isotope shift was higher than 100 MHz, this error is quoted instead. Combining the extracted and atomic factors from the King-plot analysis with the measured isotope shifts, evaluation of the change in mean-square charge radii, , between francium isotopes can be performed, see Eq. (6).
The magnetic moment of the isotopes under investigation can be extracted from the known moment of another isotope of the element, using the ratio
| (7) |
In this work, calculation of the magnetic moments was evaluated in reference to the magnetic moment of 210Fr, measured by Gomez (, , MHz Gomez et al. (2008); Coc et al. (1985)). This represents the most accurate measurement of the magnetic moment of a francium isotope to date, due to probing the 9s 2S1/2 hyperfine splitting which has reduced electron-correlation effects than that of the ground state. The current evaluated magnetic moments of the francium isotopes are made in reference to the magnetic moment of 211Fr of Ekström Ekström et al. (1986).
The hyperfine anomaly for the francium isotopes is generally considered to be of the order of 1% and is included as a contribution to the error of the hyperfine factors and magnetic moments Stroke et al. (1961).
Table 2 presents the experimental results alongside comparison to literature of the hyperfine factor, change in mean-square charge radius and magnetic moment values. The literature values for 204-206Fr have been taken from Ref. Voss et al. (2013) and 207,211,220,221Fr from Ref. Coc et al. (1985). The magnetic-moment values from literature have been re-calculated in reference to (210Fr) Gomez et al. (2008), the most accurate measurement to date. The change in mean-square charge radii values for 207,211,220Fr have been taken from Ref. Dzuba et al. (2005). All experimental results are in broad agreement with those of literature.
IV Discussion
IV.1 Charge radii of the neutron-deficient francium
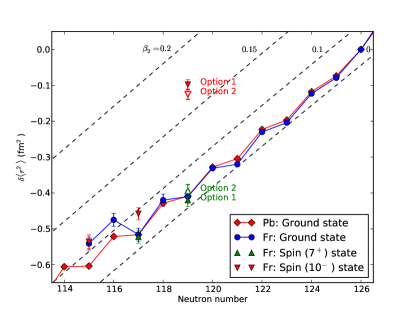
Located between radon and radium, francium (Z = 87) has 5 valence protons occupying the 1h9/2 orbital, according to the shell model of spherical nuclei. Below the N = 126 shell closure, the neutron-deficient francium isotopes were studied down to 202Fr (N = 115). The change in mean-square charge radii for the francium and lead isotopes are presented in Fig. 13. The data of francium show the charge radii of 207-213Fr re-evaluated by Dzuba Dzuba et al. (2005) alongside the CRIS values which extends the data set to 202Fr. The blue data points show the francium ground states, while the (7+) isomeric states are in green and the (10-) states in red. The error bars attributed to the CRIS values are propagated from the experimental error of the isotope shift and the systematic error associated with the atomic factors and . The systematic error is the most significant contribution to the uncertainty associated with the mean-square charge radii, and not that arising from the isotope shift. The francium data is presented with the lead data of Anselment Anselment et al. (1986) to illustrate the departure from the spherical nucleus. The change in mean-square charge radii of the francium isotopes have been overlapped with the charge radii of the lead isotopes, by using 213Fr (N = 126) and 208Pb (N = 126) as reference points. The dashed iso-deformation lines represent the prediction of the droplet model for the francium isotopes Myers and Schmidt (1983). The data were calibrated using (213Fr), evaluated from the energy of the state in 212Rn Raman et al. (2001).
The doubly-magic 208Pb represents a model spherical nucleus, with the shape of the nucleus remaining spherical with the removal of neutrons from the closed N = 126 shell. This trend is observed until N = 114, where a small deviation from the spherical droplet model (isodeformation line ) is interpreted as enhanced collectivity due to the influence of particle-hole excitations across the Z = 82 shell closure De Witte et al. (2007). The change in mean-square charge radii for the francium isotopes shows agreement with the lead data as the 3p3/2, 2f5/2 and 3p1/2 orbitals are progressively depleted. The deviation from sphericity at N = 116 with 203Fr marks the onset of collective behaviour. The spectroscopic quadrupole moments were not measured in this work, since they require a laser linewidth of 100 MHz. Measurement of the quadrupole moment will provide information on the static deformation component of the change in mean-square charge radii, allowing better understanding of this transition region.
Recent laser spectroscopy measurements on the ground-state properties of 204,205,206Fr suggest this deviation occurs earlier, at 206Fr (N = 119) Voss et al. (2013). In Ref. Voss et al. (2013), a more pronounced odd-even staggering is observed in relation to the lead isotopes, where the mean-square charge radius of 205Fr is larger than that of 206Fr. The CRIS experiment observed a smaller mean-square charge radius of 205Fr in comparison to 206Fr, the deviation from the lead isotopes occurring at 203Fr instead. However, both experiments are in broad agreement within errors down to N = 117.
Figure 13 presents the two options of the mean-square charge radii of 206m1Fr and 206m2Fr (as defined by their hyperfine peak identity in Fig. 11). Option 1 is favoured over option 2 due to the smaller mean-square charge radii of 206m1Fr (compared to 206gFr) agreeing with the systematics of the states in 204Fr. As seen in Fig. 13, 206gFr (N = 119) overlaps with the lead data within errors. The large change in the mean-square charge radius of 206m2Fr suggests a highly deformed state for the (10-) isomer.
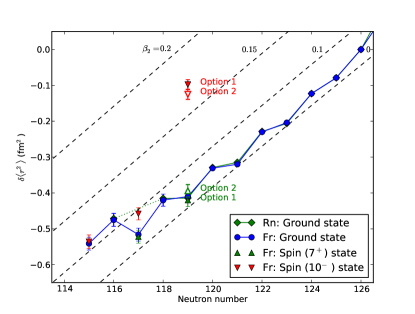
The mean-square charge radii of francium are overlaid with the radon (Z = 86) charge-radii of Borchers (down to N = 116, with the exception of N = 117) Borchers et al. (1987) in Fig. 14. The mean-square charge-radii of radon have been calibrated to the francium pair to account for the uncertainty in and for the optical transition probed (the original isotope shifts are presented graphically). Despite this, the agreement between the mean-square charge radii of the francium and radon data is clear. The addition of a single 1h9/2 proton outside the radon even-Z core does not affect the charge-radii trend, suggesting the valence proton acts as a spectator particle.
Table 3 presents a comparison of values with literature. The droplet model Myers and Schmidt (1983) was used to extract the rms values for (column 3) from the change in mean-square charge radii (calibrated using (213Fr), as before). Column 4 presents values extracted from the quadrupole moments of Ref. Voss et al. (2013). The larger values extracted from the mean-square charge radii, compared to those extracted from the quadrupole moments, suggest that the enhanced collectivity observed in Figs. 13 and 14 is due to a large dynamic component of the nuclear deformation.
| Exp. | Lit. | ||
| 202g | (3+) | 0.11 | |
| 202m | (10-) | 0.11 | |
| 203 | (9/2-) | 0.11 | |
| 204g | 3(+) | 0.06999Calculated from the alpha-decay gated hyperfine structure scan of 204Fr. See text for details. | -0.0140(14) |
| 204m1 | (7+) | 0.0611footnotemark: 1 | |
| 204m2 | (10-) | 0.0911footnotemark: 1 | |
| 205 | 9/2- | 0.08 | -0.0204(2) |
| 206g | 3(+) | 0.05 | -0.0269(8) |
| 206m1 | (7+) | 0.04101010Based on the isomeric identity of the hyperfine resonances of Option 1. See text for details. | |
| 206m2 | (10-) | 0.1722footnotemark: 2 | |
| 202m1 | (7+) | 0.07111111Based on the isomeric identity of the hyperfine resonances of Option 2. See text for details. | |
| 202m2 | (10-) | 0.1733footnotemark: 3 |
IV.2 Interpretation of the nuclear -factors
Figures 15 and 17 show the experimental -factors for odd-A and even-A francium isotopes, respectively. These plots present the CRIS data alongside the data from Ekström Ekström et al. (1986). The Ekström data has been re-evaluated with respect to the (210Fr) measurement of Gomez Gomez et al. (2008).
In Fig. 15, the blue line represents the empirical -factor () of the odd-A isotopes for the single-particle occupation of the valence proton in the 1 orbital. (1h9/2) was determined from the magnetic moment of the single-particle state in 209Bi Bastug et al. (1996). Similarly, (3s1/2) was estimated from the magnetic moment of the single-hole ground-state in 207Tl Neugart et al. (1985). From N = 126 to 116, every isotope has a -factor consistent with the proton occupying the 1h9/2 orbital. This indicates that the 9/2- state remains the ground state, and the (3s) proton intruder state has not yet inverted. This lowering in energy of the 3s1/2 state to become the ground state would be apparent in the sudden increase in -factor of the ground state, as illustrated by the black (3s1/2) line.
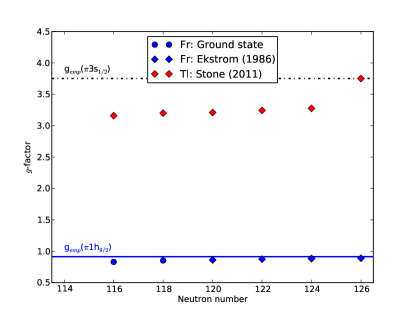
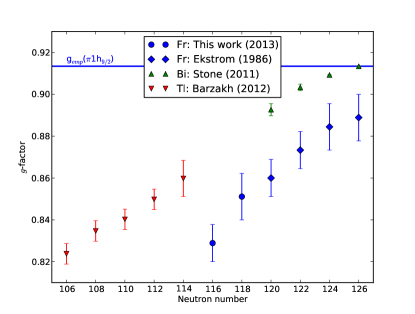
Figure 15 highlights the robustness of the Z = 82 and N = 126 shell closure with a shell-model description valid over a range of isotopes. A close-up of (11h9/2) in Fig. 16 illustrates that the -factor is sensitive to bulk nuclear effects. The departure from the (11h9/2) line shows the sensitivity of the -factor to second-order core polarization in the odd-A thallium, bismuth and francium isotopes. The systematic decrease in -factor of francium is attributed to second-order core polarization associated with the presence of five valence particles, compared to one-particle (hole) in the bismuth (thallium) isotopes, enough to significantly weaken the shell closure. The linear trend observed in bismuth, thallium and francium (until N = 118) is suggested to be related to the opening of the neutron shell, yet allowing for more neutron and proton-neutron correlations.
Further measurements towards the limit ./of stability are needed to better understand the prediction of the inversion of the 3s1/2 intruder orbital with the 1h9/2 ground state. A re-measurement of 203Fr could determine the presence of the spin 1/2+ isomer (t1/2 = 43(4) ms Jakobsson et al. (2013)), which was not observed during this experiment.
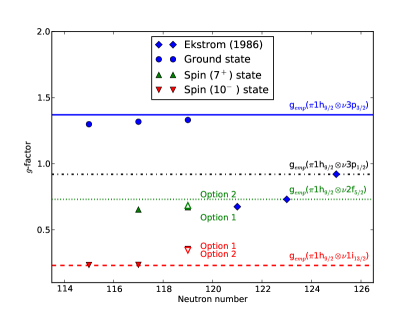
The -factors for the odd-odd francium isotopes are presented in Fig. 17. With the coupling of the single valence proton in the 1 orbital with a valence neutron, a large shell model space is available. The empirically calculated -factors for the coupling of the 1h9/2 proton with the valence neutrons are denoted by the colored lines. These -factors were calculated from the additivity relation
| (8) |
as outlined by Neyens Neyens (2003). The empirical -factors of the odd valence neutrons were calculated from the magnetic moments of neighbouring nuclei: 201Po for the blue (1h3p3/2) and red (1h1i13/2) line Wouters et al. (1991); 213Ra for the black (1h3p1/2) line; and 211Ra for the green (1h2f5/2) line Ahmad et al. (1983). The empirical -factors for the valence proton in the 1h9/2 orbital were calculated from the magnetic moment of the closest odd-A francium isotope (203Fr and 213Fr respectively) from the CRIS data.
The ground state of 202,204,206Fr display similar -factors, with the valence proton and neutron coupling to give a spin 3(+) state. The tentative configuration in literature of (1h2f5/2) for 202gFr is based on the configuration of the (3+) state in 194Bi (from favoured Fr-At-Bi alpha-decay chain systematics) Zhu and Kondev (2008). Similarly, the assignment of the same configuration for 204gFr and 206gFr is based on the alpha-decay systematics of neighbouring nuclei 196,198Bi. However, the initial assignment of 194gBi was declared to be either (1h2f5/2) or (1h3p3/2) Duppen et al. (1991). From the -factors of the ground states of 202,204,206Fr, it is clear that the configuration of these states is indeed (1h3p3/2).
Figure 17 also presents the -factors of 206m1Fr and 206m2Fr for option 1 and 2 (see Fig. 11). The first isomeric states of 204,206Fr (7+) have a valence neutron that occupies the 2 state. This coupling of the proton-particle neutron-hole results in a (1h2f5/2) configuration Kondev (2008). For 202mFr, 204m2Fr and 206m2Fr, the particle proton-neutron hole coupling result in a tentative (1h1i13/2) configuration assignment for each isomer Chiara and Kondev (2010). However, while the agreement of the -factors of the spin (10-) state in 202,204Fr point to a 1 occupancy, the observed value for 206m2Fr is in disagreement with the -factor of such a (10-) state. The charge radius of 206m2Fr indicates a highly deformed configuration, where the single-particle description of the nucleus is no longer valid. This is consistent with the -factor of this state: it is no longer obeying a simple shell-model description. This leads to the conclusion, that while a (1h1i13/2) configuration for 206m2Fr is suggested, the charge radii and magnetic moment point to a drastic change in the structure of this isomeric state.
For completeness, the configurations of the odd-odd francium isotopes 208,210,212Fr are presented. The coupling of the valence proton and neutron in the 1h9/2 and 2f5/2 orbital in 208Fr and 210Fr leads to a (1h2f5/2) and (1h2f5/2) configuration respectively Martin (2007). With the 2f5/2 neutron orbital fully occupied, the valence neutron in 212Fr occupies the 3p1/2 orbital, resulting in a (1h3p1/2) configuration Browne (2005).
The agreement of the experimental and empirical -factors, as shown in Figs. 15-17, illustrates the suitability of the single-particle description of the neutron-deficient francium isotopes, with the exception of the (10-) state in 206m2Fr. A model-independent spin and spectroscopic quadrupole moment determination is needed to clarify the nature of this isomeric state. The neutron-deficient francium isotopes display a single-particle nature where the additivity relation is still reliable.
V Conclusion and Outlook
The hyperfine structures and isotope shifts of the neutron-deficient francium isotopes 202-206Fr with reference to 221Fr were measured with collinear resonance ionisation spectroscopy, and the change in mean-square charge radii and magnetic moments extracted. The selectivity of the alpha-decay patterns allowed the unambiguous identification of the hyperfine components of the low-lying isomers of 202,204Fr for the first time.
The resonant atomic transition of 7s 2S 8p 2P3/2 was probed, and the hyperfine factor measured. A King plot analysis of the 422.7-nm transition in francium allowed the atomic factors to be calibrated. The field and mass factors were determined to be F422 = 20.670(210) GHz/fm2 and M422 = +750(330) GHz amu, respectively.
The novel technique of decay-assisted laser spectroscopy in a collinear geometry was performed on the isotopes 202,204Fr. The decay spectroscopy station was utilized to identify the peaks in the hyperfine spectra of 202,204Fr. Alpha-tagging the hyperfine structure scan of 204Fr allowed the accurate determination of the nuclear observables of the three low-lying isomeric states and the determination of the branching ratios in the decay of 204m2Fr.
Analysis of the change in mean-square charge radii suggests an onset of collectivity that occurs at 203Fr (N = 116). However, measurement of the spectroscopic quadrupole moment is required to determine the nature of the deformation (static or dynamic). The magnetic moments suggest that the single-particle description of the neutron-deficient francium isotopes still holds, with the exception of the (10-) isomeric state of 206m2Fr. Based on the systematics of the region, the tentative assignment of the hyperfine structure peaks in 206Fr result in magnetic moments and mean-square charge radii that suggest a highly deformed state. Laser assisted nuclear decay spectroscopy of 206Fr would unambiguously determine their identity.
The occupation of the valence proton in the 1h9/2 orbital has been suggested for all measured isotopes down to 202Fr, indicating the (1s) intruder state does not yet invert with the 1h9/2 orbital as the ground state. Further measurements of the very neutron-deficient francium isotopes towards 199Fr are required to fully determine the nature of the proton-intruder state. A laser linewidth of 1.5 GHz was enough to resolve the lower-state (7s 2S1/2) splitting of the hyperfine structure and measure the factor. In the future, the inclusion of a narrow-band laser system for the resonant-excitation step will enable the resolution of the upper-state (8p 2P3/2) splitting, providing the hyperfine factor. This will allow extraction of the spectroscopic quadrupole moment and determination of the nature of the deformation.
Successful measurement of 202Fr was performed during this experiment, with a yield of 100 atoms per second. By pushing the limits of laser spectroscopy, further measurements of 201Fr (with a yield of 1 atom per second) and 200Fr (less than 1 atom per second) are thought to be possible. The ground state (9/2-) of 201Fr has a half life of 53 ms and its isomer (1/2+) a half life of 19 ms. By increasing the sensitivity of the CRIS technique, the presence of the 1/2+ isomers in 201,203Fr can be confirmed. A positive identification will lead to nuclear-structure measurements that will determine (along with the verification of nuclear spin) the magnetic moments which are sensitive to the single-particle structure and thus to the (3s1/2) proton intruder nature of these states. With sufficient resolution (100 MHz), the spectroscopic quadrupole moment of these neutron-deficient states (with ) will be directly measurable and the time-averaged static deformation can be determined.
The successful measurements performed by the CRIS experiment demonstrates the high sensitivity of the collinear resonance ionization technique. The decay spectroscopy station provides the ability to identify overlapping hyperfine structure and eventually perform laser assisted nuclear decay spectroscopy measurements on pure ground and isomeric-state beams Lynch et al. (2012, 2013a).
Acknowledgements
The authors extend their thanks to the ISOLDE team for providing the beam, the GSI target lab for producing the carbon foils, and IKS-KU Leuven and The University of Manchester machine shops for their work. This work was supported by the IAP project P7/23 of the OSTC Belgium (BRIX network) and by the FWO-Vlaanderen (Belgium). The Manchester group was supported by the STFC consolidated grant ST/F012071/1 and continuation grant ST/J000159/1. K.T. Flanagan was supported by STFC Advanced Fellowship Scheme grant number ST/F012071/1. The authors would also like to thank Ed Schneiderman for continued support through donations to the Physics Department at NYU.
References
- Cheal and Flanagan (2010) B. Cheal and K. T. Flanagan, J. Phys. G 37, 113101 (2010).
- Blaum et al. (2013) K. Blaum, J. Dilling, and W. Nörtershäuser, Physica Scripta 2013, 014017 (2013).
- Procter and Flanagan (2013) T. J. Procter and K. T. Flanagan, Hyperfine Interact. 216, 89 (2013).
- Liberman et al. (1978) S. Liberman et al., C. R. Acad. Sci. Paris Ser. B 286, 353 (1978).
- Liberman et al. (1980) S. Liberman et al., Phys. Rev. A 22, 2732 (1980).
- Yagoda (1932) H. Yagoda, Phys. Rev. 40, 1017 (1932).
- Coc et al. (1985) A. Coc et al., Phys. Lett. B 163, 66 (1985).
- Touchard et al. (1984) F. Touchard et al., Atomic Masses and Fundamental Constants 7 , 353 (1984).
- Bauche et al. (1986) J. Bauche et al., J. Phys. B: At. Mol. Opt. Phys. 19, L593 (1986).
- Duong et al. (1987) H. T. Duong et al., Europhys. Lett. 3, 175 (1987).
- Andreev et al. (1987) S. V. Andreev, V. I. Mishin, and V. S. Letokhov, Phys. Rev. Lett. 59, 1274 (1987).
- Kudriavtsev and Letokhov (1982) Y. Kudriavtsev and V. Letokhov, Applied Physics B 29, 219 (1982).
- Schulz et al. (1991) C. Schulz et al., J. Phys. B: At. Mol. Opt. Phys. 24, 4831 (1991).
- Davids et al. (1996) C. N. Davids et al., Phys. Rev. Lett. 76, 592 (1996).
- Kettunen et al. (2003) H. Kettunen et al., Eur. Phys. J. A 16, 457 (2003).
- Uusitalo et al. (2005) J. Uusitalo et al., Phys. Rev. C 71, 024306 (2005).
- Jakobsson et al. (2012) U. Jakobsson et al., Phys. Rev. C 85, 014309 (2012).
- Huyse et al. (1992) M. Huyse, P. Decrock, P. Dendooven, G. Reusen, P. Van Duppen, and J. Wauters, Phys. Rev. C 46, 1209 (1992).
- Jakobsson et al. (2013) U. Jakobsson et al., Phys. Rev. C 87, 054320 (2013).
- Voss et al. (2013) A. Voss, M. R. Pearson, J. Billowes, F. Buchinger, B. Cheal, J. E. Crawford, A. A. Kwiatkowski, C. D. P. Levy, and O. Shelbaya, Phys. Rev. Lett. 111, 122501 (2013).
- Fedosseev et al. (2012a) V. N. Fedosseev, Y. Kudryavtsev, and V. I. Mishin, Phys. Scripta 85, 058104 (2012a).
- Weissman et al. (2002) L. Weissman et al., Phys. Rev. C 65, 024315 (2002).
- Stefanescu et al. (2007) I. Stefanescu et al., Phys. Rev. Lett. 98, 122701 (2007).
- Van Roosbroeck et al. (2004) J. Van Roosbroeck et al., Phys. Rev. Lett. 92, 112501 (2004).
- Kugler (2000) E. Kugler, Hyperfine Interact. 129, 23 (2000).
- Jokinen et al. (2003) A. Jokinen, M. Lindroos, E. Molin, and M. Petersson, Nucl. Instrum. Methods Phys. Res. B 204, 86 (2003).
- Mané et al. (2009) E. Mané et al., Eur. Phys. J. A 42, 503 (2009).
- Haynes (2013) W. H. Haynes, Handbook of Chemistry and Physics, 94th ed. (CRC, 2013).
- Fedosseev et al. (2012b) V. N. Fedosseev et al., Rev. Sci. Instrum. 83, 02A903 (2012b).
- Rothe et al. (2013) S. Rothe, V. N. Fedosseev, T. Kron, B. A. Marsh, R. E. Rossel, and K. D. A. Wendt, Nucl. Instrum. Methods Phys. Res. B 317, Part B, 561 (2013).
- Rossel et al. (2013) R. E. Rossel, V. N. Fedosseev, B. A. Marsh, D. Richter, S. Rothe, and K. D. A. Wendt, Nucl. Instrum. Methods Phys. Res. B 317, Part B, 557 (2013).
- Lynch et al. (2013a) K. M. Lynch, T. E. Cocolios, and M. M. Rajabali, Hyperfine Interact. 216, 95 (2013a).
- Rajabali et al. (2013) M. M. Rajabali et al., Nucl. Instrum. Methods Phys. Res. A 707, 35 (2013).
- Dendooven (1992) P. Dendooven, Ph.D. thesis, IKS, KU Leuven (1992).
- Andreyev et al. (2010) A. N. Andreyev et al., Phys. Rev. Lett. 105, 252502 (2010).
- Elseviers et al. (2013) J. Elseviers et al., Phys. Rev. C 88, 044321 (2013).
- Lommel et al. (2002) B. Lommel, W. Hartmann, B. Kindler, J. Klemm, and J. Steiner, Nucl. Instrum. Methods Phys. Res. A 480, 199 (2002).
- Hennig et al. (2007) W. Hennig, H. Tan, M. Walby, P. Grudberg, A. Fallu-Labruyere, W. K. Warburton, C. Vaman, K. Starosta, and D. Miller, Nucl. Instrum. Methods Phys. Res. B 261, 1000 (2007).
- Flanagan et al. (2013) K. T. Flanagan et al., Phys. Rev. Lett. 111, 212501 (2013).
- (40) I. Budinc̆ević et al., (unpublished).
- Cocolios et al. (2013) T. E. Cocolios et al., Nucl. Instrum. Methods Phys. Res. B 317, Part B, 565 (2013).
- Lynch (2013) K. M. Lynch, Ph.D. thesis, The University of Manchester (2013).
- De Witte et al. (2005) H. De Witte et al., Eur. Phys. J. A 23, 243 (2005).
- Zhu and Kondev (2008) S. Zhu and F. G. Kondev, Nuclear Data Sheets 109, 699 (2008).
- Lourens (1967) W. Lourens, Ph.D. thesis, Technische Hogeschool Delft (1967).
- Ritchie et al. (1981) B. G. Ritchie, K. S. Toth, H. K. Carter, R. L. Mlekodaj, and E. H. Spejewski, Phys. Rev. C 23, 2342 (1981).
- Kondev and Lalkovski (2011) F. Kondev and S. Lalkovski, Nuclear Data Sheets 112, 707 (2011).
- Singh et al. (2013) B. Singh, D. Abriola, C. Baglin, V. Demetriou, T. Johnson, E. McCutchan, G. Mukherjee, S. Singh, A. Sonzogni, and J. Tuli, Nuclear Data Sheets 114, 661 (2013).
- Browne and Tuli (2011) E. Browne and J. Tuli, Nuclear Data Sheets 112, 1115 (2011).
- Gomez et al. (2008) E. Gomez, S. Aubin, L. A. Orozco, G. D. Sprouse, E. Iskrenova-Tchoukova, and M. S. Safronova, Phys. Rev. Lett. 100, 172502 (2008).
- Dzuba et al. (2005) V. A. Dzuba, W. R. Johnson, and M. S. Safronova, Phys. Rev. A 72, 022503 (2005).
- King (1963) W. H. King, J. Opt. Soc. Am. 53, 638 (1963).
- Lynch et al. (2013b) K. M. Lynch et al., EPJ Web of Conferences 63, 01007 (2013b).
- Ekström et al. (1986) C. Ekström, L. Robertsson, and A. Rosén, Phys. Scripta 34, 624 (1986).
- Stroke et al. (1961) H. H. Stroke, R. J. Blin-Stoyle, and V. Jaccarino, Phys. Rev. 123, 1326 (1961).
- Anselment et al. (1986) M. Anselment, W. Faubel, S. Göring, A. Hanser, G. Meisel, H. Rebel, and G. Schatz, Nucl. Phys. A 451, 471 (1986).
- Myers and Schmidt (1983) W. D. Myers and K.-H. Schmidt, Nucl. Phys. A 410, 61 (1983).
- Raman et al. (2001) S. Raman, C. N. Jr., and P. Tikkanen, Atomic Data and Nuclear Data Tables 78, 1 (2001).
- De Witte et al. (2007) H. De Witte et al., Phys. Rev. Lett. 98, 112502 (2007).
- Borchers et al. (1987) W. Borchers, R. Neugart, E. W. Otten, H. T. Duong, G. Ulm, and K. Wendt, Hyperfine Interact. 34, 25 (1987).
- Bastug et al. (1996) T. Bastug, B. Fricke, M. Finkbeiner, and W. R. Johnson, Z. Phys. D 37, 281 (1996).
- Neugart et al. (1985) R. Neugart, H. H. Stroke, S. A. Ahmad, H. T. Duong, H. L. Ravn, and K. Wendt, Phys. Rev. Lett. 55, 1559 (1985).
- Stone (2011) N. Stone, Table of Nuclear Magnetic Dipole and Electric Quadrupole Moments (Nuclear Data Services, International Atomic Energy Agency, Vienna, Austria, 2011).
- Barzakh et al. (2012) A. E. Barzakh, L. K. Batist, D. V. Fedorov, V. S. Ivanov, K. A. Mezilev, P. L. Molkanov, F. V. Moroz, S. Y. Orlov, V. N. Panteleev, and Y. M. Volkov, Phys. Rev. C 86, 014311 (2012).
- Neyens (2003) G. Neyens, Rep. Prog. Phys. 66, 633 (2003).
- Wouters et al. (1991) J. Wouters, N. Severijns, J. Vanhaverbeke, and L. Vanneste, J. Phys. G: Nucl. Part. Phys. 17, 1673 (1991).
- Ahmad et al. (1983) S. A. Ahmad, W. Klempt, R. Neugart, E. W. Otten, K. Wendt, and C. Ekström, Physics Letters B 133, 47 (1983).
- Duppen et al. (1991) P. V. Duppen, P. Decrock, P. Dendooven, M. Huyse, G. Reusen, and J. Wauters, Nucl. Phys. A 529, 268 (1991).
- Kondev (2008) F. G. Kondev, Nuclear Data Sheets 109, 1527 (2008).
- Chiara and Kondev (2010) C. J. Chiara and F. G. Kondev, Nuclear Data Sheets 111, 141 (2010).
- Martin (2007) M. J. Martin, Nuclear Data Sheets 108, 1583 (2007).
- Browne (2005) E. Browne, Nuclear Data Sheets 104, 427 (2005).
- Lynch et al. (2012) K. M. Lynch et al., J. Phys.: Conf. Ser. 381, 012128 (2012).