Optics of spin-noise-induced gyrotropy of asymmetric microcavity
Abstract
The optical gyrotropy noise of a high-finesse semiconductor Bragg microcavity with an embedded quantum well (QW) is studied at different detunings of the photon mode and the QW exciton resonances. A strong suppression of the noise magnitude for the photon mode frequencies lying above exciton resonances is found. We show that such a critical behavior of the observed optical noise power is specific of asymmetric Fabry-Perot resonators. As follows from our analysis, at a certain level of intracavity loss, the reflectivity of the asymmetric resonator vanishes, while the polarimetric sensitivity to the gyrotropy changes dramatically when moving across the critical point. The results of model calculations are in a good agreement with our experimental data on the spin noise in a single-quantum-well microcavity and are confirmed also by the spectra of the photo-induced Kerr rotation in the pump-probe experiments.
pacs:
78.67.Hc, 78.47.jd, 76.70.Hb, 73.21.LaI INTRODUCTION
Optical resonators comprised of two plane-parallel mirrors (Fabry-Perot cavities) play an important role in many optical applications and are studied in great detail, presently B&W . The growth of interest to this simple resonant system in the last decade is related to advances in technology of small-size optical resonators (microcavities) and possibility to place structures with material resonances inside the cavity (quantum wells or quantum dots), whose interaction with the optical mode of the microcavity gives rise to a number of interesting optical effects Kavokin .
Ability of the cavity to amplify various optical effects including the magneto-optical Faraday and Kerr rotation (see, e.g., Zap0 ; Kav1 ; Kav2 ) is highly valuable for the spin noise spectroscopy Zap ; Zap1 gaining, in the last years, especial popularity as a method of non-perturbative study of magneto-spin properties of atomic and semiconductor systems Crooker ; Os ; Mitsui . In the experiments of this kind (one of which will be considered below), the above ability of the microcavity makes it possible to observe the spin-induced gyrotropy noise of a thin inter-mirror gap, whose detection without microcavity would have been strongly humpered.
The microcavities currently used in experimental studies are, most frequently, asymmetric. A thorough analysis of their (unusual) polarization properties is important. In this paper, we study the dependence of the optical spin noise (OSN) spectra f1 ; Zap2 on the detuning of the microcavity photon mode with respect to the exciton resonance Glazov . Our experiments show that a shift of the photon mode frequency below the exciton resonance leads to a sharp increase in the sensitivity of the polarisation-dependent microcavity reflectivity to fluctuations of the gyrotropy, which cannot be simply ascribed to the finesse changes. We attribute this critical behavior to specific phase characteristics of the used asymmetric Bragg microcavity Salis ; f2 .
II EXPERIMENTAL
In this study, we used the sample described in Glazov , representing an asymmetric -microcavity (15 and 25 periods of GaAlAs/AlAs layers in the top and bottom mirrors, respectively) with a GaAs single QW (102/200/102 Å AlAs/GaAs/AlAs) in the center of the inter-mirror gap. In our experimental setup (Fig. 1), a monochromatic beam of tunable laser (1) transmitted through an attenuator and linear polarizer (2), was focused by lens (4) onto the sample (5) placed into a closed-cycle cryostat (6) cooling the sample down to 5 K. The beam reflected from the sample was directed to a polarimetric detector comprised of phase plate (9), polarization beamsplitter (Wollaston prism) (10), and broadband ( = 200 MHz) balanced detector (11).
The noise signal from the sample, as a rule, was observed in the presence of an additional illumination of the spot by a cw red light (photodoping) Glazov ; Rapaport2001 , created by a laser diode (8) (2 mW, 630 nm). Fluctuations of spin polarization of the carriers photo-generated in the cavity gave rise to fluctuations of the reflected beam polarization and appearance of the noise signal at the output of the photodetector (11). A typical experiment on spin noise spectroscopy Zap ; Crooker ; Os ; Mitsui implies studying the radio-frequency (RF) spectrum of this signal as a function of the transverse magnetic field. This spectrum is detected using a spectrum analyzer and, in the simplest case, has a Lorentzian shape with its peak shifting linearly with magnetic field.
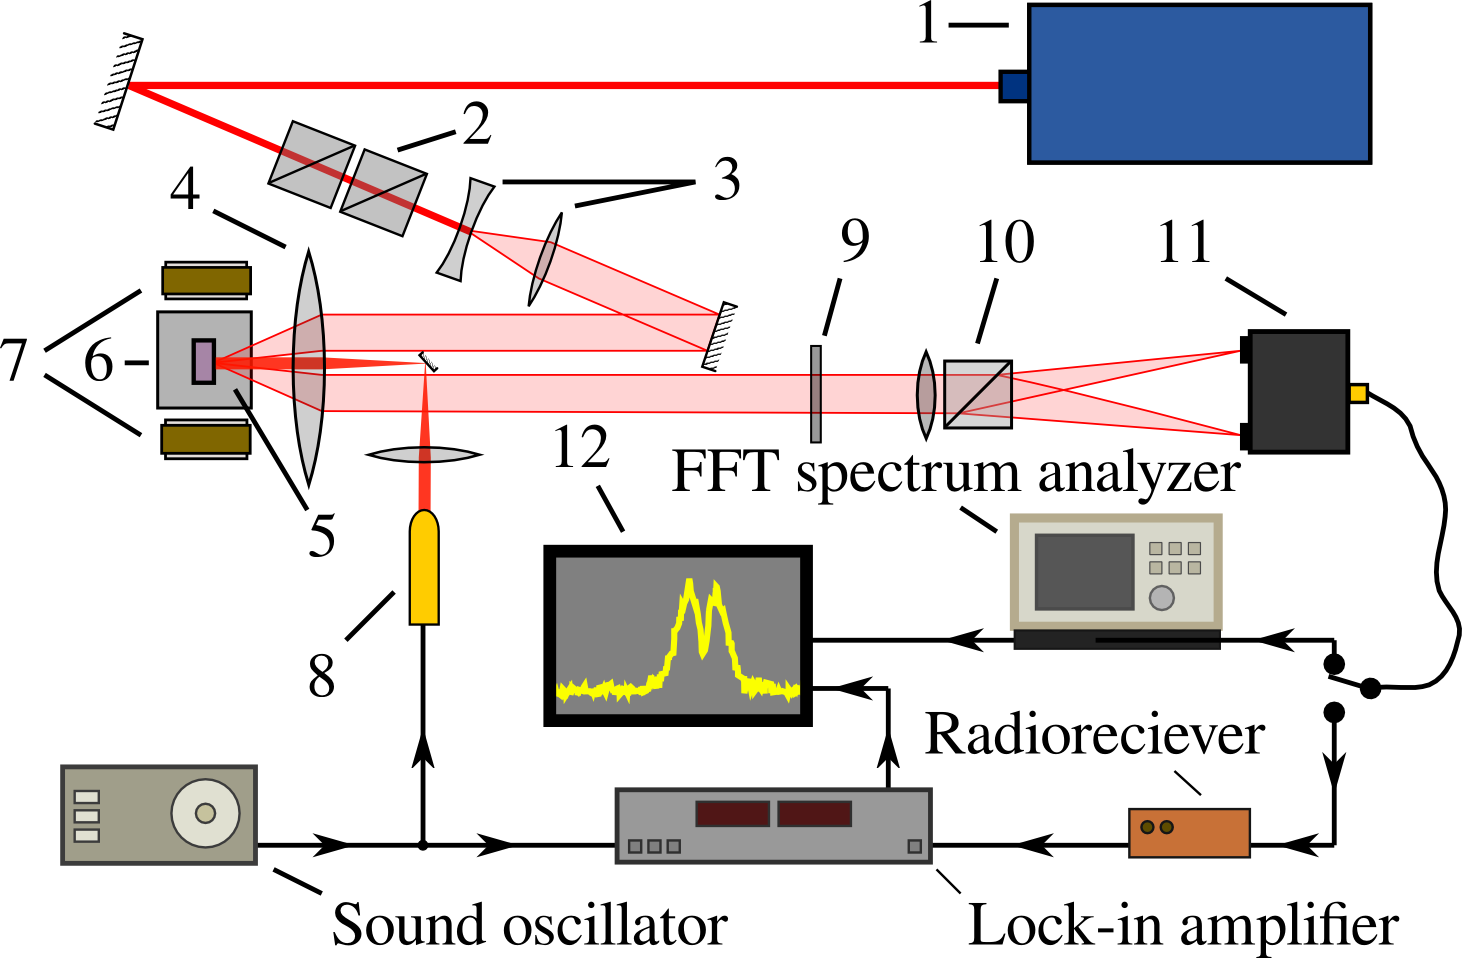
Since the task of this paper was to study optical (rather than RF) noise spectrum, the experiments were performed using a new scheme of the measurements. The output of the detector was fed not to a spectrum analyzer, but rather to a short-wavelength radioreceiver (resonant amplifier with an output detector) tuned to the frequency = 35 MHz. With the aid of a sound oscillator, the illumination was modulated at the frequency = 60 Hz. This modulation produced synchronous modulation of the noise with corresponding periodic signal at the output of the radioreceiver, with its amplitude proportional to that of the noise at the frequency 35 MHz. With the use of a lock-in amplifier (Fig. 1), we recorded the optical spin noise (OSN) spectrum, i.e., dependence of the above noise signal versus the wavelength of tunable laser (1). The experiments were performed at zero magnetic field, because the noise amplitude at the frequency 35 MHz, in this case, was high enough for its detection (due to the large width of the spin noise spectrum Glazov ).
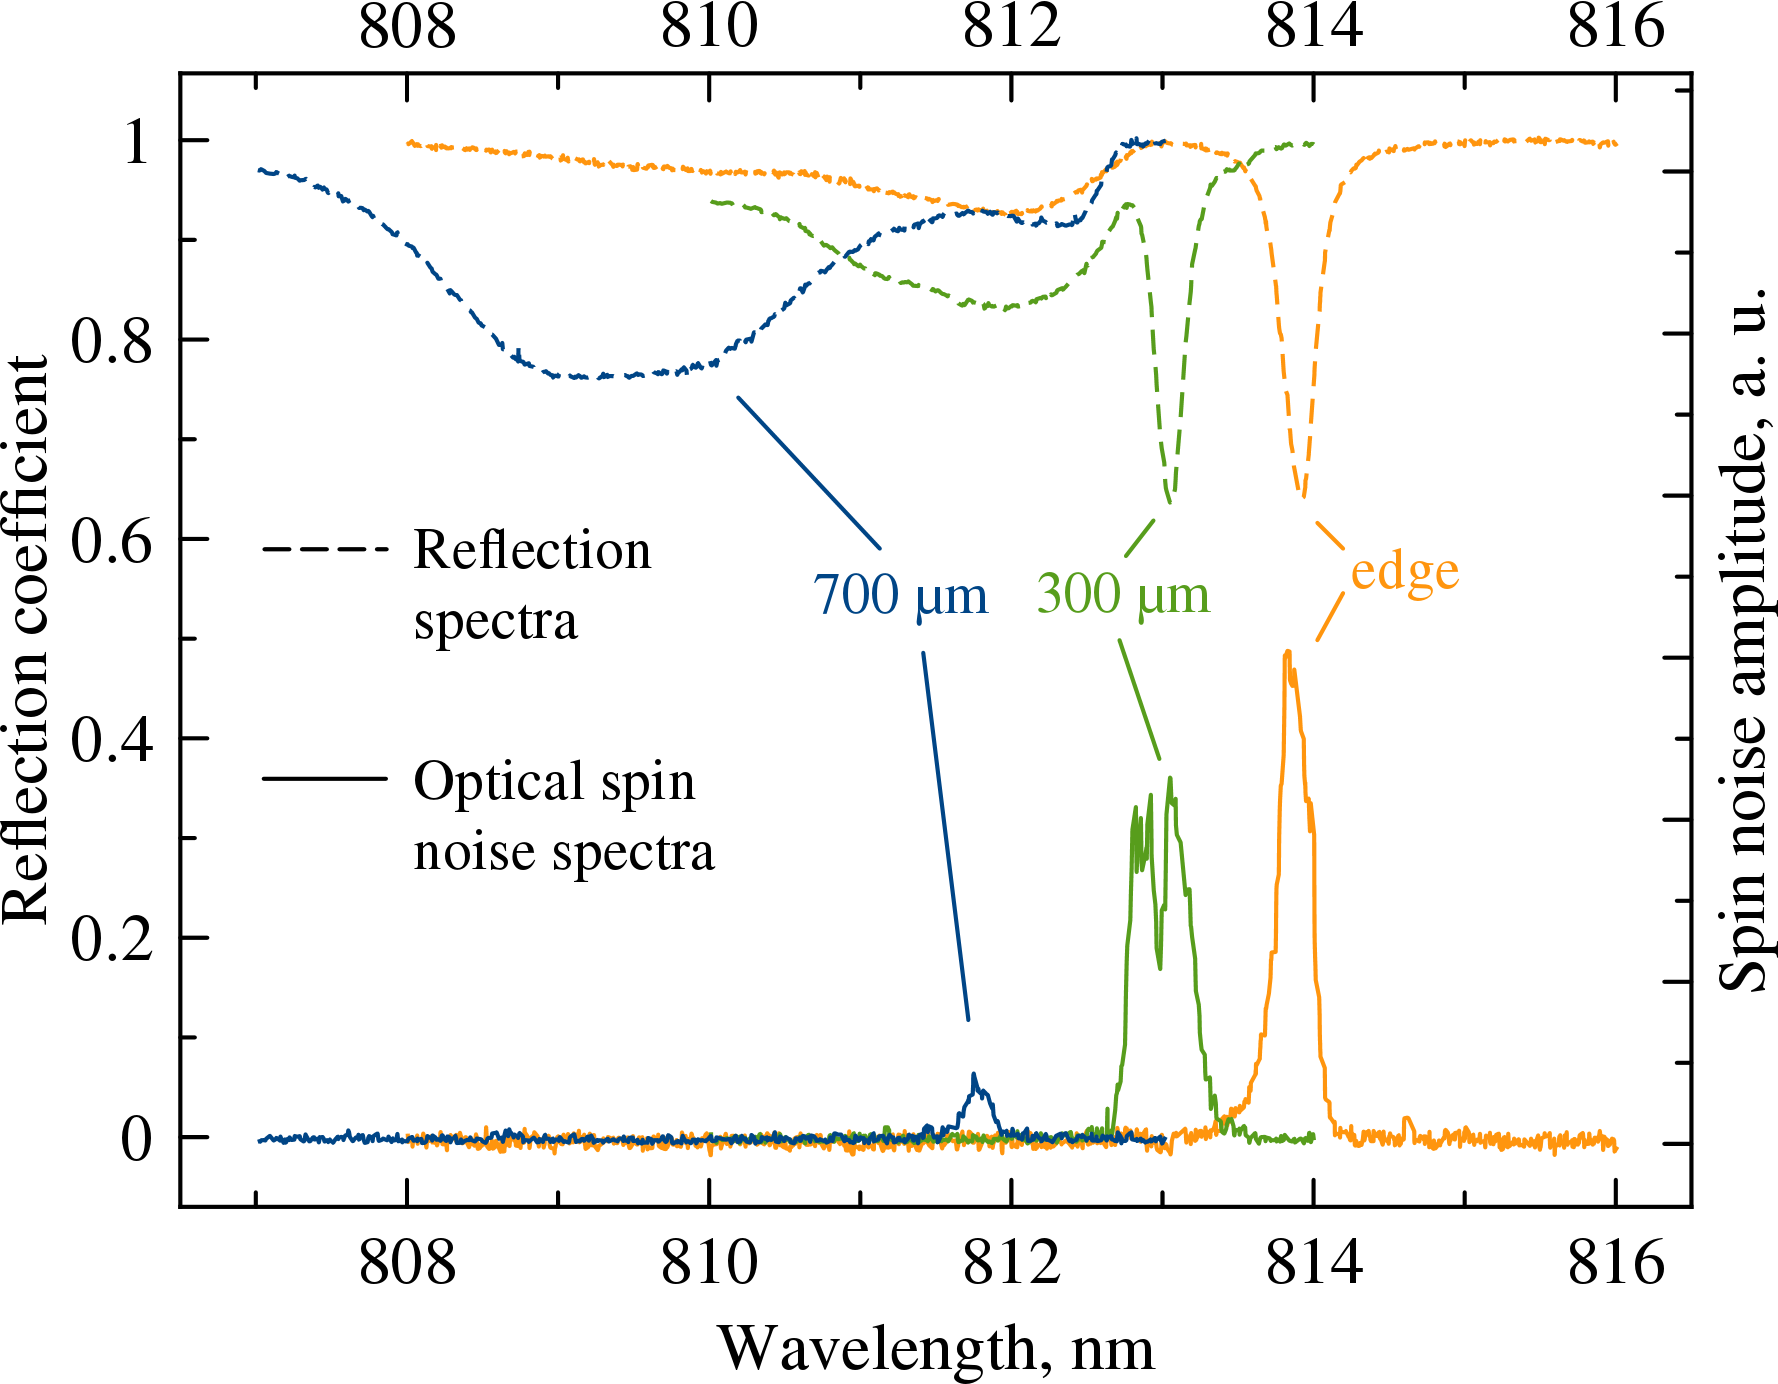
Figure 2 shows the OSN spectra obtained using the above method at different detunings of the photon mode of the cavity and the exciton resonance of the QW. Due to spatial gradient of the inter-mirror gap thickness, the photon mode frequency could be shifted by moving the light spot of the probe beam at the surface of the microcavity. It is seen from the figure that the evolution of the OSN spectrum with the photone mode frequency demonstrates three distinct regimes: (i) For the photon mode frequencies lying below the exciton resonance (the region of negative detuning), the OSN spectrum has a shape of a narrow peak with its spectral position coincident with that of the photon mode. In the spectral region of the QW exciton resonances (which are already noticeable in the reflectivity spectrum, see Fig. 2, upper curves), the OSN spectrum amplitude is vanishingly small. (ii) As the photon mode frequency approaches those of the exciton resonances (the region of anti-crossing of the polariton branches), the amplitude of the OSN spectrum decreases, while its shape deviates from monomodal, with arising two (or three) peaks. Spectral position of the peaks is close to position of the photon mode of the microcavity. In the spectral region of the QW exciton resonances, amplitude of the OSN spectrum remains small. (iii) When the photon mode frequency starts to exceed those of the exciton resonances (the region of positive detuning), the OSN spectrum amplitude falls down to unobservable level. The amplitude of the reflectivity spectrum for this region of the sample is about 30 - 50 lower than for the region with negative detuning. Note that the width of the photon resonance, in the reflectivity spectrum, for the region with a positive detuning is by a factor of 3 - 4 larger than for the region with a negative detuning (the reflectivity spectra of different regions of the sample are given in Glazov ).
The sharp decrease of the OSN amplitude when passing from negative to positive detuning, pointed out in item (iii) is inconsistent with the decrease of the microcavity finesse and looks surprising. The main goal of this paper is to interpret this unusual behavior of the Kerr-rotation noise.
III DISCUSSION
In what follows, we assume, for simplicity, that the main role in the formation of the OSN spectra is played by fluctuations of gyrotropy of the inter-mirror gap as a whole, rather than only of the QW excitons. Since the transparent cavity material does not have any spectral features in the studied wavelength range, we may neglect, in our qualitative treatment, the spectral dependence of the gyrotropy responsible for the observed noise signal. This assumption is not indisputable, but the qualitative agreement of the model calculations with the experimental data evidence in its favor.
Formation of the polarimetric signal detected in our experiment can be presented in the following way. The linearly polarized beam incident upon the sample is a superposition of two circularly polarized components and of equal magnitudes. In the presence of gyrotropy in the microcavity, positions of resonant features of its reflectivity spectrum for the and components of the incident light appear to be shifted with respect to each other by the quantity proportional to this gyrotropy. Thus, at , the and components of the incident beam will experience, upon reflection, different phase shifts and different amplitude changes. The former corresponds to polarization plane rotation of the reflected beam, while the latter manifests the appearance of its ellipticity. Both types of the polarization changes in the reflected beam can be detected independently. In particular, if the phase plate (9) (Fig. 1) is half-wave (quarter-wave) and is oriented by its axis at the angle () with respect to the vertical, the output signal of the balanced detector (11) will be proportional to the polarization plane rotation angle (ellipticity) of the reflected beam. Note that, at a fixed frequency shift of the phase characteristics of reflectivity for the and components of the incident light, the changes in the reflected beam polarization will increase with increasing steepness of frequency dependence of these characteristics.
Thus, for interpretation of the above experiment, we have to analyze behavior of the complex reflection coefficient of the microcavity with variation of optical parameters of the cavity. This kind of analysis has been performed for interpretation of a number of other experiments (see, e.g. Salis ; Kav1 ; Kav2 ) and for development of interferometric devices with specific dispersion chahracteristics Tr1 ; Tr2 . The analysis presented below is aimed at interpretation of our particular spin-noise-related experiment.
As we have already mentioned, a specific feature of the microcavity used in our experiment is its asymmetry. The complex reflection coefficient of such a microcavity reveals a specific critical behavior, which can be qualitatively explained as follows.
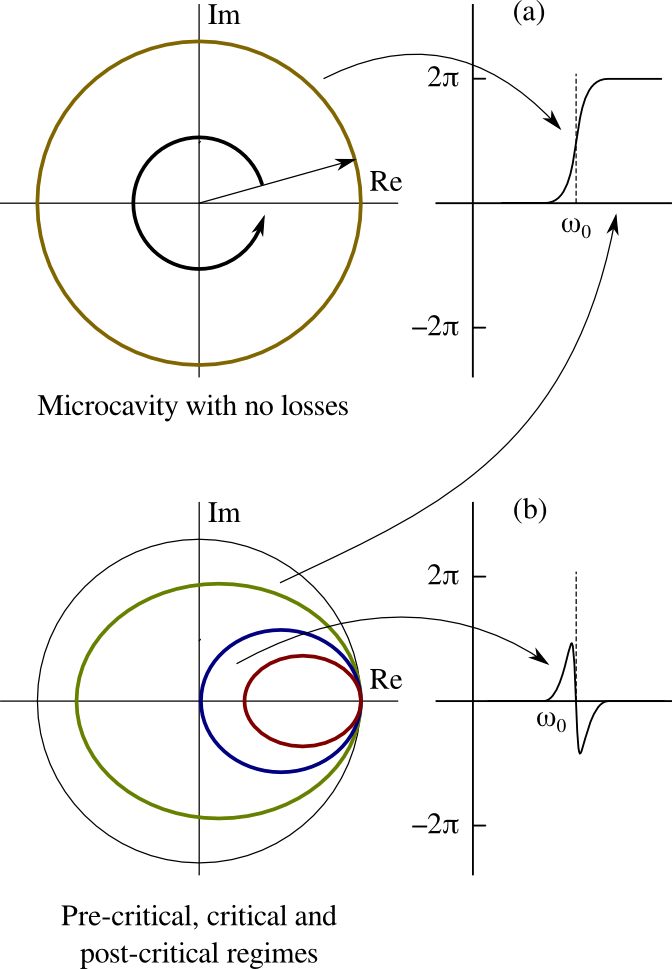
Consider an ultimately asymmetric cavity, with its bottom mirror having reflectivity exactly equal to unity, while reflectivity of the top mirror is slightly smaller. If the absorption in the inter-mirror gap and top mirror is absent, then the reflectivity module of such a cavity is unity at any frequency of the incident light. As can be shown by direct calculations, the phase of the reflection coefficient is zero (2) at frequencies much lower (higher) than the resonant one, and it rapidly changes from zero to 2 in the vicinity of the resonance whose spectral width is controlled by the cavity finesse, which, in turn, depends on the top mirror reflectivity. Thus, upon variation of the incident light frequency, the complex reflection coefficient can be represented by a vector which circumvents a full circle moving over it counter-clockwise from the real unity (Fig. 3,a).
Let us now assume that the cavity is filled by an absorbing material. In this case, at the frequencies far from the resonance, the reflectivity of the cavity will be controlled by reflectivity of the top mirror and, since we assume this mirror to be highly reflecting, will be, as before, close to unity. In the region of the resonance, the reflectivity will reveal a small dip connected with absorption in the inter-mirror gap. As a result, dynamics of the complex reflection coefficient, upon passing the resonance, will differ from that for the above ultimate cavity: the corresponding complex vector will now circumvent a certain oval lying inside the above unity circle (Fig. 3,b). If the absorption in the cavity is not high, this oval will not much differ from the unity circle, and the increment of the phase of the reflection coefficient, upon passing through the resonance, as before, will be equal to 2. With further growth of the absorption, the oval will contract to the point of real unity, because, even at very high absorption in the cavity, the reflectivity far away from the resonance will be determined by the top highly reflecting mirror. It follows herefrom that, at some critical value of the absorption, the oval will pass through the coordinate origin and will appear to be entirely at the right side of this point (Fig. 3,b). It is seen from Fig. 3,b that, after that, the total increment of the phase of the reflection coefficient, upon passing through the resonance, turns into zero. This means that the phase, which changes monotonically, in the pre-critical regime, from 0 to (Fig.3, right plot), will experience, in the post-critical regime, a relatively small () sign-alternating change (Fig. 3,b, right plot).
As was already noted, the gyrotropy of the inter-mirror gap gives rise to mutual shift of the phase of the reflection coefficients for the and components of the incident light, with magnitude of the polarimetric signal being higher for steeper phase characteristics. Since the phase of the reflection coefficient of the pre-critical cavity (Fig. 3,a) is much steeper than of the post-critical one (Fig. 3,b), one can expect that the polarimetric signal of the pre-critical cavity will be much larger than that of the post-critical one. Besides, the transition of the cavity through the critical point should be accompanied by a change of optical spectrum of the polarimetric signal, because this spectrum (at least, qualitatively) is controlled by the frequency derivative of the phase of the reflection coefficient. In the pre-critical regime, the phase is monotonic, which leads to monomodal shape of optical spectrum of the polarimetric signal. In the post-critical regime, the non-monotonic dependence of the phase over the detuning should result in the sign-alternating shape of spectrum of the polarimetric signal.
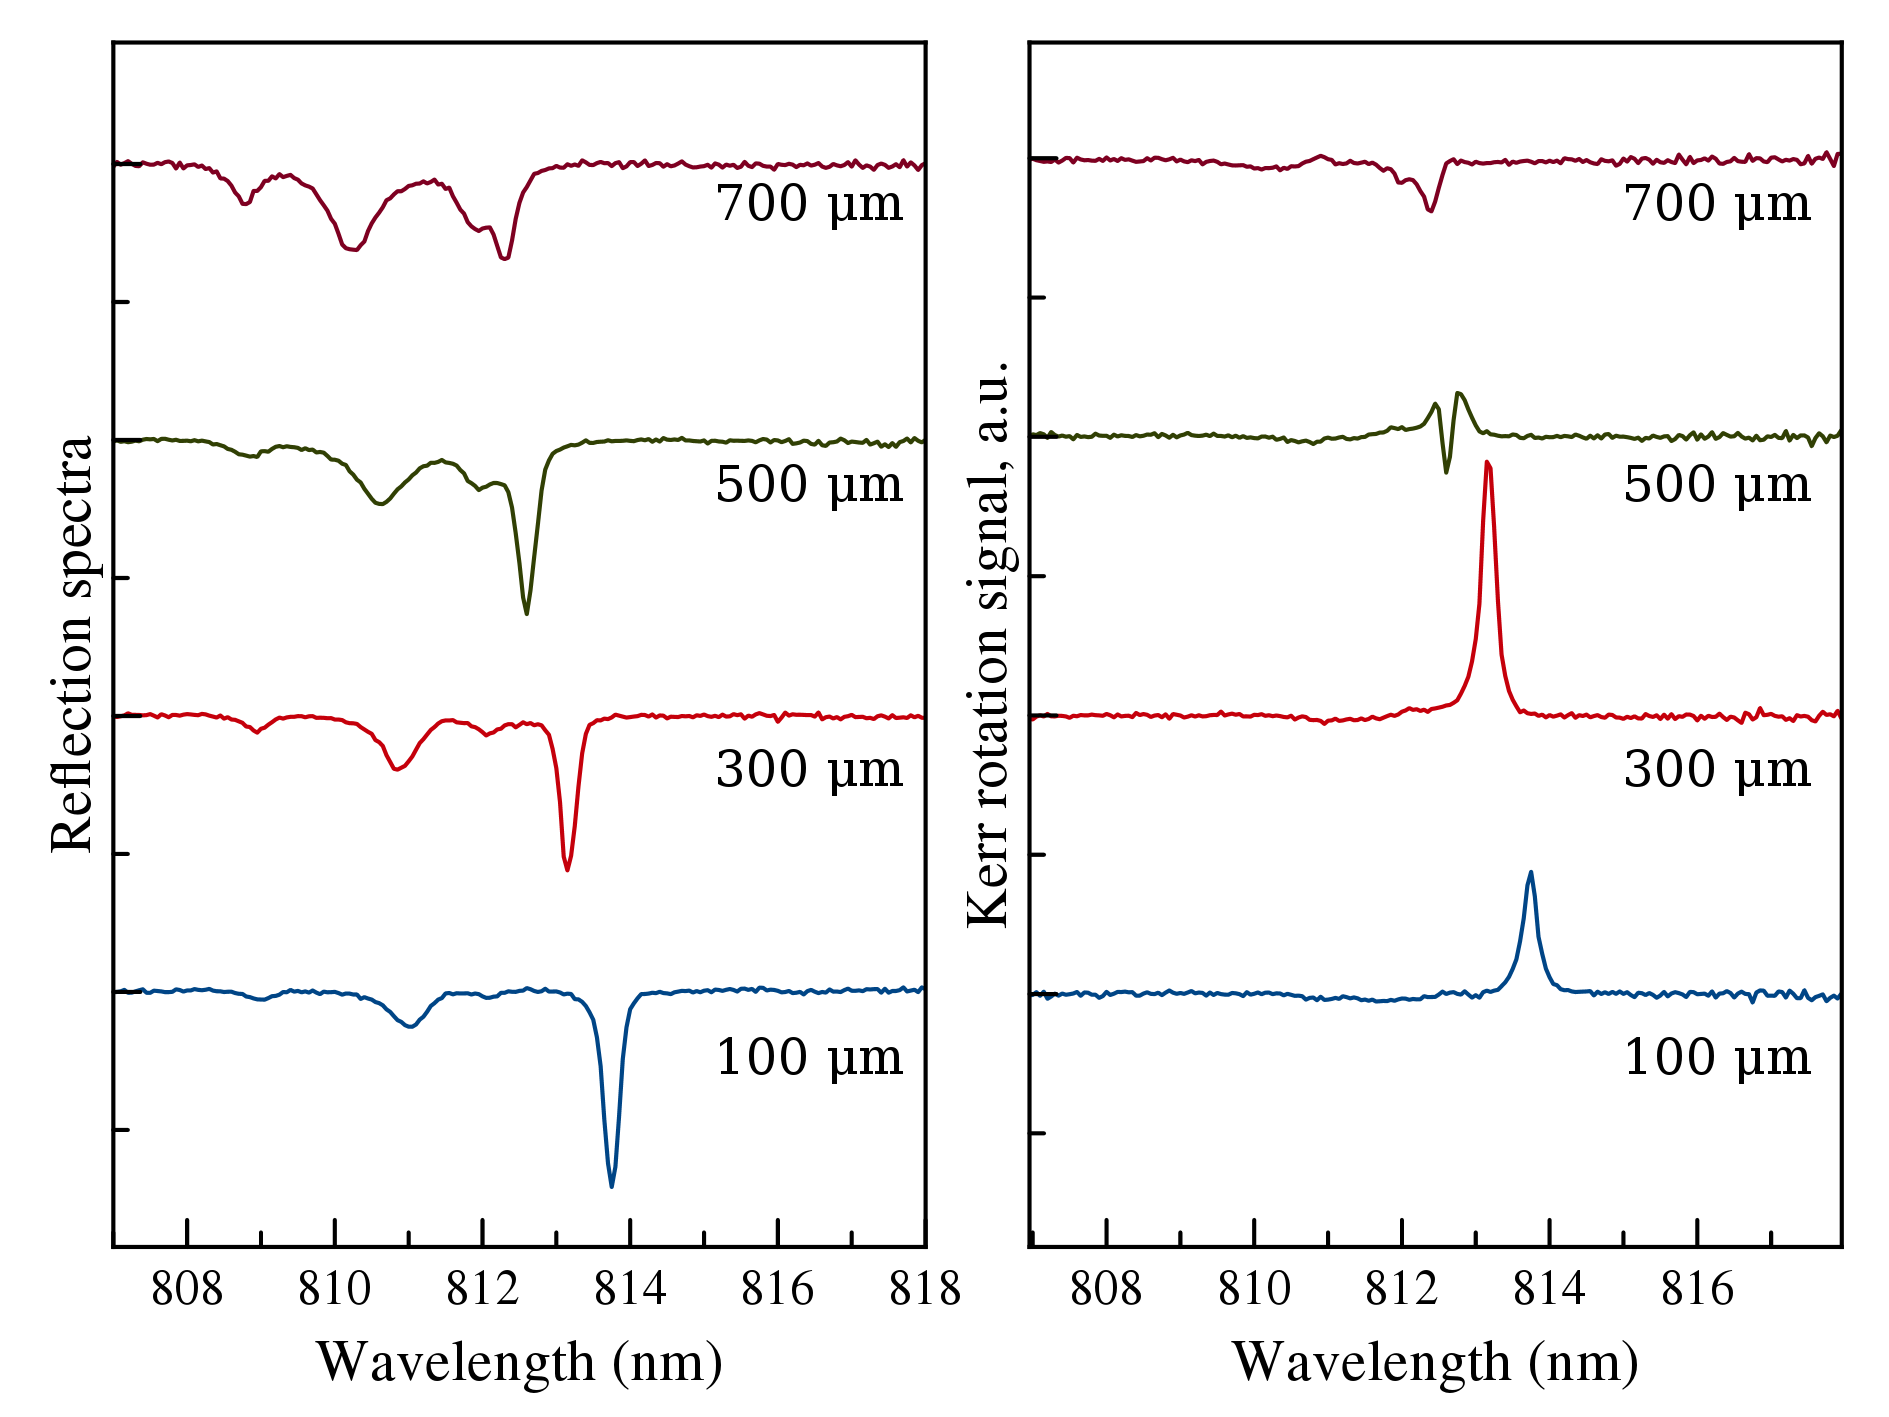
The property of the asymmetric cavity described above seems to be important for the following reasons. First, the Bragg microcavity used in our experiments is essentially asymmetric (15 periods in the top mirror and 25 periods in the bottom one), and the above reasoning is applicable to it. Second, when spectral position of the photon mode moves towards shorter wavelengths, absorption in the microcavity increases: this is confirmed by more than three-fold broadening of the photon-mode-related line in the reflectivity spectrum. And, finally, third, the observed evolution of the optical spectra of Kerr rotation from monomodal to sigh-alternating (Fig. 4) also correlates with passing of the used asymmetric microcavity through the critical point.
For all the above reasons, the sharp fall in the OSN amplitude observed in our experiment can be attributed to passing through the above critical point of the microcavity. The direct model calculations described in the next section support this supposition.
IV MODEL CALCULATIONS
Since the angle of incidence of the laser beam, in our experiments, was small ( 5o), we will assume the incidence to be normal, in the model. Let us denote by the complex reflection coefficient of the microcavity in the absence of gyrotropy in the inter-mirror gap. With appearance of the gyrotropy, the reflection coefficients for the polarizations become different, and . The calculations show that, if the beam incident on the microcavity is polarized vertically, the output signal of the balanced detector (11) (Fig. 1) is given by the relationship
| (1) |
where is the phase shift introduced by plate (9) and is the angle of tilt of its axis with respect to the vertical. By choosing the angle , the contribution to the signal independent of (first line in Eq. (1)) can be vanished. For detecting fluctuations of the Kerr rotation (ellipticity) of the reflected beam, the phase plate (9) is chosen half-wave (quarter-wave). In this case, the detected signal can be presented in the form .
Calculation of the OSN spectrum was started from calculation of the reflection coefficient entering into (1) and was performed using the standard transfer matrix technique B&W , with the QW susceptibility taken in the model of independent electron-hole pairs:
| (2) |
where = 1.516 eV is the lowest frequency of transition between the 2D electron and hole sub-bands of the QW, = 0.001 eV is the damping constant, and is the optical frequency. The parameters = 34 and = 3 were chosen to obtain a qualitative agreement between the experimental and calculated reflectivity spectra f3
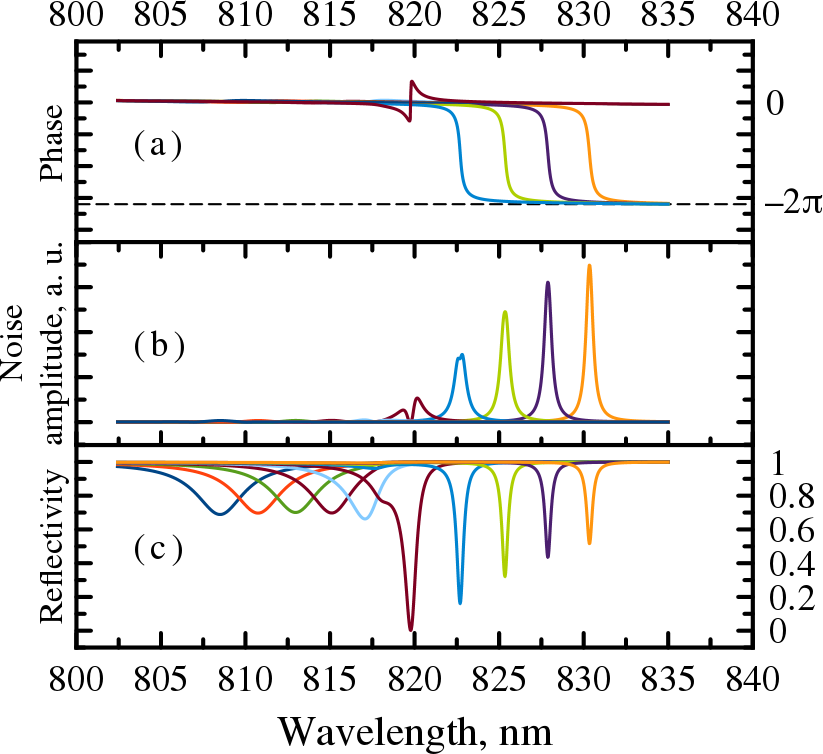
At the next step, the permittivity of the inter-mirror gap was privided with a small increment () corresponding to noise fluctuation of the gyrotropy , and the corresponding change of the reflection coefficient was calculated. After that, the OSN spectrum of the Kerr rotation (ellipticity) was calculated using Eq. (1) at = () in the range of the optical frequencies . The results of the calculations are given in Fig. 5, which shows a family of the phases of reflection coefficients (a), the OSN spectra of the Kerr rotation (b), and the reflectivity spectra (c) at different frequencies of the photon mode. The photon mode was shifted by changing the cavity width within the range of 6%. It is seen from Fig. 5 that, at the frequency of the photon mode below , the resonant absorption of the microcavity is small, and it lies in the pre-critical regime. This is indicated by monotonic behaviour of the phase (Fig. 5,a) varying within the interval from 0 to . In this case, the OSN spectra have a monomodal shape and large amplitude (Fig. 5,b). As the frequency of the photon mode approaches , the absorption in the microcavity increases, the cavity passes through the critical point, and the phase of the reflection coefficient becomes sign-alternating (Fig. 5,a). It is also seen from Fig. 5,b, that the shape of the OSN spectrum becomes, in this case, bimodal, and its amplitude decreases. After passing through the critical point, the reflectivity spectrum broadens by a factor of 3-4 and slightly drops in amplitude, while the amplitude of the noise spectrum decreases dramatically. Thus, the evolution of the calculated OSN spectra is characterized by three regimes listed in the end of Section "Experimental". Qualitative agreement between the behavior of the calculated and experimental OSN spectra confirms the validity of our model.
V CONCLUSIONS
We have studied the behavior of the Kerr rotation noise spectrum of light reflected from an asymmetric Bragg -microcavity with an embedded GaAs quantum well for different detunings between the photon mode and exciton resonances. The Kerr rotation noise has been found to exibit an unusual critical dependence on the detuning. At negative detunings, the OSN spectrum shows a relatively high amplitude and monomodal shape. When passing to positive detuning, the shape of the spectrum is getting more complicated, and the amplitude of the signal sharply drops. The effect is explained by the fact that the phase of the reflection coefficient of the used asymmetric cavity, when passing to positive detuning, shows critical change of its steepness. The results of this paper show that the cavity-enhancement of the Kerr (or Faraday) rotation in an asimmetric microcavity may strongly depend on its phase characteristic. This critical dependence of convertion of intra-cavity girotropy to the polarisation-plane rotation may be highly important for experimental studies of spin noise and other effects of cavity enhanced optical anisotropy.
VI Acknowledgements
The financial support from the Russian Ministry of Education and Science (contract No.11.G34.31.0067 with SPbSU and leading scientist A. V. Kavokin) is acknowledged. This work has been partially funded by Skolkovo Institute of Science and Technology (Skoltech) in the framework of the SkolTech/MIT Initiative. It was carried out using the equipment of SPbU Resource Center "Nanophotonics" (photon.spbu.ru).
References
- (1) M. Born and E. Wolf, Principles of Optics, Cambridge University Press, 2005.
- (2) A. Kavokin, J. Baumberg, G. Malpuech, F. Laussy, Microcavities, Clarendon Press Oxford, 2006.
- (3) V. S. Zapasskii and S. G. Przhibelskii, Opt. Spectrosc.,110, 917 (2011).
- (4) A. V. Kavokin, M. R. Vladimirova, M. A. Kaliteevski, O. Lyngnes, J. D. Berger, H. M. Gibbs, and G. Khitrova, Phys. Rev. B 56, 1087 (1997).
- (5) M. A. Kaliteevski, A. V. Kavokin, P. S. Kop’ev, 31, 747 (1997).
- (6) E. B. Aleksandrov and V. S. Zapasskii, J. Exp. Theor. Phys. 54, 64 (1981).
- (7) V. S. Zapasskii, Adv. Opt. and Phot.,5, 131 (2013).
- (8) S. A. Crooker, D. G. Rickel, A. V. Balatsky, and D. Smith, Nature 431, 49 (2004).
- (9) G. M. Müller, M. Oestreich, M. Römer, and J. Hubner, Physica E 43, 569 (2010).
- (10) T. Mitsui, Phys.Rev. Lett. 84, 5292 (2000).
- (11) Here, we mean dependence of the noise power on wavelength of a quasi-monochromatic laser beam, whose polarization noise is detected.
- (12) V. S. Zapasskii, A. Greilich, S. A. Crooker, Y. Li, G. G. Kozlov, D. R. Yakovlev, D. Reuter, A. D. Wieck, and M. Bayer, Phys. Rev. Lett. 110, 176601 (2013).
- (13) S. V. Poltavtsev, I. I. Ryzhov, M. M. Glazov, G. G. Kozlov, V. S. Zapasskii, A. V. Kavokin, P. G. Lagoudakis, D. S. Smirnov, and E. L. Ivchenko, arXiv:1311.6587v1 [cond-mat.mes-hall] 26 Nov 2013.
- (14) G. Salis, and M. Moser, Phys. Rev. B, 72, 115325 (2005).
- (15) Under asymmetry we understand difference between the number of pairs in the top and bottom Bragg mirrors.
- (16) R. Rapaport, E. Cohen, A. Ron, E. Linder, and L. N. Pfeiffer, Phys. Rev. B, 63, 235310 (2001).
- (17) Yu. V. Troitsky, Opt. Spectrosc., 87, 133, (1999).
- (18) Yu. V. Troitsky, Opt. Eng., 34, 1503 (1995).
- (19) Susceptibility of a real QW contains along with (2), a resonant excitonic contribution. However, the effect of this contribution, at large positive and negative detunings is small, and its account, as show the calculations, does not change qualitatively the ON spectrum.