Current address:]University of Kentucky, Lexington, KY 40506
Current address:]Institut de Physique Nucléaire ORSAY, Orsay, France Current address:]Universidad Técnica Federico Santa María, Casilla 110-V Valparaíso, Chile Current address:]Old Dominion University, Norfolk, VA 23529 Current address:]Mathworks, Natick, MA 01760 Current address:]Institut de Physique Nucléaire ORSAY, Orsay, France Current address:]Universita’ di Roma Tor Vergata, 00133 Rome Italy Current address:]Universita’ di Roma Tor Vergata, 00133 Rome Italy
The CLAS Collaboration
Beam-spin Asymmetries from Semi-inclusive Pion Electroproduction
Abstract
We have measured the moment corresponding to the polarized electron beam-spin asymmetry in SIDIS. is a twist-3 quantity providing information about quark-gluon correlations. Data were taken with the CLAS Spectrometer at Jefferson Lab using a 5.498 GeV longitudinally polarized electron beam and an unpolarized liquid hydrogen target. All three pion channels (, and ) were measured simultaneously over a large range of kinematics within the virtuality range 1.0-4.5 GeV2. The observable was measured with better than 1% statistical precision over a large range of , , , and , which permits comparison with several reaction models. The discussed measurements provide an upgrade in statistics over previous measurements, and serve as the first evidence for the negative sign of the moment.
I Introduction
For decades, experiments in deep-inelastic scattering (DIS) have mapped out the momentum distributions in the nucleon in terms of one-dimensional parton distribution functions (PDFs). While these measurements provided significant insight into the nucleon structure, some questions arose that could not be addressed in this one-dimensional picture. Most notably, the EMC experiment at CERN emc found that the quark-spin contribution to the proton’s spin is only about 30. Recent measurements of the gluon contribution to the proton spin have shown this contribution to be too small to to saturate the spin sum rule collaboration:2011fga ; Adamczyk:2012qj ; Adare:2008aa ; deFlorian:2009vb . These results necessitate an understanding of the orbital motion of quarks in the proton.
In recent years, the hadronic physics community has extended the investigation of partonic structure of hadrons beyond the collinear PDFs by exploring the parton’s motion and its spatial distribution in the direction perpendicular to the parent hadron’s momentum. Two sets of non-perturbative functions have been introduced to investigate and describe the structure of hadrons at the quark-gluon level. Transverse momentum dependent parton distributions (TMDs) carry information on the longitudinal and transverse momentum distributions. Generalized parton distributions (GPDs) carry information on the longitudinal momentum distribution and the transverse positions of the partons. GPDs and TMDs are connected through the Wigner distribution functions Belitsky:2003nz or Generalized Transverse Momentum Distributions (GTMDs) Meissner:2008xs ; Lorce:2011dv and provide complete description of the threedimensional structure of the nucleon.
Measurements of azimuthal moments, in particular the single spin asymmetries (SSAs), have emerged recently as a powerful tool to probe the nucleon structure through measurements of GPDs and TMDs in hard exclusive and semiinclusive electroproduction of mesons and photon, respectively. Pion electroproduction in semi-inclusive DIS (SIDIS), when a final state pion is detected with the final state lepton, is an important tool for studying the TMD of partons. Assuming single photon exchange, the differential cross section for this process is written as a product of leptonic and hadronic tensors:
| (1) |
where is the fraction of the proton’s momentum that is carried by the struck quark, is the energy fraction of the incoming lepton carried by the virtual photon, is the energy fraction of the virtual photon carried by the outgoing hadron, is the transverse momentum of the final state hadron, and is the virtuality of the collision. The leptonic tensor is and the hadronic tensor is .
The SIDIS cross section for single pion electroproduction may be expressed as a function of the angle between the leptonic and hadronic scattering planes, which is described by the Trento convention Bacchetta:2004jz , as shown in Fig. 1. The expression for the cross section for an unpolarized target can be written as
| (2) |
where is the electron beam helicity and is a normalization that will cancel from the asymmetry. The coefficients , , and are the three moments of the cross section. The subscripts on the three coefficients denote the beam polarization first ( represents unpolarized and represents longitudinally polarized) and target polarization second (all are for unpolarized). Each of the three moments in the cross section may be written in a model-independent way as a set of structure functions Bacchetta:2006tn , each of which is related to a specific set of TMDs and fragmentation functions.
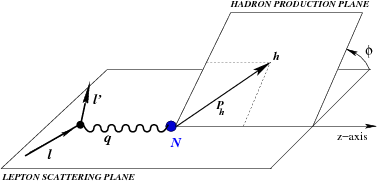
The presented measurement is of the third moment of the above cross-section , the only one of the three that is dependent on beam helicity. The helicity dependence of the term arises from the antisymmetric part of the leptonic tensor and the way it couples to the hadronic tensor. This moment can be written as the ratio of two structure functions, where the denominator represents the beam spin independent part Bacchetta:2006tn and the numerator is the structure function .
The structure function is related to quark-gluon-quark correlations in the proton, and can be expressed as a convolutions of distribution and fragmentation functions Levelt:1994np ; Bacchetta:2006tn . The twist of an operator is defined as the power with which the hadron mass scale occurs in a matrix element. Reference Jaffe:1996zw provides a working redefinition of twist to be two plus the power in which the ratio occurs where is the magnitude of the four momentum transferred (twist order =). Twist-2 is called leading twist and twist-3 is subleading twist because these terms are suppressed by . The twist-2 terms describe parton densities given by quark-antiquark correlators and the twist-3 term is the correlation of quark and gluon fields described by quark-gluon-quark correlators . intrinsically has a twist of order 3.
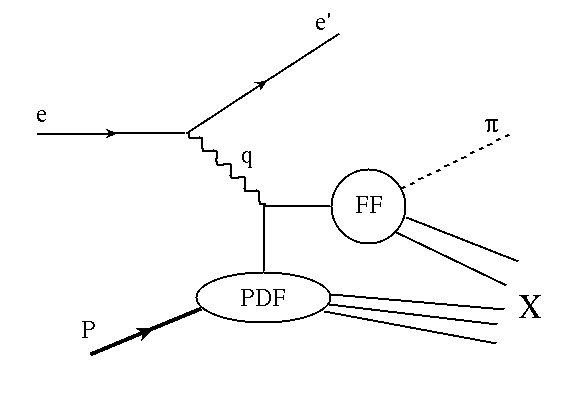
The structure function is composed of convolutions of parton distributions with fragmentation functions summed over quark flavor, as shown in Fig. 2:
| (3) |
This structure function was the subject of numerous theoretical and phenomenological studies Efremov:2002ut ; Schweitzer:2003uy ; Ohnishi:2003mf ; Afanasev:2003ze ; Yuan:2003gu ; Bacchetta:2004zf ; Metz:2004je ; Pijlman:2006vm ; Bacchetta:2006tn ; Lu:2012gu ; Mao:2012dk . Nevertheless, there is presently no satisfactory understanding of how much each function in Eq. 3 contributes. Of particular importance are the Boer-Mulders function , which is a leading twist naive time-reversal odd TMD Boer:1997nt , and , the twist-3 time reversal odd TMD Bacchetta:2004zf , which has been described as the higher-twist analog of the Sivers function Sivers:1990fh . is a chiral-odd twist-3 PDF Jaffe:1991ra . It has been suggested that the moment of could be related to the transverse force acting on the transversely polarized quarks in an unpolarized nucleon Burkardt:2009rf .
The moment also provides access to the twist-3 fragmentation functions, and , and the Collins function Collins:1992kk , , which has previously been seen to cause asymmetries of opposite sign for oppositely charged pions at Belle Seidl:2008xc , HERMES Airapetian:2010ds , and COMPASS Alekseev:2010rw .
Every term in the structure function can be shown to be a pure twist-3 term at leading order. Hence, the often used Wandzura-Wilczeck approximation, which neglects all interaction dependent parts in twist-3 terms in a structure function, is not valid in this case as it would demand that the entire asymmetry to be zero, which is not the case.
A sizeable beam-spin asymmetry in semi-inclusive pion electroproduction was predicted by F. Yuan Yuan:2003gu , arising from the convolution of the Boer-Mulders function with the twist-3 fragmentation function Jaffe:1991ra or by the convolution of the twist-3 T-odd TMD with the fragmentation function Metz:2004je ; Mao:2012dk . An asymmetry arising from the convolution of the Collins function with the chiral odd twist-3 TMD is described in Schweitzer:2003uy .
Recently, the twist-3 distributions have seen an increase in attention for their significant relationship to the quark orbital angular momentum Penttinen:2000dg ; Ji:2012ba ; Hatta:2012cs . Measurements of significant SSAs described by higher twist distribution and fragmentation functions indicate that multi-parton correlations are significant and their understanding is crucial for a complete description of the structure of the nucleon. Measurements of should provide access to twist-3 TMDs and fragmentation functions, improving our understanding of quark-gluon-quark correlators in the proton.
II Experiment
The current measurement at Jefferson Lab utilized a 5.498 GeV polarized electron beam with an average beam polarization of 0.750.03, incident upon an unpolarized liquid hydrogen target. Semi-inclusive pion electroproduction , where denotes undetected final-state hadrons, was observed, leading to asymmetry measurements with absolute uncertainties of 0.015 or less in all three pion channels (, and ). Measuring in all three channels simultaneously is important to reduce the experiment’s systematic uncertainty. The measurements were completed with the Continuous Electron Beam Accelerator Facility (CEBAF) Large Acceptance Spectrometer (CLAS) during the E1-f run period from April through June of 2003. An integrated luminosity of 21 was collected during the experiment.
The electron beam was provided by CEBAF, consisting of two linear accelerators that propel polarized electrons to a total energy of 5.498 GeV. The helicity of the electrons was flipped with a frequency of 33 Hz in order to minimize systematic effects. A half-wave plate was also used to periodically flip the helicity definitions between positive and negative in order to further negate any systematic uncertainty due to beam helicity. The beam polarization was measured frequently with a Mller polarimeter with a negligible statistical uncertainty.
The CLAS detector clasnim , shown in Fig. 3, was located in Hall-B. The detector was composed of four detector sub-systems in a layered configuration and divided into six sectors in the azimuthal angle, providing nearly 4 coverage. Particles were detected using drift chambers dcnim for tracking of charged particles, Čerenkov counters ccnim and electromagnetic calorimeters ecnim for electron identification, and time-of-flight detectors tofnim for hadron velocity measurements.
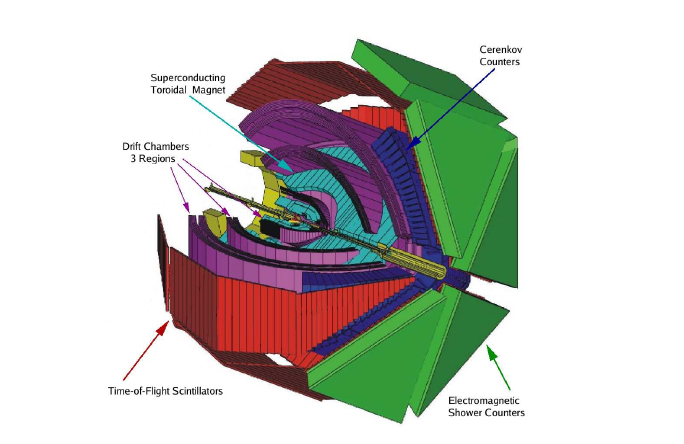
Charged particles traveled through CLAS in a curved trajectory due to a toroidal magnetic field. In the nominal configuration, many tracks were lost because they were bent out of the range of the CLAS acceptance. For E1-f, the CLAS torus magnet was run at 60 of its nominal current in order to maximize acceptance of tracks.
II.1 Electron identification
Electrons were identified in the CLAS using a series of cuts on signals from the Čerenkov counter (CC) and electromagnetic calorimeter (EC). Čerenkov cuts were applied for tracks that did not produce a high number of photoelectrons in the CC. Timing and position information were used to discriminate between electrons and minimum ionizing tracks such as a . These cuts were made in coincidence with cuts on the energy deposited in the EC, as well as position and timing information for each track.
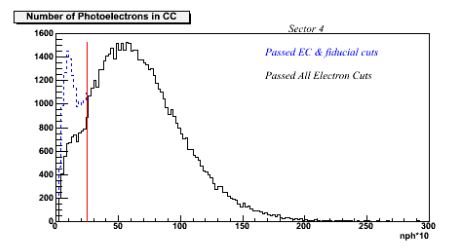
The CLAS Čerenkov counter used photomultipliers to count photons emitted from Čerenkov radiation in the detector. A threshold of 2.5 photoelectrons was established, above which each track was accepted as an electron, as shown in Fig. 4. If the number of photoelectrons ejected from the photocathode was less than 2.5, a series of other cuts were applied to the CC signal, including measurements of timing and position in the CC.
In the EC, a series of five cuts were used to discriminate between electrons and minimum ionizing particles, which were mostly negative pions. Cuts were made on the minimum momentum of an electron that could be seen due to the threshold of the calorimeter’s trigger discriminator, which removed electron candidates with momentum below 0.6 GeV. Cuts were also made on the sampling fraction, the energy deposited in the pre-radiator (inner) and total absorption (outer) regions of the calorimeter, the location of each hit in the EC, and a matching of the timing between hits in the EC and time-of-flight detectors.
Based on simple kinematic considerations, the sampling fraction, defined as the ratio of deposited energy over momentum as measured by the drift chambers, should be roughly constant in momentum. The sampling fraction was computed as a function of momentum in each of the six sectors of the CLAS, and each momentum slice was fit with a Gaussian to determine a mean and width of the distribution, as shown in Fig. 5. The cut was then computed as a function of momentum as , where is the mean of the Gaussian fits as a function of and is the function of the corresponding widths. The cut is asymmetric because there is a greater risk of pion contamination on the low side of the distribution than on the upper side.

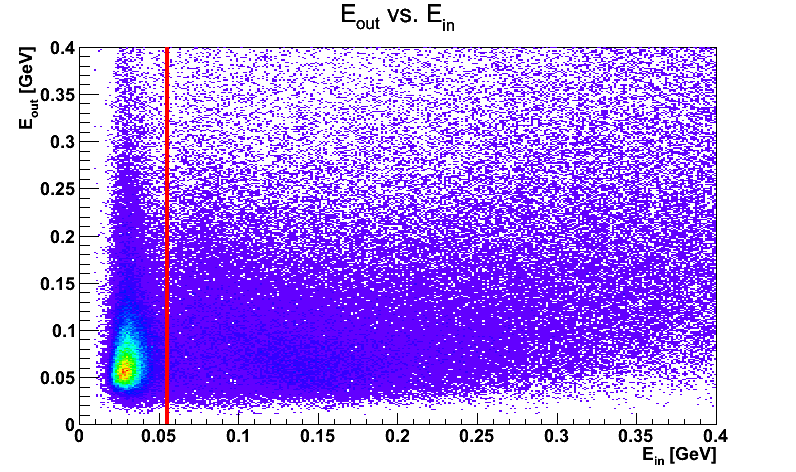
The CLAS EC was separated into inner and outer regions. An electron passing through the EC would shower, depositing a large amount of energy into the EC. Pions on the other hand are minimum ionizing particles, which deposited a much smaller amount of energy that was easily separated by placing a cut on the total energy deposited in the inner part of the EC, keeping only events with MeV, which is consistent with a 3 cut on the pion peak, as shown for one sector in Fig. 6.
Geometric cuts were placed on the EC hits to remove events near the edges of each calorimeter, where the shower leakage may occur, resulting in an incomplete energy measurement.
Cuts were made on the EC timing information by computing the difference in time between when the track hits the EC and when the same track hits the time-of-flight detector. Based on the known spatial separation between the detectors, this difference should be 0.7 ns. Events were accepted if their flight times were within 3 of a Gaussian fit to the distribution centered at 0.7 ns.
II.2 Charged pion identification
Charged hadrons were identified using the CLAS drift chambers and time-of-flight detectors. The drift chambers are used to measure the momentum of each track, and the particle’s velocity was measured by the time-of-flight detector. These two measurements combined to give an accurate separation between the different charged particle tracks. The tracks had to be separated from protons and both charged pion channels were distinguished from kaons.
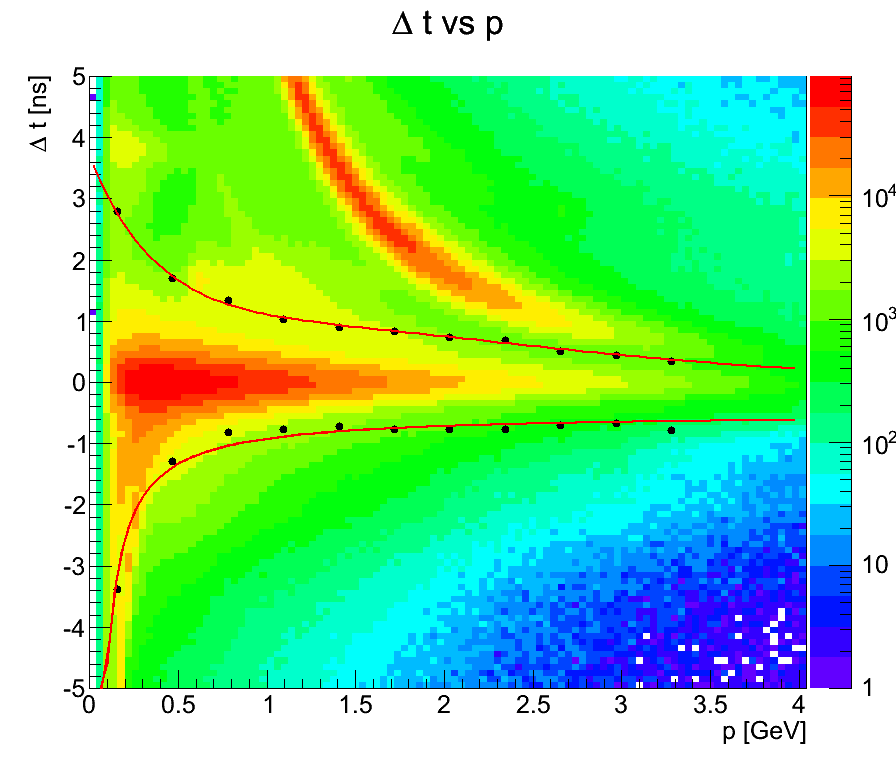
To perform the required separation of charged pions from heavier charged tracks, a quantity was computed as the difference between the time recorded for each hit in the time-of-flight detector (corrected for the event start time) and the expected time for a pion to hit the detector as calculated from the track’s momentum measured by the CLAS drift chambers. The calculated time is given by
| (4) |
where is the path length of the track from the production vertex to the timeofflight plane, is the speed of light, is the track’s momentum, and is the known pion mass. Fig. 7 shows the separation of the from the proton and kaon tracks.
For the tracks it was necessary to impose additional cuts to remove electron contamination. Cuts opposite to those used in the electron identification using the EC inner energy and number of photoelectrons in the CC are used.
II.3 Neutral pion identification
Neutral pions are identified via their primary decay mode, . Both photons are detected in the CLAS EC, and the invariant mass of the photon pair was computed to reconstruct the .
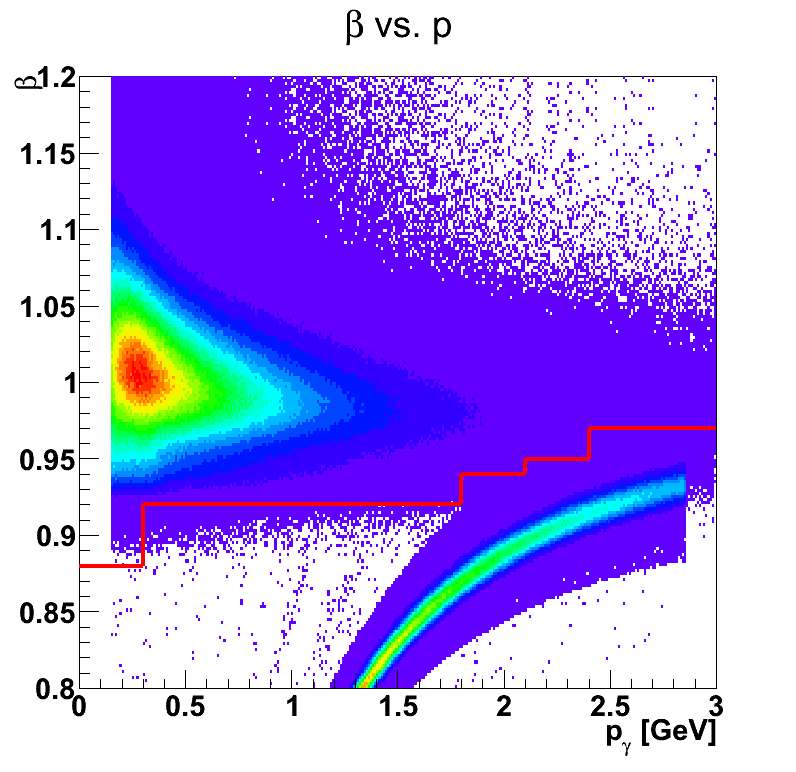
Photons are distinguished from neutrons by measuring the of each hit in the calorimeter, and performing a momentum dependent cut, as shown in Fig. 8, where was measured based on the EC hit-time as
| (5) |
where is the distance from the vertex to the EC hit, is the time measured by the calorimeter, is the start time of the event with respect to the machine radio frequency, and is the speed of light. A cut is necessary to remove events in which the angle between the two photons is smaller than the resolution of the EC, leading to an inaccurate reconstruction of the invariant mass, and another is made on the hit position in the calorimeter, which is similar to that used in the electron identification.
For events with the number of identified photons, , the invariant mass of each potential photon pair was binned by helicity, , and the remaining kinematic variables. Each bin was then fit with a Gaussian plus polynomial background to determine the number of events in each bin, as shown in Fig. 9. The background polynomial was of first, second, or third order depending on the shape of the background in that particular kinematic bin. It was ensured that the background function was the same for each helicity state in order to decrease the likelihood of an asymmetry arising due to differences in the background function. The number of (background subtracted) events in each kinematic bin were determined by integrating the Gaussian signal function, , over , where was the standard deviation of the Gaussian in that bin, and computing the number of events as shown in Eq. 6.
| (6) |

II.4 Kinematic coverage
The kinematic requirements for DIS are GeV and GeV2, where is the invariant mass of the final state and is the virtuality of the exchange photon, or four-momentum transfer squared, from the incident lepton to the target, given by and . Here is the 4-vector of the target and is the 4-vector of the incoming (outgoing) lepton.
The measurements were performed in terms of the kinematic variables , , , and . Here, is the momentum fraction carried by the quark in the proton, which is defined by . The variable is the momentum fraction carried away by the produced hadron, which is defined manifestly as a Lorentz scalar by , and is the transverse momentum of the outgoing hadron relative to .
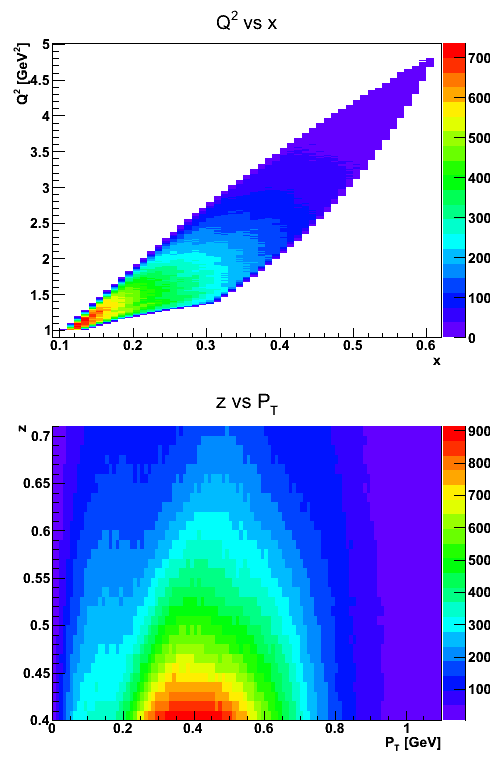
One advantage of performing the experiment in CLAS was the wide kinematic coverage available for analysis. Coverage in was available from 0.1 to 0.6, corresponding to a range from 1.0 GeV2 to 4.5 GeV2. Coverage in extends from our imposed minimum of 2 GeV to 3.1 GeV, and extends from 0 to 1 GeV. A cut was imposed on to select semi-inclusive events. Events with missing mass below 1.2 GeV are removed, which in conjunction with the cut on z effectively removed contamination from exclusive events such as . The full range of kinematic coverage for this experiment is shown in Fig. 10.
III Data Analysis
The data were analyzed by computing beam-spin asymmetries (BSAs), as shown in Eq. 7 in each kinematic bin. Here is the number of events from the positive helicity beam, is the number of events with the negative helicity beam, and is the average beam polarization.
| (7) |
Statistical uncertainties were computed for each BSA for charged pions, as
| (8) |
which was computed from the standard uncertainty on the number of events in each helicity state, . Uncertainties for BSAs include an additional factor to account for the background subtraction that slightly increases the uncertainty. The uncertainty on the beam polarization from the multiple Mller measurements was included in the systematic uncertainty.
The BSA was binned in ten bins in from 0 to 1 in order to see the -dependence, but when not looking at the dependence, cuts were applied to keep only to limit results only to the SIDIS kinematic region. After the z cut, the data were binned in five bins in from 0.1 to 0.6, five bins in from 0 to 1 GeV, and five bins in from 1 to 4.5 GeV2. The data were also analyzed using two-dimensional binning in and over the same ranges, since the accessible TMDs are functions of and (which can be approximately related to Schweitzer:2010tt ).
In each kinematic bin, the BSAs were binned in and fit to determine . The fitting function, , was derived from Eq. 2 as
| (9) |
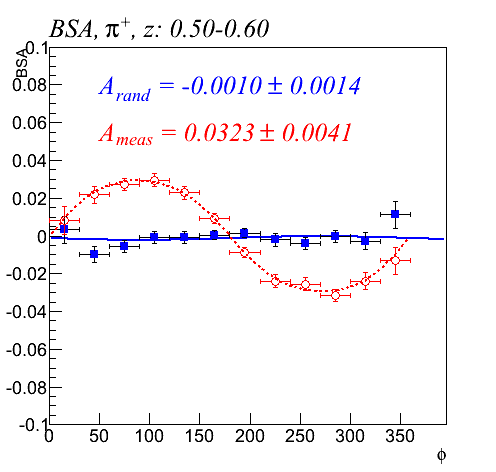
and the coefficient was extracted as the value of in each bin. An example of the fitting procedure is shown in Fig. 13. The systematic uncertainty due to the fitting process was checked by fitting with other functions such as or . It should be noted that the coefficients on were found to be consistent with zero.
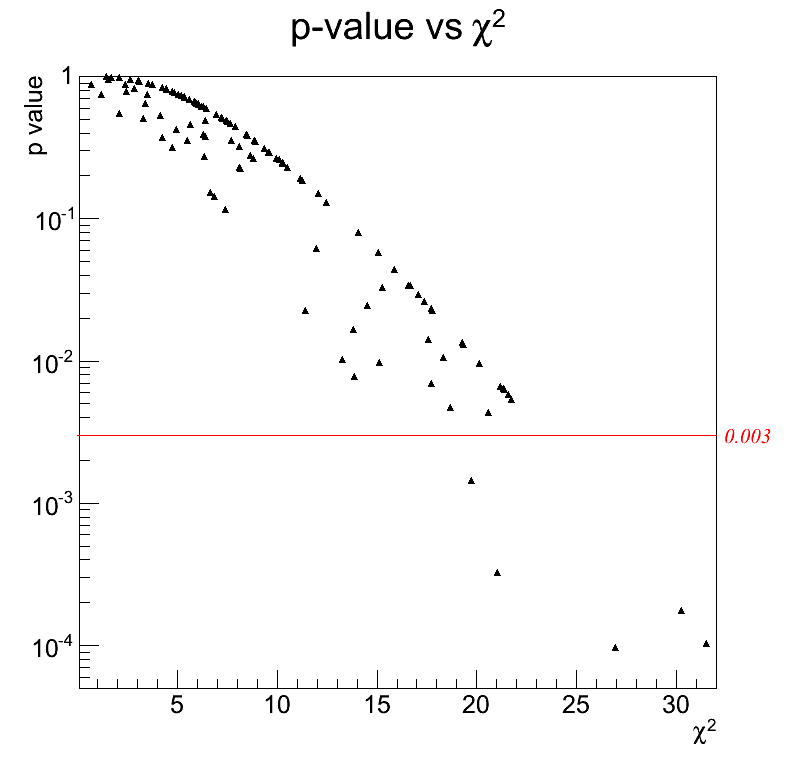
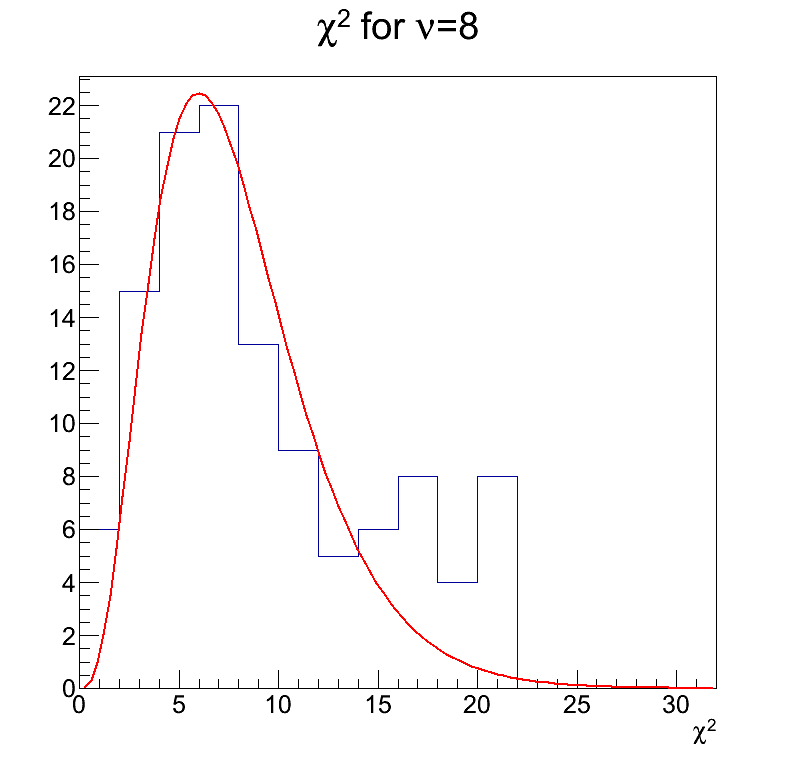
All fits were performed using a minimization with the TMinuit class in ROOT ROOT . Uncertainties on the fit coefficients were computed in MINUIT from the of each fit. The goodness-of-fit was evaluated by hypothesis testing. The null hypothesis was defined by the statement that the BSA distributions were consistent with our fit function. A significance level was set to 0.003, so if the fit in a particular bin returns a -value less than 0.003, the hypothesis was rejected, and that fit was removed from the analysis. A plot of the -values for each fit vs. is shown in Fig. 11, where the red line indicates our significance level. The removal of fits with a very low -value also served to remove fits with a higher than would be expected based on our statistics. The measured distribution was compared to the expected probability density function (p.d.f.) computed for eight degrees of freedom and normalized to our bin size and number of entries, as given by Eq. 10
| (10) |
The p.d.f. is written as , where is the . By definition, the mean of the distribution is eight for the degrees of freedom, and the leading coefficient is given by . The distribution was then scaled by a factor of to match the number of entries and bin size of the measured histogram. The plot of is shown in Fig. 12, and it can be seen that the measured distribution closely matches the expected distribution. The reduced between the two distributions is 1.37.
IV Systematic Studies
The systematic uncertainty was estimated to be smaller than or nearly equal to the statistical uncertainty in all measured kinematics. These estimations were carried out by varying the analytical techniques and measuring the resulting change in . The total systematic uncertainty due to these variations was estimated to be 0.006 for , 0.007 for , and 0.009 for . Table 1 gives the systematic uncertainty due to each variation for each pion channel. Contributions were estimated from acceptance effects and pion contamination to the identified electrons. The analysis was repeated using randomly generated helicity states, which gave an asymmetry consistent with zero.
| Sources of uncertainty | Average uncertainty | ||
|---|---|---|---|
| EC cut | 0.0017 | 0.0030 | 0.0003 |
| EC sampling fraction | 0.0005 | 0.0016 | 0.0020 |
| Electron fiducial cut | 0.0011 | 0.0029 | 0.0020 |
| Vertex cut | 0.0021 | 0.0029 | 0.0036 |
| Pion identification | 0.0007 | 0.0028 | - |
| Pion fiducial cut | 0.0018 | 0.0040 | - |
| Missing mass cut | 0.0052 | 0.0029 | 0.0064 |
| Background subtraction | - | - | 0.005 |
| Background asymmetry | - | - | 0.007 |
| Fitting function | 0.0007 | 0.0011 | 0.0010 |
| Beam polarization | 0.0004 | 0.0006 | 0.0008 |
| Total | 0.006 | 0.008 | 0.012 |
| Statistical uncertainty | 0.005 | 0.014 | 0.012 |
The inclusive beam-charge asymmetry (BCA) was also calculated on a run-by-run basis to insure that the integrated number events for each helicity state remained constant over the entire run period. The integrated BCA was measured to be 0.003. To test the impact of this asymmetry on the measured physics asymmetry, was calculated independently for all events from runs with a positive BCA and again for all events from runs with a negative BCA. The two values were found to be identical to a precision much smaller than the quoted systematic uncertainties. It is hence concluded that the BCA does not contribute to the measured physics asymmetry.
IV.1 Variation of particle identification
Particle identification cuts were varied for both electron and pion identification routines. The electron identification was tested by varying the minimum and maximum values for the sampling fraction, EC , fiducial, and vertex cuts. The charged pion identification was tested by switching between the nominal cut on and an analogous cut on the for each track, as well as variations of the pion fiducial cuts. identification was tested by modifying the background subtraction technique, and by computing the asymmetry of the background itself.
A significant contamination of pions in the electron sample could give a large contribution to the systematic uncertainty. The electron identification cut most sensitive to pion contamination was that on the EC inner energy, nominally at MeV, which is equivalent to 3 from the pion peak. To test for pion contamination, the data were analyzed comparing the cut at MeV, giving maximum pion contamination, and MeV, cutting well into the sample of good electrons, and hence removing any trace of contamination due to misidentified . The difference in due to this variation was negligible in comparison with the other sources of uncertainty.
As an additional check on the possibility of pion contamination, the EC distribution was generated for five separate ranges of both and , and then fit with a functional form that combined a Gaussian with a polynomial. The two functions were integrated individually, and the percentage of events passing the electron identification that were actually misidentified pions was computed to be less than in every bin.
The uncertainty due to the value of the missing mass cut was computed by comparing the nominal results, which use a missing mass cut at 1.2 GeV, with results stemming from missing mass cuts at 1.1 GeV and 1.3 GeV.
IV.2 Uncertainty due to fitting procedure
Because was extracted as the coefficient of a fit, it is important that the fitting technique be very reliable. This was tested by variation of the fitting procedure, fitting of data using a random beam helicity, and fitting of simulated data seeded with a known asymmetry.
The nominal fitting function shown in Eq. 9 was derived from the SIDIS cross section as shown in Eq. 2, so this function gives the most physically accurate description of the beam-spin asymmetry. The and coefficients result from an unstable equilibrium in the minimization, so small changes in the data can cause large fluctuations in these values. We did not use this fit to make a measurement of those values, but their inclusion still made the shape of the fitting function more realistic.
To determine the systematic uncertainty due to this fit, the BSAs were fit with a simplified version of the fitting function, , and the resulting coefficients were compared to those from the full fit to compute a value of systematic uncertainty. Other functions were tested as well, including , , and . The first two of these were used to determine the contribution of the cosine term to the fit, and the third tests for a possible contribution from higher harmonics, which were observed to be consistent with zero. The variation of the coefficient due to fits with this variety of functions is seen be only about 13% of the total systematic uncertainty, as shown in Table 1.
Another method to test the fitting procedure is to artificially modify the data to produce a known result, and then measure the discrepancy between the expected result and that provided by the fit. This was done in two ways. The first was to seed the data with a random helicity, resulting in an asymmetry of zero, as shown in Fig. 13. The second was to test the fitting procedure on simulated data with a known asymmetry. In both cases the fits yield values within 1.5 of the expected value.
IV.3 Uncertainty due to beam polarization
Any uncertainty in the measurement of beam polarization will lead to an uncertainty in . The beam polarization was measured periodically during the run using a Mller polarimeter, with an average measurement of . Known systematic effects provide a of 3% (relative) clasnim , which was then used to compute the contribution of the beam polarization to the uncertainty on , as shown in Eq. 11.
| (11) |
These values were averaged over all bins to give the value in Table 1.
IV.4 Acceptance effects
The effect of acceptance on beam-spin asymmetries was found to be negligible in this analysis. The CLAS data can be susceptible to effects from detector inefficiencies, but these effects cancel out for BSAs as long as the acceptance is the same for positive and negative beam helicity and the bin size used in the analysis is sufficiently small.
The CLAS acceptance was computed using a Monte Carlo simulation. Data were generated using a Lepto-based event generator with realistic physics for semi-inclusive DIS Ingelman:1996mq , and the Monte Carlo was performed using a GEANT-based detector simulation Brun:1978fy . Each kinematic bin was analyzed using the raw generated data first, and then again using the data that had passed through the simulated CLAS detector. The efficiency in each kinematic bin was computed as the ratio of the number of events detected in that bin after the Geant detector simulation to the number of events seen in that bin from the generated data sample,
| (12) |
(=reconstructed and =generated). The experimental data were then corrected in each bin using this calculated efficiency,
| (13) |
( is corrected and =measured). The acceptance was computed using only events with positive helicity and only events with negative helicity, and the ratio of the two were checked in every bin to insure they were in agreement with unity to better than 1. Since the CLAS acceptance was seen to be equal for each helicity state, the corrected , which we call is unchanged by the acceptance correction, as demonstrated in Eq. 14.
| (14) |
Then, if ,
| (15) |
V Results
has been measured with good statistics in all three pion channels. Data were binned using five bins in from 0.1 to 0.6, five bins in from 0 to 1 GeV, five bins in from 1.0 to 4.5 GeV2, and ten bins in from 0 to 1, though when looking at dependencies on , , or , only the bins between 0.4 and 0.7 were used.
Fig. 14 and Table 2 show in one dimension vs , , , and . The full data set is contained in the CLAS database clasdb . For each of these plots, all kinematics other than the demonstrated dependence were integrated. When integrating, , , and were integrated over their entire range, and were integrated from 0.4 to 0.7. Fig. 15 and Table 3 show in two dimensions of and . Here we have integrated over all bins and .


The observable has been previously measured for and using CLAS and for all three pion channels at HERMES. Fig. 16 shows the comparison between the current experiment and the previously published data. The previously published CLAS measurement (the E1-dvcs run) utilized an inner calorimeter that greatly increased photon detection at small angles. With that inner calorimeter, the E1-dvcs experiment had more uniform coverage in for s at low . This inner calorimeter was not available at the time of the E1-f run period from which the current data were obtained, and, as a result, the systematic uncertainties in the value for obtained at the lowest value for the experiment reported here are considerably larger than those for the previous CLAS measurement. This large uncertainty for the lowest point obtained here prevents rejection of the null hypothesis that there is no difference between the two CLAS measurements ().
Because HERMES results were obtained at a higher beam energy than the CLAS, it is necessary to scale the data by a factor of to make a valid comparison, where is given by
| (16) |
and is again the energy fraction Bacchetta:2006tn .

It has been observed in measurements at Belle that the Collins mechanism results in opposite -dependence in the two charged pion channels Seidl:2008xc , so in the case that the asymmetry is dominated by the Collins type contribution, and will have opposite sign for the moments.
It is expected that s will give the same sign of asymmetry as . Isospin symmetry predicts that the magnitude of for s should give a weighted average of the moments from and . Since the Collins contribution to and is roughly equal and opposite, one would expect a very small asymmetry for from this effect. Since it is very far from zero, one could argue that other contributions are relevant for .
There has been a phenomenological work that attempted to extract twist3 functions from the existing data Efremov:2002sd , however higher precision data are needed for model independent studies of TMDs Avakian:2009jt ; Avakian:2010br ; Efremov:2006qm ; Pasquini:2011tk . The current measurement provides a significant upgrade of the previous CLAS Avakian:2003pk and HERMES Airapetian:2006rx results, which should be sufficient to contribute to an updated analysis of the relevant twist-3 TMDs, with the newly added benefit of viewing flavor separation with the large improvement in the measurement.
In Fig. 17 our results are compared to a model described in Efremov:2002ut ; Schweitzer:2003uy , which takes into account only the contribution of the term to the moment, where prescription from Efremov:2006qm is used to model the Collins contribution, as well as another model as described in Mao:2012dk ; Mao:2013waa , which also accounts for the contribution using two different spectator models Bacchetta:2008af ; Bacchetta:2003rz . The model predictions are computed specifically for the E1-f kinematics. The opposite sign of the two charged pion channels is consistent with a significant contribution related to the Collins function Schweitzer:2003uy , but the difference in scale for and in particular suggests that the other three contributions to the structure function must also play relevant roles. The model by Mao and Lu, when using the spectator model in Bacchetta:2003rz , describes our data well for and accurately predicts the sign of the asymmetry for (though the predicted magnitude for is much larger than the present data)”, while showing a very small contribution for . The prediction by Mao and Lu using the spectator model described in Bacchetta:2008af , however, is highly inconsistent with our measurement, especially for , where the prediction is large and of opposite sign.

The comparison of measurements for all 3 pions (Fig. 17), with contributions from only the Collins effect, indicates that Sivers-type contributions Mao:2012dk may be significant for and but small for . This is consistent with the latest observations by HERMES and COMPASS Airapetian:2009ti ; Adolph:2012sp ; Adolph:2012sn , where a large Collins effect was observed for charged pions, while the Sivers effect was found to be significant only for . A complete description would be the sum of these two contributions, as well as the contributions from the two twist-3 fragmentation functions.
| , | , | , | |||||
| 0.05 | 0.24 | 0.18 | 1.80 | 0.72 | 0.0059 0.0004 0.0004 | -0.008 0.001 0.000 | |
| 0.15 | 0.26 | 0.29 | 1.84 | 0.71 | 0.0071 0.0009 0.0002 | -0.007 0.002 0.001 | |
| 0.25 | 0.27 | 0.37 | 1.87 | 0.70 | 0.007 0.001 0.001 | -0.010 0.001 0.000 | 0.019 0.002 0.003 |
| 0.35 | 0.27 | 0.42 | 1.90 | 0.69 | 0.011 0.001 0.001 | -0.013 0.002 0.000 | 0.020 0.002 0.005 |
| 0.45 | 0.28 | 0.45 | 1.92 | 0.68 | 0.015 0.001 0.001 | -0.012 0.002 0.003 | 0.022 0.002 0.003 |
| 0.55 | 0.28 | 0.47 | 1.93 | 0.67 | 0.029 0.002 0.003 | -0.007 0.003 0.001 | 0.012 0.004 0.006 |
| 0.65 | 0.29 | 0.48 | 1.93 | 0.65 | 0.039 0.005 0.000 | -0.017 0.005 0.002 | 0.019 0.005 0.007 |
| 0.75 | 0.29 | 0.48 | 1.95 | 0.65 | 0.049 0.005 0.002 | -0.028 0.007 0.003 | 0.013 0.011 0.005 |
| 0.85 | 0.30 | 0.44 | 1.95 | 0.65 | 0.052 0.003 0.003 | -0.041 0.011 0.002 | |
| 0.95 | 0.30 | 0.29 | 1.93 | 0.63 | 0.066 0.003 0.004 | -0.049 0.034 0.008 | |
| 0.51 | 0.14 | 0.52 | 1.27 | 0.72 | 0.018 0.003 0.004 | -0.014 0.006 0.004 | 0.012 0.004 0.011 |
| 0.51 | 0.24 | 0.45 | 1.69 | 0.65 | 0.023 0.003 0.001 | -0.008 0.003 0.002 | 0.016 0.003 0.003 |
| 0.51 | 0.34 | 0.40 | 2.17 | 0.65 | 0.026 0.003 0.001 | -0.008 0.003 0.003 | 0.023 0.003 0.006 |
| 0.51 | 0.44 | 0.38 | 2.91 | 0.65 | 0.027 0.002 0.003 | -0.010 0.006 0.003 | 0.026 0.005 0.003 |
| 0.51 | 0.54 | 0.36 | 3.78 | 0.70 | 0.026 0.006 0.002 | -0.019 0.015 0.004 | -0.015 0.015 0.007 |
| 0.52 | 0.32 | 0.10 | 1.94 | 0.65 | 0.017 0.004 0.003 | 0.012 0.008 0.004 | 0.041 0.010 0.011 |
| 0.51 | 0.29 | 0.30 | 1.95 | 0.68 | 0.028 0.002 0.003 | 0.013 0.006 0.002 | 0.031 0.005 0.005 |
| 0.51 | 0.28 | 0.50 | 1.91 | 0.69 | 0.024 0.003 0.003 | -0.012 0.006 0.003 | 0.026 0.003 0.002 |
| 0.51 | 0.26 | 0.70 | 1.85 | 0.70 | 0.023 0.004 0.003 | -0.016 0.005 0.002 | 0.003 0.004 0.001 |
| 0.52 | 0.21 | 0.90 | 1.69 | 0.73 | 0.029 0.005 0.003 | 0.010 0.007 0.005 | 0.016 0.006 0.002 |
| 0.51 | 0.21 | 0.46 | 1.35 | 0.68 | 0.018 0.002 0.003 | -0.011 0.002 0.003 | |
| 0.51 | 0.30 | 0.43 | 2.05 | 0.67 | 0.026 0.004 0.001 | -0.014 0.003 0.001 | 0.011 0.004 0.007 |
| 0.51 | 0.37 | 0.42 | 2.75 | 0.71 | 0.030 0.002 0.001 | -0.011 0.005 0.003 | 0.021 0.003 0.001 |
| 0.51 | 0.45 | 0.40 | 3.45 | 0.73 | 0.031 0.004 0.003 | -0.016 0.009 0.002 | 0.023 0.004 0.005 |
| 0.51 | 0.52 | 0.37 | 4.15 | 0.75 | 0.019 0.005 0.004 | -0.006 0.019 0.005 | 0.012 0.007 0.006 |
| , | , | , | ||||
|---|---|---|---|---|---|---|
| 0.19 | 0.19 | 0.54 | 1.20 | 0.030 0.009 0.009 | ||
| 0.17 | 0.34 | 0.50 | 1.25 | 0.024 0.004 0.005 | 0.049 0.012 0.014 | |
| 0.16 | 0.51 | 0.49 | 1.26 | 0.018 0.004 0.007 | -0.020 0.009 0.005 | 0.042 0.011 0.008 |
| 0.16 | 0.69 | 0.49 | 1.27 | 0.025 0.004 0.004 | -0.020 0.008 0.005 | 0.019 0.017 0.011 |
| 0.16 | 0.88 | 0.50 | 1.27 | 0.015 0.005 0.006 | 0.014 0.011 0.010 | |
| 0.26 | 0.16 | 0.54 | 1.49 | 0.025 0.004 0.003 | 0.000 0.000 0.008 | |
| 0.25 | 0.32 | 0.51 | 1.58 | 0.031 0.002 0.006 | 0.049 0.011 0.003 | 0.044 0.007 0.007 |
| 0.24 | 0.50 | 0.50 | 1.63 | 0.029 0.002 0.005 | -0.022 0.005 0.005 | 0.049 0.007 0.005 |
| 0.24 | 0.69 | 0.50 | 1.66 | 0.026 0.003 0.004 | -0.017 0.005 0.005 | 0.014 0.010 0.011 |
| 0.23 | 0.87 | 0.50 | 1.75 | 0.033 0.004 0.009 | -0.023 0.010 0.013 | 0.000 0.000 0.001 |
| 0.34 | 0.14 | 0.54 | 1.87 | 0.012 0.003 0.003 | 0.019 0.014 0.008 | 0.037 0.013 0.008 |
| 0.33 | 0.31 | 0.51 | 2.00 | 0.031 0.004 0.004 | 0.011 0.006 0.004 | 0.026 0.006 0.004 |
| 0.33 | 0.50 | 0.50 | 2.05 | 0.032 0.003 0.004 | -0.022 0.006 0.003 | 0.017 0.004 0.004 |
| 0.33 | 0.67 | 0.49 | 2.16 | 0.027 0.003 0.007 | -0.036 0.007 0.011 | 0.035 0.010 0.006 |
| 0.32 | 0.85 | 0.49 | 2.51 | 0.030 0.006 0.006 | -0.002 0.013 0.018 | |
| 0.43 | 0.14 | 0.53 | 2.61 | 0.020 0.005 0.004 | -0.018 0.027 0.007 | -0.008 0.008 0.007 |
| 0.43 | 0.31 | 0.51 | 2.77 | 0.035 0.004 0.009 | -0.000 0.012 0.010 | -0.004 0.004 0.010 |
| 0.43 | 0.50 | 0.50 | 2.80 | 0.037 0.006 0.008 | -0.005 0.008 0.006 | 0.014 0.008 0.008 |
| 0.43 | 0.66 | 0.48 | 2.95 | 0.039 0.006 0.012 | -0.044 0.010 0.019 | 0.033 0.013 0.011 |
| 0.41 | 0.83 | 0.47 | 3.31 | 0.028 0.010 0.021 | -0.016 0.025 0.018 | |
| 0.52 | 0.15 | 0.53 | 3.59 | 0.040 0.013 0.008 | 0.007 0.011 0.009 | |
| 0.52 | 0.31 | 0.51 | 3.70 | 0.039 0.010 0.013 | -0.020 0.029 0.033 | 0.015 0.011 0.009 |
| 0.52 | 0.50 | 0.49 | 3.73 | 0.026 0.008 0.008 | -0.009 0.021 0.028 | 0.031 0.026 0.010 |
| 0.52 | 0.64 | 0.47 | 3.78 | 0.042 0.013 0.043 | -0.054 0.026 0.011 |
VI Conclusion
The moment of the SIDIS cross section corresponding to a polarized lepton beam scattering from an unpolarized target, , has been measured with absolute statistical accuracy of better than 1% in all three pion channels. The measurements are compared to previous results published by the CLAS e16 ; Avakian:2003pk ; Aghasyan:2011ha and HERMES Airapetian:2006rx Collaborations. This data represents an improvement of 2.6 times the HERMES precision and extends the kinematic coverage. This is most notable for , where this is the first CLAS result and the previous result from HERMES does not have sufficient statistics to establish the sign of the asymmetry. The data reinforces the previous result from the CLAS Collaboration. That result was measured with a different beam energy and a modified detector configuration, so the current result is important primarily to reduce the risk of a systematic effect when comparing it with the other pion channels. The current measurements are in good agreement with all previous measurements, and serve as the first evidence for the negative sign of the moment.
The 12 GeV upgrade at Jefferson Lab will provide the opportunity to further improve these measurements with higher statistics and a wider kinematic range, though it will be several years before this data is available Avakian:2011zz . Furthermore, the solid understanding of twist-3 fragmentation functions and TMDs will be very important for development of the physics case for future facilities such as the proposed Electron Ion Collider eic , and the current measurement will contribute to our understanding of these factors.
Acknowledgements.
The authors of this paper would like to thank the staff of the Thomas Jefferson National Accelerator Facility who made this experiment possible. We owe much gratitude to P. Schweitzer for many fruitful discussions concerning the interpretation of our results. We also thank A. Prokudin, B. Pasquini, M. Schlegel, and Z. Lu for their insights. This work was supported in part by U.S Department of Energy grant DE-FG02-04ER41309. We are also thankful for the support of the U.S. National Science Foundation, the Italian Istituto Nazionale di Fisica Nucleare, the French Centre National de la Recherche Scientifique, the French Commissariat à l’Énergie Atomique, the United Kingdom’s Science and Technology Facilities Council, the Chilean Comisión Nacional de Investigación Científica y Tecnológica, the Scottish Universities Physics Alliance, and the National Research Foundation of Korea. The Southeastern Universities Research Association (SURA) operated the Thomas Jefferson National Accelerator Facility for the US Department of Energy under Contract No. DE-AC05-84ER40150.References
- (1) European Muon Collaboration, J. Ashman et al., Nucl. Phys. B328, 1 (1989).
- (2) STAR Collaboration, P. Djawotho, (2011), arXiv:1106.5769.
- (3) STAR Collaboration, L. Adamczyk et al., Phys.Rev. D86, 032006 (2012), 1205.2735.
- (4) PHENIX Collaboration, A. Adare et al., Phys.Rev.Lett. 103, 012003 (2009), 0810.0694.
- (5) D. de Florian, R. Sassot, M. Stratmann, and W. Vogelsang, Phys.Rev. D80, 034030 (2009), 0904.3821.
- (6) A. V. Belitsky, X.-d. Ji, and F. Yuan, Phys. Rev. D69, 074014 (2004), hep-ph/0307383.
- (7) S. Meissner, A. Metz, and M. Schlegel, p. 99 (2008), 0807.1154.
- (8) C. Lorce, B. Pasquini, and M. Vanderhaeghen, JHEP 05, 041 (2011), 1102.4704.
- (9) A. Bacchetta, U. D’Alesio, M. Diehl, and C. A. Miller, Phys. Rev. D70, 117504 (2004), hep-ph/0410050.
- (10) A. Bacchetta et al., JHEP 02, 093 (2007), hep-ph/0611265.
- (11) J. Levelt and P. J. Mulders, Phys. Lett. B338, 357 (1994), hep-ph/9408257.
- (12) R. L. Jaffe, (1996), hep-ph/9602236.
- (13) A. V. Efremov, K. Goeke, and P. Schweitzer, Phys. Rev. D67, 114014 (2003), hep-ph/0208124.
- (14) P. Schweitzer, Phys. Rev. D67, 114010 (2003), hep-ph/0303011.
- (15) Y. Ohnishi and M. Wakamatsu, Phys. Rev. D69, 114002 (2004), hep-ph/0312044.
- (16) A. Afanasev and C. E. Carlson, (2003), hep-ph/0308163.
- (17) F. Yuan, Phys. Lett. B589, 28 (2004), hep-ph/0310279.
- (18) A. Bacchetta, P. J. Mulders, and F. Pijlman, Phys. Lett. B595, 309 (2004), hep-ph/0405154.
- (19) A. Metz and M. Schlegel, Eur. Phys. J. A22, 489 (2004), hep-ph/0403182.
- (20) F. Pijlman, (2006), hep-ph/0604226.
- (21) Z. Lu and I. Schmidt, Phys. Lett. B712, 451 (2012), 1202.0700.
- (22) W. Mao and Z. Lu, Phys.Rev. D87, 014012 (2013), 1210.4790.
- (23) D. Boer and P. J. Mulders, Phys. Rev. D57, 5780 (1998), hep-ph/9711485.
- (24) D. W. Sivers, Phys.Rev. D43, 261 (1991).
- (25) R. Jaffe and X.-D. Ji, Nucl. Phys. B375, 527 (1992).
- (26) M. Burkardt, AIP Conf. Proc. 1155, 26 (2009), 0905.4079.
- (27) J. C. Collins, Nucl. Phys. B396, 161 (1993), hep-ph/9208213.
- (28) Belle Collaboration, R. Seidl et al., Phys. Rev. D78, 032011 (2008), 0805.2975.
- (29) HERMES Collaboration, A. Airapetian et al., Phys. Lett. B693, 11 (2010), 1006.4221.
- (30) COMPASS Collaboration, M. Alekseev et al., Phys. Lett. B692, 240 (2010), 1005.5609.
- (31) M. Penttinen, M. V. Polyakov, A. Shuvaev, and M. Strikman, Phys. Lett. B491, 96 (2000), hep-ph/0006321.
- (32) X. Ji, X. Xiong, and F. Yuan, (2012), arXiv:1207.5221.
- (33) Y. Hatta and S. Yoshida, JHEP 1210, 080 (2012), 1207.5332.
- (34) B. A. Mecking et al., Nucl. Instrum. Meth. A503, 513 (2003).
- (35) M. Mestayer et al., Nucl. Instrum. Meth. A449, 81 (2000).
- (36) G. Adams et al., Nucl. Instrum. Meth. A465, 414 (2001).
- (37) M. Amarian et al., Nucl. Instrum. Meth. A460, 239 (2001).
- (38) E. Smith et al., Nucl.Instrum.Meth. A432, 265 (1999).
- (39) P. Schweitzer, T. Teckentrup, and A. Metz, Phys. Rev. D81, 094019 (2010), 1003.2190.
- (40) R. Brun and F. Rademaker, Nucl. Instrum. Meth. A389, 81 (1997).
- (41) G. Ingelman, A. Edin, and J. Rathsman, Comput. Phys. Commun. 101, 108 (1997), hep-ph/9605286.
- (42) R. Brun, R. Hagelberg, M. Hansroul, and J. Lassalle, (1978).
- (43) CLAS physics database , http://clasweb.jlab.org/physicsdb.
- (44) HERMES Collaboration, A. Airapetian et al., Phys. Lett. B648, 164 (2007), hep-ex/0612059.
- (45) CLAS Collaboration, H. Avakian et al., High Energy Spin Physics Proc. , 239 (2003).
- (46) CLAS Collaboration, H. Avakian et al., Phys. Rev. D69, 112004 (2004), hep-ex/0301005.
- (47) M. Aghasyan et al., Phys. Lett. B704, 397 (2011), 1106.2293.
- (48) A. V. Efremov, K. Goeke, and P. Schweitzer, Nucl. Phys. A711, 84 (2002), hep-ph/0206267.
- (49) CLAS Collaboration, H. Avakian et al., Mod. Phys. Lett. A24, 2995 (2009), 0910.3181.
- (50) H. Avakian, A. V. Efremov, P. Schweitzer, and F. Yuan, (2010), 1001.5467.
- (51) A. V. Efremov, K. Goeke, and P. Schweitzer, Phys. Rev. D73, 094025 (2006), hep-ph/0603054.
- (52) B. Pasquini and P. Schweitzer, Phys. Rev. D83, 114044 (2011), 1103.5977.
- (53) W. Mao and Z. Lu, Eur.Phys.J. C73, 2557 (2013), arXiv:1306.1004.
- (54) A. Bacchetta, F. Conti, and M. Radici, Phys.Rev. D78, 074010 (2008), 0807.0323.
- (55) A. Bacchetta, A. Schaefer, and J.-J. Yang, Phys.Lett. B578, 109 (2004), hep-ph/0309246.
- (56) HERMES Collaboration, A. Airapetian et al., Phys. Rev. Lett. 103, 152002 (2009), 0906.3918.
- (57) COMPASS Collaboration, C. Adolph et al., Phys.Lett. B717, 383 (2012), 1205.5122.
- (58) COMPASS Collaboration, C. Adolph et al., Phys.Lett. B717, 376 (2012), 1205.5121.
- (59) H. Avakian, AIP Conf. Proc. 1388, 464 (2011).
- (60) D. Boer et al., (2011), 1108.1713, 547 pages, A report on the joint BNL/INT/Jlab program on the science case for an Electron-Ion Collider, September 13 to November 19, 2010, Institute for Nuclear Theory, Seattle.