The applicability of FIR fine-structure lines as Star Formation Rate tracers over wide ranges of metallicities and galaxy types
Abstract
Aims. We analyze the applicability of far-infrared fine-structure lines [Cii] 158 m, [Oi] 63 m and [Oiii] 88 m to reliably trace the star formation rate (SFR) in a sample of low-metallicity dwarf galaxies from the Herschel Dwarf Galaxy Survey and compare with a broad sample of galaxies of various types and metallicities in the literature.
Methods. We study the trends and scatter in the relation between the SFR (as traced by GALEX and MIPS 24 m) and far-infrared line emission, on spatially resolved and global galaxy scales, in dwarf galaxies. We assemble far-infrared line measurements from the literature and infer whether the far-infrared lines can probe the SFR (as traced by the total-infrared luminosity) in a variety of galaxy populations.
Results. In metal-poor dwarfs, the [Oi]63 and [Oiii]88 lines show the strongest correlation with the SFR with an uncertainty on the SFR estimates better than a factor of 2, while the link between [Cii] emission and the SFR is more dispersed (uncertainty factor of 2.6). The increased scatter in the SFR- relation towards low metal abundances, warm dust temperatures and large filling factors of diffuse, highly ionized gas suggests that other cooling lines start to dominate depending on the density and ionization state of the gas.
For the literature sample, we evaluate the correlations for a number of different galaxy populations. The [Cii] and [Oi]63 lines are considered to be reliable SFR tracers in starburst galaxies, recovering the star formation activity within an uncertainty of factor 2. For composite and AGN sources, all three FIR lines can recover the SFR with an uncertainty factor of 2.3. The SFR calibrations for ULIRGs are similar to starbursts/AGNs in terms of scatter but offset from the starburst/AGN SFR relations due to line deficits relative to their total-infrared luminosity. While the number of detections of the FIR fine-structure lines is still very limited at high-redshift for [Oi]63 and [Oiii]88, we provide a SFR calibration for [Cii].
Key Words.:
Galaxies: abundances – Galaxies: dwarf – Galaxies: ISM – Galaxies: star formation1 Introduction
Star formation encompasses the birth of new stars through the fragmentation and contraction of cold, dense molecular gas, hereby recycling the ISM content of galaxies (McKee & Ostriker 2007). Knowing the instantaneous level of star formation (i.e. the star formation rate) not only sheds light on the conditions in the ISM, but also on the evolution of galaxies and their formation processes. If we want to understand the physical processes that control galaxy evolution, being able to probe the star formation activity is of great importance. Tracing back star formation in some of the first objects in the early Universe until the present-day could even allow us to probe the star formation activity throughout cosmic times.
Since the main coolants in metal-rich galaxies such as the Milky Way are mostly metal-based ([Cii], [Oi], [Oiii], CO, dust), the metal abundance is considered a fundamental parameter in the regulation of star formation through its influence on the initial cooling of diffuse gas (e.g. Glover & Clark 2014) and the survival of clouds through shielding. Star formation in the early Universe is considered to differ significantly from the present day’s gas consumption in galaxies. Due to the extremely low metal abundances in the early Universe, the gas coolants and initiation processes of star formation were likely to be different from star formation conditions in the Local Universe (e.g. Ly cooling becomes more important). Nearby low-metallicity galaxies might be important laboratories to investigate the connection between the chemical enrichment and star formation processes. Although the present-day metal-poor dwarfs will have experienced some evolution throughout cosmic time (e.g. Hodge et al. 1991; Tosi et al. 2007), their slow chemical evolution makes them important testbeds to understand metallicity effects potentially applicable to galaxies in the early Universe.
Star formation rates (SFRs) on global galaxy scales are typically estimated from scaling relations between diagnostic tracers of the star formation activity, calibrated against the most up to date stellar population synthesis models and characterization of the initial mass function (IMF). Up to the present day, the most widely used SFR diagnostics have been based on continuum bands and optical/near-IR emission lines (see Kennicutt 1998 and Kennicutt & Evans 2012 for a detailed overview). The brightest cooling lines in the atomic and molecular medium are emitted from mid-infrared to radio wavelengths, which have been probed extensively with the Herschel Space Observatory (Pilbratt et al. 2010). Follow-up is guaranteed with SOFIA in the local Universe or, at high spatial resolution, with ground-based interferometers such as ALMA and the future NOEMA in the high-redshift Universe. These facilities open up a whole new spectral window, which favors the use of far-infrared (FIR) and submillimeter (submm) continuum bands (e.g. PACS 70 m, Li et al. 2013) and emission lines as SFR diagnostics across a large variety of galaxy populations.
Here, we investigate the utility of the three brightest fine-structure cooling lines, [Cii], [Oi]63 and [Oiii]88 (e.g. Hunter et al. 2001; Brauher et al. 2008; Cormier et al. in prep.), as tracers of the star formation activity in a sample of low-metallicity dwarf galaxies from the Herschel Dwarf Galaxy Survey (Madden et al. 2013). We, furthermore, asses the influence of metallicity, which is an important parameter controlling star formation in galaxies, constraining the reservoir of dust grains for the formation of molecules and regulating the attenuation of the FUV photons necessary for shielding molecules.
The [Cii] 157.74 m line has been put forward as a potential powerful tracer of the star formation activity in the nearby as well as the more distant Universe (Stacey et al. 1991; Boselli et al. 2002; Stacey et al. 2010; De Looze et al. 2011; Sargsyan et al. 2012) and we, now, aim to expand this analysis to nearby, low-metallicity dwarf galaxies. [Cii] is considered to be the dominant coolant for neutral atomic gas in the interstellar medium (Tielens & Hollenbach 1985a, b; Wolfire et al. 1995) and, therefore, among the brightest emission lines originating from star-forming galaxies (e.g. Stacey et al. 1991; Malhotra et al. 1997; Brauher et al. 2008). In particular, low-metallicity galaxies show exceptionally strong [Cii] line emission (e.g. Poglitsch et al. 1995, Madden et al. 1997, Madden 2000, Hunter et al. 2001, Cormier et al. 2010, Israel & Maloney 2011). Carbon has an ionization potential of 11.3 eV (compared to 13.6 eV for hydrogen), implying that line emission can originate from neutral and ionized gas components (see Table 1). A changing contribution of different gas phases on global scales can prevent a correlation between the [Cii] line emission and level of star formation. The excitation of C+ atoms might, furthermore, saturate at high temperatures, where the line becomes insensitive to the intensity of the radiation field at temperatures well above the excitation potential (Kaufman et al. 1999). The [Cii] emission can also saturate in neutral gas media with hydrogen densities 103 cm-3, where the recombination of C+ into neutral carbon and, eventually, CO molecules is favored (Kaufman et al. 1999). Self-absorption can also affect the [Cii] line excitation in large column densities of gas ( 4 1022 cm-2, Malhotra et al. 1997). Although the [Cii] line is usually not affected by extinction, optical depth effects might become important in extreme starbursts (Luhman et al. 1998; Helou 2000) and edge-on galaxies (Heiles 1994). On top of this, deficits in the [Cii]/FIR ratio towards warm dust temperatures (Crawford et al. 1985; Stacey et al. 1991; Malhotra et al. 1997, 2001; Luhman et al. 2003; Verma et al. 2005; Brauher et al. 2008; Graciá-Carpio et al. 2011; Croxall et al. 2012; Díaz-Santos et al. 2013; Farrah et al. 2013) suggest that the [Cii] conditions might be different in galaxies which are offset from the main sequence of star-forming galaxies. Since carbon can also be significantly depleted on carbon-rich dust grains, the use of O-based gas tracers might instead be preferred.
The [Oi]63 line has a critical density 5 105 cm-3 and upper state energy 228 K (see Table 1), which makes it an efficient coolant in dense and/or warm photo-dissociation regions (PDRs). Although generally observed to be the second brightest line (after [Cii]), the [Oi]63 line is observed to be brighter in galaxies with warm FIR colors and/or high gas densities (Malhotra et al. 2001; Brauher et al. 2008; Lebouteiller et al. 2012). The applicability of [Oi]63 as a SFR calibrator might, however, be hampered by self-absorption (Kraemer et al. 1996; Poglitsch et al. 1996), optical depth effects (more so than [Cii]) and the possible excitation of [Oi]63 through shocks (Hollenbach & McKee 1989). In the situation that the gas heating is not longer dominated by the photo-electric effect but has an important contribution from other heating mechanisms (e.g. mechanical heating, soft X-ray heating), the origin of the line emission might differ from the paradigm of warm and/or dense PDRs. A possible origin of [Oi]63 emission different from PDRs can be, in particular, expected in the most metal-poor galaxies characterized by overall low metal content and diminished PAH abundances.
With an energy of the upper state 163 K, critical density 510 cm-3 and a high ionization potential of 35.1 eV for O+, the [Oiii]88 line originates from diffuse, highly-ionized regions near young O stars. Ionized gas tracers such as [Oiii]88 might gain in importance in low-metallicity environments where PDRs occupy only a limited volume of the ISM judging from their weak PAH emission (Boselli et al. 2004; Engelbracht et al. 2005; Jackson et el. 2006; Madden et al. 2006; Draine et al. 2007; Engelbracht et al. 2008; Galliano et al. 2008) and low CO abundance (Poglitsch et al. 1995; Israel et al. 1996; Madden et al. 1997; Israel & Maloney 2011). Based on our Herschel observations, we focus on [Oiii]88 as ionized gas tracer. Due to the low critical densities for [Oiii]88 excitation with electrons, other lines (e.g. [Oiii]52 but also optical lines such as [Oiii] 5007 and H) will likely dominate the cooling of ionized gas media for intermediate and high gas densities. The brightness of the [Oiii]88 emission line in metal-poor galaxies (Cormier et al. in prep.), however, hints at a SFR tracer with great potential for the high-redshift Universe.
On top of the SFR calibrations for single FIR lines, we try to combine the emission of [Cii], [Oi]63 and [Oiii]88 lines to trace the SFR. The total gas cooling in galaxies scales with the SFR assuming that the ISM is in thermal equilibrium and the total cooling budget balances the gas heating. Therefore, any FIR fine-structure line can be considered a reliable tracer of the SFR if it plays an important role in the cooling of gas that was heated by young stellar photons. Other heating mechanisms unrelated to the UV radiation (e.g. mechanical heating, cosmic ray heating and X-ray heating) and, thus, not directly linked to SFR, might disperse this link. Ideally, we combine the emission of several cooling lines in the ultraviolet/optical (e.g. Ly , H, [Oiii] 5007) and infrared (e.g. [Neiii] 16 m, [Siii] 19, 33 m, [Cii] 158 m, [Oi] 63, 145 m, [Nii] 122, 205 m, [Oiii] 52, 88 m, [Niii] 57 m and [Siii] (35 m)) wavelength domains to cover the total gas cooling budget in galaxies. Given our focus on the far-infrared coolants, we attempt to obtain a more complete picture of the overall cooling budget by combining the [Cii], [Oi]63 and [Oiii]88 lines.
The Herschel Dwarf Galaxy Survey (DGS) and observations are presented in Section 2, together with the acquisition and processing of ancillary data, which will be used as reference SFR calibrators. In Section 3, we take advantage of the high spatial resolution attained for the most nearby galaxies to study the trends and scatter in the spatially resolved relation between the SFR and FIR line emission. The SFR calibrations and trends with the scatter in the SFR- relations based on global galaxy measurements for the entire DGS sample are presented in Section 4. SFR calibrations for each of the fine-structure lines [Cii], [Oi]63 and [Oiii]88 are derived for a selection of different galaxy populations in Section 5. In Section 6, we draw together our conclusions. Appendix A discusses the applicability of different unobscured (Section A.2) and obscured (Section A.3) indicators as reference SFR tracers for the low-metallicity DGS sample. Appendix A.4 presents a comparison between Herschel and ISO spectroscopy. Tables with source information, measurements of reference SFR calibrators and FIR lines are presented in Appendix B for the DGS sample, the literature sample of galaxies with starburst, composite or active galactic nucleus classifications and high-redshift sources.
| Line | IPa𝑎aa𝑎aThe ionization potential refers to the ionization energy of an atom to create the species in Column 1. For example, the ionization potential of 35.1 eV for [Oiii]88 indicates the energy required to remove another electron from O+ and, thus, ionize O+ in order to create O++. | Refb𝑏bb𝑏bReferences: (1) Goldsmith et al. (2012); (2) Tielens & Hollenbach (1985a); (3) Aggarwal & Keenan (1999). | Origin? | |||
|---|---|---|---|---|---|---|
| [eV] | [K] | [cm-3] | [cm-3] | |||
| 11.3 | 91 | 1.6 103 | 44 | 1 | PDRs, diffuse Hi clouds, diffuse ionized gas, Hii regions | |
| - | 228 | 5 105 | - | 2 | warm and/or dense PDRs | |
| 35.1 | 163 | - | 510 | 3 | low excitation, highly ionized gas |
2 Dwarf Galaxy Survey
2.1 Sample characteristics
The Dwarf Galaxy Survey (DGS, Madden et al. 2013) is a Herschel Guaranteed Time Key Program, gathering the PACS (Poglitsch et al. 2010) and SPIRE (Griffin et al. 2010) photometry and PACS spectroscopy of 50 dwarf galaxies in 230 hours. The sample was selected to cover a wide range in metallicities from 12+(O/H) = 8.43 (He 2-10, 0.55 ) down to 7.14 (I Zw18, 0.03 )222Oxygen abundances, which are used here to constrain metallicities, are calculated from optical line intensities following the prescriptions in Pilyugin & Thuan (2005), assuming a solar oxygen abundance O/H⊙ = 4.9 10-4, or 12+(O/H)⊙=8.7 (Asplund et al. 2009).. The sample selection was furthermore optimized to maximize the availability of ancillary data. With distances ranging from several kpc to 191 Mpc, the Dwarf Galaxy Survey observes the line emission of more distant galaxies within a single beam (PACS beams have full-width at half maximum (FWHM) of 11.5, 9.5 and 9.5 for [Cii], [Oi]63 and [Oiii]88), while the extended far-infrared line emission from the brightest star-forming regions is mapped in the most nearby galaxies by the Herschel Space Observatory. More details about the sample selection as well as a description of the scientific goals of the survey are outlined in Madden et al. (2013).
2.2 Herschel data
Spectroscopic mapping of the [Cii] 158 m line was performed for 48 galaxies333The DGS galaxies UGCA 20 and Tol 0618-402 were not observed with the PACS spectrometers onboard Herschel., among which most galaxies were also covered in [Oiii] 88 m (43 out of 48 galaxies) and [Oi] 63 m (38 out of 48 galaxies). Far-infrared fine-structure lines [Oi] 145 m, [Nii] 122 m, [Nii] 205 m and [Niii] 57 m were probed in a subsample of the brightest galaxies (see the histogram in Figure 4 of Madden et al. 2013). An overview of the spectroscopy observations, data reduction, line flux measurements and line ratios is provided in Cormier et al. (in prep).
2.3 Reference SFR diagnostic
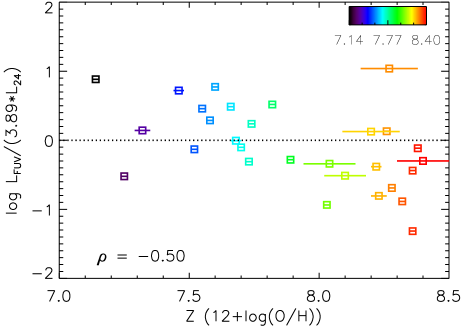
To establish the applicability of FIR lines to trace the SFR, we need to specify a reference star formation rate tracer. Typically, combinations of SF diagnostics are used to trace the unobscured and obscured fraction of star formation. Figure 1 shows the ratio of unobscured versus obscured star formation, as probed by GALEX and MIPS 24 m or our reference calibrators of the unobscured and obscured star formation (see later), respectively, as a function of oxygen abundance for the DGS sample. The Spearman’s rank correlation coefficient, , is computed from the IDL procedure rcorrelate to quantify the degree of correlation between the oxygen abundance and the ratio of unobscured-versus-obscured star formation. Values of close to +1 and -1 are indicative of a strong correlation or anti-correlation, respectively, while values approaching 0 imply the absence of any correlation. For the low metallicity (12+(O/H) 7.8-7.9) galaxies of the DGS sample, the fraction of unobscured star formation starts to dominate (see the negative correlation in Figure 1 with = -0.50) and we, thus, need tracers of the unobscured and obscured fraction of star formation. The increased fraction of unobscured star formation towards lower metal abundances is in agreement with the drop in the ratio of the SFR estimated from the WISE band at 12 m versus the SFR from H emission, /, with decreasing metallicity reported in Lee et al. (2013), which was attributed to the low dust-to-gas ratios of metal-poor galaxies (e.g. Rémy-Ruyer et al. 2014), making the reprocessing of UV photons by dust inefficient (Schurer et al. 2009; Hwang et al. 2012).
In this paper, we choose GALEX and MIPS 24 m as reference SFR tracers to probe the unobscured and obscured star formation component, respectively, and we rely on the SFR calibrations presented by Hao et al. (2011) and Murphy et al. (2011) (see Table 4). In Section A of the appendix, we motivate this choice of reference SFR calibrators by comparing different unobscured (GALEX , H) and obscured (IRAC8 m, MIPS 24 m, , 1.4 GHz) SFR tracers for the DGS galaxy sample. Among the unobscured SFR diagnostics, we argue that the H line can provide better SFR estimates compared to due to the limited range of ages to which the SFR calibration for H ( 10 Myr) is sensitive compared to FUV (100 Myr). Given the bursty star formation histories and small sizes of dwarf galaxies, the underlying assumption of continuous star formation activity during the age range of the SFR calibrator is not fulfilled, which becomes worse for the emission probing a longer time scale of star formation activity. The unavailability of H maps prevents us from determining the H emission that corresponds to the galaxy regions covered in our Herschel observations. The emission is instead used as reference SFR calibrator, but keeping in mind that might underestimate the SFR by 50 as compared to H (see Section A.2). The analysis in Section A.3 shows that IRAC 8 m, and are unreliable SFR tracers of the obscured SF fraction due to the dependence of PAH abundance on metallicity, the peculiar SED shapes and/or the burstiness of the star formation histories of metal-poor dwarfs. Although the MIPS 24 m band emission might not be entirely free of metallicity effects and/or variations in (very small) grain abundance, the analysis of Section A.3 shows that MIPS 24 m is linked more closely to the SFR over wide ranges of metallicity compared to the other obscured SFR diagnostics.
GALEX data are processed in a similar way to that outlined in Cortese et al. (2012). The data are background subtracted and corrected for Galactic extinction according to the recalibrated in Schlafly et al. (2011) from Schlegel et al. (1998), as reported on the NASA/IPAC Extragalactic Database, and assuming an extinction law with = 3.1 from Fitzpatrick et al. (1999). Spitzer MIPS data have been retrieved from the Herschel Database in Marseille (HeDaM444http://hedam.lam.fr/). Details of the data reduction of the ancillary MIPS data set can be found in Bendo et al. (2012b), along with aperture photometry techniques and results.
3 Spatially resolved SFR- relation
3.1 Convolution and regridding of the maps
The closest galaxies in the DGS sample were mapped with Herschel to cover most of the star-forming regions and, therefore, can be used to provide a spatially resolved interpretation of the SFR calibrations. For the spatially resolved analysis, we consider all sources at distances 7.5 Mpc with GALEX and MIPS 24 m observations555The distance of 7.5 Mpc has been chosen as a fair compromise between the number of spatially resolved galaxies to be analyzed and the spatial resolution of about 100 pc, corresponding to the nominal pixel size of 3.1333 at 7.5 Mpc.. A visual inspection of the MIPS 24 m images shows that the mid-infrared emission from VII Zw 403, Mrk 209, UGC 4483 and NGC 625 is barely resolved with respect to the MIPS 24 m beam (FWHM 6, Engelbracht et al. 2007) and, therefore, those galaxies are excluded from the sample for the spatially resolved analysis. We, therefore, end up with a subsample of seven well-sampled galaxies with metal abundances varying from 0.10 Z⊙ (NGC 2366) to 0.38 Z⊙ (NGC 1705).
All maps of the resolved subsample have been convolved from their native resolution ([Oiii]88: 9.5, [Oi]63: 9.5; GALEX : 6; MIPS 24 m: 6) to the 12 resolution of PACS at 160 m using the kernels presented in Aniano et al. (2011). Convolved images are rebinned to maps with pixel size corresponding to regions within galaxies of 1142 pc2, i.e. the size of a nominal pixel of 3.1333 at 7.5 Mpc. We caution that pixels of this size are not independent due to the shape of the beam (FWHM of 12) which is spread across several pixels within one galaxy. Since our main interest is the comparison of the behavior in the relations between the SFR and FIR line emission for different galaxies, we argue that a possible dependence of individual pixels for one specific galaxy will not severely affect the interpretation of our results. Given that the pixels defined this way correspond to a same physical scale within galaxies, the pixels provide a proxy for the surface density of the SFR, , and the FIR line surface density, . Only pixels attaining surface brightness levels of signal-to-noise () higher than 5 are taken into consideration, neglecting the uncertainty from the calibration. Due to the proximity of NGC 6822 ( = 0.5 Mpc), the rebinning of pixels results in the absence of any region at sufficient level, limiting the spatially resolved galaxy sample to six objects. For NGC 1705, the [Oi]63 line is not detected at sufficient level on spatially resolved scales.
3.2 Observed trends
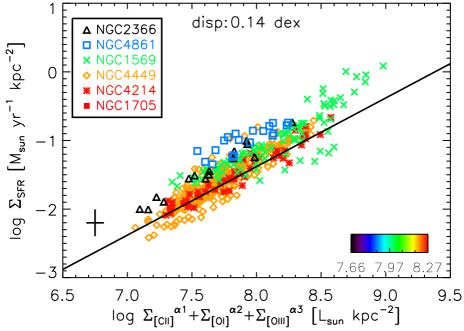
Figure 2 shows the relation between the SFR and [Cii], [Oi]63 and [Oiii]88 line emission for the subsample of spatially resolved galaxies. Different galaxies are color-coded according to their oxygen abundance. Since abundances are determined for global galaxies, they may not give representative values for the metal abundance on spatially resolved scales. For example, the inefficient ISM mixing of nebular and neutral gas might cause deviations from this global metallicity value on kiloparsec scales (Roy & Kunth 1995; Lebouteiller et al. 2004). Since the coverage in [Cii] is larger with respect to the areas mapped in [Oi]63 and [Oiii]88 and/or the [Cii] line might attain higher levels in some areas, the number of pixels with is higher for [Cii] (1274 pixels) than for [Oi]63 (602) and [Oiii]88 (605) lines.
SFR calibrations of spatially resolved regions are determined from Levenberg-Marquardt least-squares fitting using the IDL procedure MPFITFUN, which is based on the non-linear least-squares fitting package MPFIT (Markwardt 2009). The MPFITFUN procedure only accounts for the uncertainties on the SFR, which assumes that the line luminosities are error-free. While the line measurements are obviously affected by uncertainties inherent to the calibration and/or line fitting techniques, we prefer to account for the uncertainties on the SFR in the fitting procedure since the precision of the SFR estimate is affected by uncertainties on the reference SFR calibrators as well as the inaccuracy inherent to the applied reference SFR calibrators and, therefore, often larger than the uncertainties on the line measurements. Table 2 summarizes the results of the fitted SFR calibrations:
| (1) |
where is the FIR line surface density in units of L⊙ kpc-2, is the star formation rate in units of M⊙ yr-1 pc-2 and and represent the slope and intercept of the best fit. We require that the parameter can be determined at a significance level to determine that two quantities (i.e. SFR and FIR line surface density) are correlated.
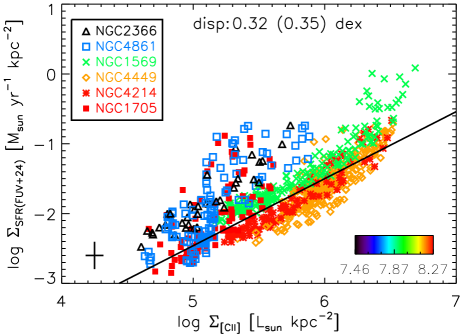
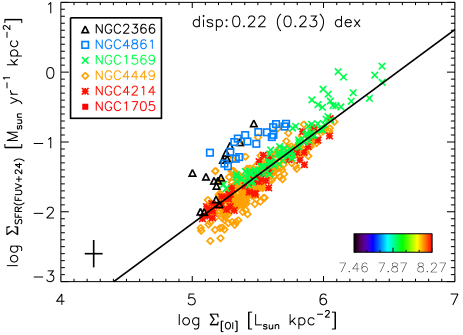
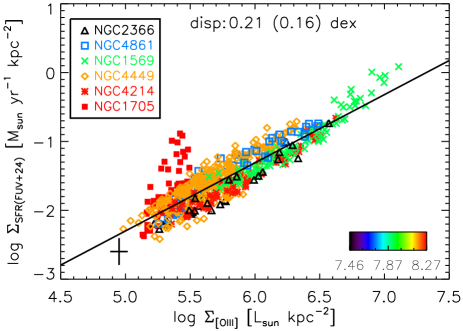
The observed trends in Figure 2 in combination with the significance of the fitted slope of each trend suggest a correlation between the SFR and [Cii], [Oi]63, [Oiii]88 line emission, which persists over almost two orders of magnitude in surface density. The smallest dispersion (0.21 dex) as well as the best constraint on the slope parameter with is found for the [Oiii]88 line, suggesting that the [Oiii]88 line more tightly correlates with the SFR as compared to [Oi]63 (0.22 dex) and [Cii] (0.32 dex) lines on spatially resolved scales of 100 pc. Comparing different galaxies, we observe consistent trends with similar slopes between the FIR line emission and SFR. Towards brighter regions, the slope of the SFR- relation appears to get steeper in most galaxies, suggesting that the [Cii] line is not the dominant coolant in dense star-forming regions, where other cooling lines ([Oi]63 or [Oiii]88) are favored given the density and ionization state of the gas (Lebouteiller et al. 2012). The steep slope ( = 1.41) in the spatially resolved SFR- relation suggests a sudden drop in the [Oi]63 emission for a decrease in star formation activity, while the flatter SFR- ( = 0.93) and SFR- ( = 1.01) relations indicate that the [Cii] and [Oiii]88 lines remain bright in regions of relatively low SFRs. Given the high upper state energy and critical density for [Oi]63 (see Table 1), it is not surprising that bright [Oi]63 emission only occurs in warm and/or dense star forming regions, where we expect to find the highest level of star formation activity.
A few galaxies (NGC 1705, NGC 2366 and NGC 4861) show diverging behavior in some of the SFR relations. NGC 1705 has a peculiar behavior in the SFR- and SFR- relations with weaker line emission relative to its star formation rate. NGC 1705 is a dwarf starburst galaxy dominated by a central super star cluster (SSC) straddled by two dusty off-nuclear regions offset by 250 pc that dominate the H, mid- and far-infrared emission of the galaxy (Cannon et al. 2006). The chemistry and heating of gas in the off-nuclear positions do not seem to be regulated directly by the central SSC (Cannon et al. 2006), but rather exposed to the emission of young, massive stars, produced during a second starburst about 3 Myr ago which was presumably induced by the expanding shell after the first central starburst (Annibali et al. 2009). The weak [Oiii]88 emission originates from the eastern dust complex which shows bright [Cii] and PAH emission, which suggests that the deviation for the eastern regions of NGC 1705 could be due to a radiation field not strong enough to excite [Oiii]88 (requiring massive O6 and earlier-type stars). The western dust region does show bright [Oiii]88 emission, but has weak [Cii] and PAH emission. We, therefore, argue that the western dust complex is exposed to a harder radiation field, capable of destroying PAHs and ionizing the majority of the gas, which makes [Oiii]88 a more efficient coolant. The non-detection of [Oi]63 (which is an efficient coolant of dense PDRs, see Table 1) might suggest rather diffuse ISM regions in the western and eastern dust emission complexes. Alternatively, optical depth effects might play a role in the two dusty off-nuclear regions. The behavior of NGC 2366 and NGC 4861 is mainly divergent in the SFR- and SFR- relations, whereas the [Oiii]88 emission correlates remarkably well with the SFR, suggesting that the gas around massive star clusters is mostly ionized and that PDRs only occupy a limited volume of the ISM.
The different galaxies cover a wider range in the SFR- relations than is observed within one single object, suggesting that the dispersion in the SFR- relations is driven by the diversity on global galaxy scales rather than variations in the ISM conditions within individual objects. The SFR- relation is most affected by this different behavior of galaxies with a dispersion of 0.32 dex around the fitted SFR calibration. More metal-rich galaxies show lower star formation rates as traced by +MIPS 24 m than those predicted by our SFR calibration given their [Cii] emission. Sources with lower metal-abundances, on the other hand, preferentially populate the part of the plot representative of weaker [Cii] emission and/or higher levels of star formation. Since the SFR based on +MIPS 24 m might be underestimated in more metal-poor dwarfs relative to the SFR calibrators +MIPS 24 m (see Section A.2), the offset of metal-poor dwarf galaxies in the SFR- relations might even be more pronounced. With a dispersion of 0.22 and 0.21 dex in the SFR- and SFR- relations, respectively, the fine-structure lines [Oi]63 and [Oiii]88 seem to depend less on the ISM conditions in galaxies and might, thus, be potentially better SFR indicators compared to [Cii].
Given that we probe different ISM phases, even on spatially resolved scales of 100 pc, we try to better approximate the overall cooling budget through FIR lines by combining the surface densities of [Cii], [Oi]63 and [Oiii]88. For the combination of several FIR lines, we attempt to fit a SFR function of the form:
| (2) |
where is the FIR line surface density in units of L⊙ kpc-2, is the star formation rate in units of M⊙ yr-1 pc-2 and (, , ) and represent the slopes and intercept of the best fit.
In the fitting procedure, the different data points are equally weighted and the parameters (, , ) of the slopes are constrained to positive numbers. Similar functions are defined to fit combinations of two FIR lines. Best fitting parameters (including calibration coefficients and dispersion) are presented in Table 2 only for line combinations which improved on the dispersion in the SFR calibrations for single FIR lines. By combining a number of FIR lines, we are able to significantly reduce the scatter (see Figure 3), confirming the hypothesis that the total gas cooling balances the gas heating under the condition of local thermal equilibrium. This, furthermore, suggests that the specific processes that regulate the cooling in the different gas phases are of minor importance. Although the primary heating mechanisms are very different in the neutral gas phase (photo-electric effect and a variable contribution from cosmic rays and soft X-ray heating), as compared to ionized gas media (photo-ionization processes), the main goal is to get access to the total heating due to young stellar emission -irrespective of the dominant heating mechanism in different gas phases- by probing the total cooling budget in galaxies. In particular, the combinations [Cii]+[Oiii]88, [Oi]63+[Oiii]88 and [Cii]+[Oi]63+[Oiii]88 provide accurate estimates of the SFR, which suggests that the cooling in the neutral as well as ionized media needs to be probed to approximate the overall cooling budget in metal-poor galaxies and, thus, trace the star formation activity. However, heating mechanisms not directly linked to the recent star formation activity (e.g soft X-ray heating, Silk & Werner 1969, which might become substantial in extremely low-metallicity galaxies such as I Zw 18, Péquignot 2008 and Lebouteiller et al. in prep.) might disperse the link between the emission of cooling lines and the star formation rate (see also Sections 3.3 and 4.2).
| SFR calibrator | Number of data points | Slope | Intercept | 1 dispersion [dex] |
| SFR calibration: spatially resolved DGS sample | ||||
| 1274 | 0.93 0.06 | -6.99 0.35 | 0.32 (0.35) | |
| 602 | 1.41 0.04 | -9.19 0.23 | 0.22 (0.23) | |
| 605 | 1.01 0.02 | -7.33 0.12 | 0.21 (0.16) | |
| + | 605 | (0.94 0.03, 1.08 0.02) | -7.82 0.14 | 0.20 (0.15) |
| + | 441 | (1.30 0.03, 1.25 0.02) | -9.01 0.15 | 0.14 |
| + + | 441 | (1.23 0.03, 1.31 0.03, 1.25 0.07) | -9.38 0.16 | 0.14 |
| SFR calibration: global galaxy DGS sample | ||||
| 32 | 0.84 0.06 | -5.29 0.34 | 0.38 (0.40) | |
| 26 | 0.94 0.05 | -6.37 0.29 | 0.25 | |
| 28 | 0.92 0.05 | -6.71 0.33 | 0.30 (0.30) | |
3.3 Scatter in the SFR- relation
In this section, we want to analyze what is driving the dispersion in the SFR- relations on spatially resolved scales within galaxies by analyzing the trends with several diagnostics for the physical conditions of the interstellar medium. We quantify the dispersion in the respective SFR- relations as the logarithmic distance between the SFR as estimated from the reference SFR calibration based on and 24 m emission and the best fitting line for the spatially resolved SFR- relation.
First of all, we analyze a possible link between the scatter and FIR color (as probed by the PACS 100 m/PACS 160 m flux density ratio obtained from dust continuum observations), considered a proxy of the dust temperature (or grain charging) under the assumption that the emission in both bands is heated by the same radiation field. Although different radiation fields -originating from star-forming regions or the diffuse interstellar radiation- have been shown to contribute to the emission in far-infrared and submillimeter wavebands (e.g. Bendo et al. 2012a), the dust emission in dwarf galaxies seems to be due to heating primarily by young stars, even at wavelengths 160 m (Galametz et al. 2010; Bendo et al. 2012a).
Figure 4 displays the observed trends between FIR color and dispersion in the SFR- relations for [Cii] (top panel) and [Oi] (bottom panel). The data reduction of PACS 100 and 160 m photometry maps is described in Rémy-Ruyer et al. (2013). The dispersion in the SFR- relation ( = 0.67) clearly correlates with the FIR colors of galaxy regions in the sense that the fine-structure line [Cii] does not seem well-suited as a SFR indicator towards warm far-infrared colors. Low-metallicity galaxies often have warm FIR colors (e.g. Thuan et al. 1999; Houck et al. 2004; Galametz et al. 2009, 2011; Rémy-Ruyer et al. 2013), which could explain why galaxies such as NGC 2366 and NGC 4861 show an offset in the SFR- relation compared to more metal-rich galaxies. For increasing dust temperatures, the grain charging parameter increases and, therefore, the photoelectric heating efficiency decreases, diminishing the line cooling. We observe a similar but more moderate correlation with FIR color for [Oi]63 (0.51 dex). Similar plots for [Oiii]88 are not shown here, since the line emission arises from the ionized gas component, where photo-ionization processes dominate the heating and no physical motivation exists for a correlation with FIR color.
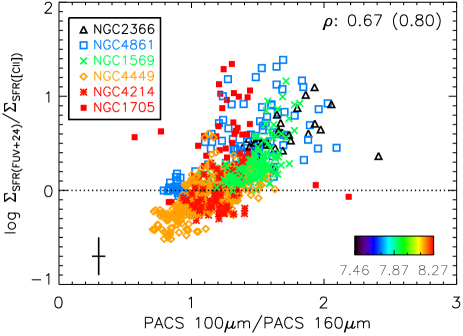
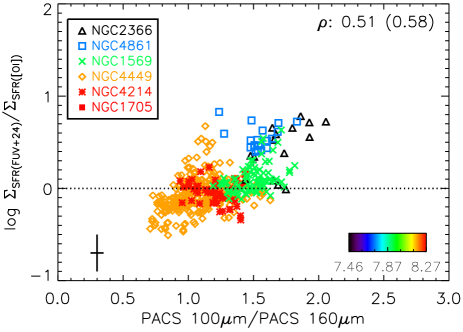
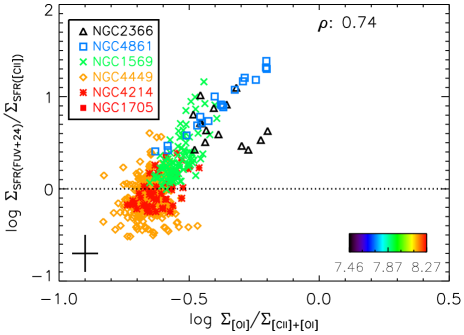
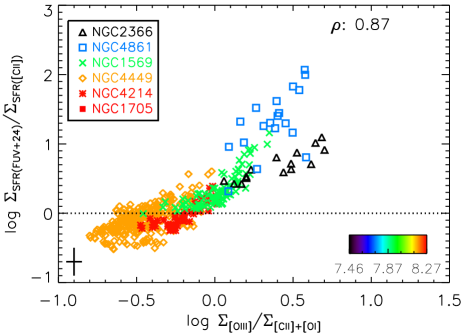
Figure 5 shows the behavior of the scatter in the SFR- relation as a function of FIR line ratios [Oi]63/[Cii]+[Oi]63 (top) and [Oiii]88/[Cii]+[Oi]63 (bottom). With an upper state energy 228 K and critical density 5 105 cm-3 for [Oi]63 as compared to 91 K and 1.6 103 cm-3 for [Cii], the [Oi]63/[Cii]+[Oi]63 ratio can be interpreted as a proxy for the relative fraction of warm and/or dense gas which increases towards higher values of [Oi]63/[Cii]+[Oi]63. Indeed, PDR models have shown that this ratio increases towards higher gas density and radiation field strength (Kaufman et al. 2006). With [Oiii]88 emission originating from highly-ionized regions near young O stars, the [Oiii]88/[Cii]+[Oi]63 ratio can be interpreted as a proxy for the relative contribution of the ionized gas phase with higher values implying large filling factors of diffuse highly-ionized gas with respect to neutral media. The latter interpretations of line ratios are based on the assumption that most of the [Cii] emission arises from PDRs rather than diffuse ionized gas media and that also [Oi]63 emission can be identified merely with PDRs. However, the interpretation of this line ratio might differ for low-metallicity galaxies, where the filling factors of PDRs are considered to be low based on the weak emission of several PDR tracers (e.g. PAH, CO). High [Oi]63/[Cii]+[Oi]63 line ratios in dust deficient objects might, thus, have a different origin than warm and/or dense PDRs. Péquignot (2008) have shown that low-ionization line emission in neutral gas media can be produced by a pseudo-PDR with similar lines as PDRs but with soft X-rays as the dominant heating mechanism (see also Lebouteiller et al. in prep).
There is a clear correlation (=0.74) between the [Oi]63/[Cii]+[Oi]63 line ratios and the observed scatter in the SFR- relation indicating that regions with higher values of [Oi]63/[Cii]+[Oi]63 are offset in the SFR relation towards weaker [Cii] emission for a certain SFR. This implies that [Cii] is not the most appropriate SFR indicator in those regions. Higher values of [Oi]63/[Cii]+[Oi]63 occur preferentially in galaxies of lower metal abundance (e.g. NGC 2366, NGC 4861), which might suggest that the importance of the photoelectric effect diminishes in dust deficient environments and other heatings mechanisms (e.g. soft X-ray heating) become more efficient.
With the [Oiii]88/[Cii]+[Oi]63 ratio (see bottom panel of Figure 5) covering almost two orders of magnitude, we sample very distinct ISM conditions on hectoparsec scales within spatially resolved galaxies. The clear correlation of [Oiii]88/[Cii]+[Oi]63 with the scatter in the SFR- relation ( = 0.87) implies that the [Cii] line is not a good tracer of the star formation activity in regions where the ionized gas phase occupies an important part of the ISM volume. Although the [Cii] line could also regulate the cooling in ionized gas media besides being the dominant coolant in neutral PDRs, the harder radiation field at lower metallicities will produce hard photons capable of ionizing O+ (IP = 35.1 eV). Since the ionization potential of C+ is only 24.4 eV, carbon might thus easily become doubly ionized in diffuse ionized gas media resulting in most of the carbon being locked in C++ rather than C+. In particular, metal-poor regions seem affected by large filling factors of highly ionized media, which questions the ability of [Cii] to trace the SFR in those environments.
4 Global galaxy SFR- relation
In the previous section, we analyzed the observed trends and scatter in the SFR- relations for a subsample of spatially resolved galaxies down to hectoparsec scales. We verify whether the trends and scatter remain present on global galaxy scales, when averaged out over the different ISM phases. For this analysis, we consider all galaxies with GALEX and MIPS 24 m observations (32 out of 48 galaxies), including the resolved sources from Section 3 with their line and continuum flux measurements reduced to one data point. The extension of the subsample of spatially resolved galaxies to the entire DGS sample broadens the range covered in metallicity from 0.03 Z⊙ (I Zw 18) to 0.5 Z⊙ (HS 2352+2733) and in SFR from 0.001 M⊙ yr-1 (UGC 4483) to 43 M⊙ yr-1 (Haro 11) as traced by +24 m.
4.1 Global fluxes
For global galaxy fluxes of FIR lines, we rely on the aperture photometry results for fine-structure lines reported in Cormier et al. (in prep.), where FIR line fluxes within apertures covering the brightest fine-structure line emission are computed. We assume a 30 calibration error on top of the uncertainties that result from line fitting. In some cases, the [Cii] emission is more extended with respect to the [Oi]63 and [Oiii]88 emission or simply observed across a wider field, in which cases, the [Cii] apertures are bigger to include the total region mapped. Here, we measure the [Cii] flux within the same apertures as the [Oi]63 and [Oiii]88 emission for 6 galaxies using the same techniques as Cormier et al. (in prep.). For NGC 6822, we only include the FIR line measurements from the Hii region Hubble V, since it is the only area in NGC 6822 covered in all three lines.
Corresponding GALEX and MIPS 24 m fluxes are obtained from aperture photometry using the central positions and aperture sizes applied to the FIR fine-structure lines. Table 5 gives an overview of the aperture photometry results for GALEX and MIPS 24 m bands. For point sources, GALEX and MIPS 24 m measurements usually correspond to total galaxy fluxes. Total MIPS 24 m fluxes for point sources are adopted from Bendo et al. (2012b) and are indicated with an asterisk in column 5 of Table 5. In some cases, the data show an extended tail of emission (HS 1442+4250, UGC 04483, UM 133) with no counterpart in MIPS 24 m nor PACS maps. Rather than measuring the global emission for these galaxies with a cometary structure, we rely on aperture photometry within apertures that encompass the brightest 24 m emission features. In this manner, we avoid overestimating the total SFR for these galaxies by neglecting the emission that was either not covered in our Herschel observations or did not show any dust emission, suggesting that little dust is present in those areas. Table 5 reports the flux densities within those apertures, but also provides in parentheses the photometry results for apertures encompassing the total emission.
4.2 Observed trends
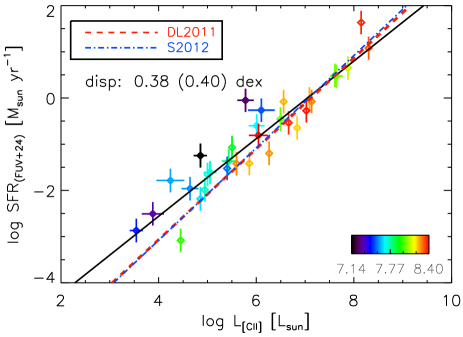
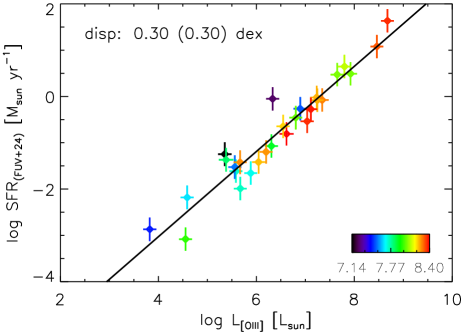
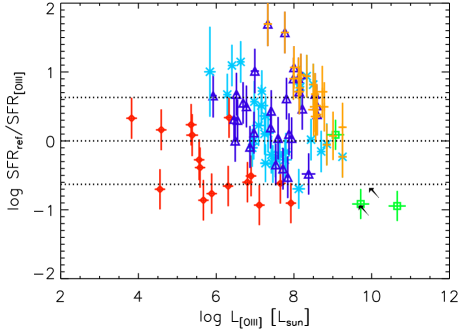
Figure 6 presents the SFR- relations on global galaxy scales for DGS sources with GALEX and MIPS 24 m observations. Based on the observed trends, SFR calibrations are derived from linear regression fits:
| (3) |
where is the FIR line luminosity in units of L⊙, SFR is the star formation rate in units of M⊙ yr-1 and and represent the slope and intercept of the best fit. Table 2 (see bottom part) summarizes the calibration coefficients (slope, intercept) retrieved from the fits and the dispersion of data points around the best fit.
With the slopes of all best fitting lines determined with at least 5 significance, we are confident that the SFR also correlates with the [Cii], [Oi]63 and [Oiii]88 line emission on global scales. The smallest dispersion (0.25 dex) and strongest constraint on the slope (S/N 19) could be obtained for the [Oi]63 line, from which the SFR can be estimated with an uncertainty factor of 1.8. The [Oiii]88 line probes the SFR within an uncertainty factor of 2, while the link between the SFR and [Cii] line is more dispersed and results in an estimated SFR uncertain by a factor of 2.4. The top panel of Figure 6 includes previous SFR calibrations reported in De Looze et al. (2011)666The SFR calibration in De Looze et al. (2011) was derived based on the reference SFR tracers GALEX and MIPS 24 m and the scaling factor = 6.31 as derived by Zhu et al. (2008). Recalibrating their relation with the scaling factor ( = 3.89) applied in this paper would only shift their relation by 0.2 dex at most. (red dashed line) and Sargsyan et al. (2012) (blue dashed-dotted line). The SFR- calibration derived for the DGS sample777Although the [Cii] luminosity range in De Looze et al. (2011) (5.7 [L⊙] 9.1) does not extend to the faintest [Cii] luminosities for galaxies, it largely overlaps with the range covered by DGS sources while the SFR relation in Sargsyan et al. (2012) was calibrated for higher [Cii] luminosities (7 [L⊙] 9). has a shallower slope ( = 0.84) compared to the nearly one-to-one correlation obtained in De Looze et al. (2011) and Sargsyan et al. (2012), which can be attributed to a decreasing [Cii] emission towards lower metal abundances. For [Cii] and [Oiii]88, the SFR seems qualitatively linked in the same way to the line emission on global galaxy and spatially resolved scales. On spatially resolved scales, the slope of the SFR calibrations for [Oi]63 ( = 1.41) differs from the correlation observed on global galaxy scales ( = 0.94).
Compared to the dispersion in the spatially resolved SFR- relations, the averaging over the different ISM phases on global galaxy scales does not reduce the scatter in the observed SFR- trends. This again shows that the dispersion in the SFR relations is not driven by variations within one single galaxy but rather originates from the diversity of ISM conditions in a large sample of galaxies covering wide ranges in metallicity. The dispersion is largest in the SFR- trend (0.38 dex) as compared to the SFR- (0.30 dex) and SFR- (0.25 dex) relations. For a sample of similar size (24 galaxies), the SFR calibration for [Cii] presented in De Looze et al. (2011) reports a 1 dispersion of only 0.27 dex. Part of the increased scatter observed for the DGS sample might be attributed to the uncertainties on the reference SFR tracer, which was shown to be sensitive to the star formation history and, possibly, the grain properties of metal-poor dwarf galaxies (see Sections A.2 and A.3). We argue, however, that the significant scatter in the SFR- relation indicates the large variety of ISM conditions (i.e. gas density, radiation field, filling factors of neutral and ionized gas, excitation conditions) probed in the DGS galaxy sample (see Section 4.3). This diversity might not be surprising given the different morphological classifications (e.g. blue compact dwarfs, low-surface brightness objects, Luminous Infrared Galaxies, interacting galaxies) of the dwarf galaxies in the DGS sample.
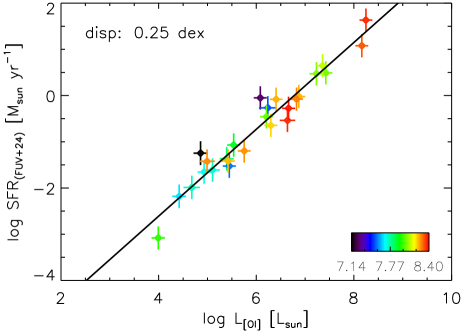
On global galaxy scales, the [Oi]63 line is considered a better intrinsic tracer of the SFR for the DGS sample compared to [Cii] and [Oiii]88, which suggests that the fraction of gas heating in warm and/or dense PDRs is a good approximation of the level of star formation activity across a wide range of metallicities. We do need to caution that the [Oi]63 emission in extremely metal deficient objects is not necessarily linked to the classical PDRs, but might rather be powered by soft X-rays (e.g. Péquignot 2008, Lebouteiller et al. in prep.).
To better approximate the overall gas cooling budget in galaxies, and, hereby, the heating through star formation under the assumption of local thermal equilibrium, we attempt to fit SFR calibrations with different combinations of FIR lines of the form:
| (4) |
By combining the emission of two or three FIR lines (Cii], [Oi]63 and [Oiii]88), we do not improve on the scatter in the SFR calibrations on global galaxy scales. The combination of the brightest FIR lines on spatially resolved scales of about 100 pc did diminish the scatter in the SFR- relations, suggesting that other cooling lines (potentially in the optical wavelength domain) and/or gas heating mechanisms (unrelated to star formation) become important on global galaxy scales.
4.3 Scatter in the SFR- relation
In this section, we focus on identifying the parameters that drive the dispersion in the SFR- relations. Figures 7, 8 and 9 show the observed trends between the scatter in the relations and the metal abundance, dust temperature and ISM structure (as probed through the line ratios [Oi]63/[Cii]+[Oi]63 and [Oiii]88/[Cii]+[Oi]63), respectively. The dust temperatures of 25 out of 32 galaxies are constrained by the results from a modified blackbody fitting routine with variable dust emissivity index presented in Rémy-Ruyer et al. (2013).
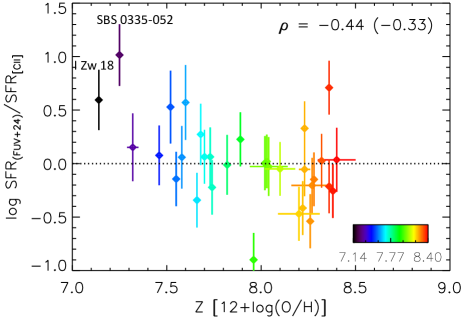
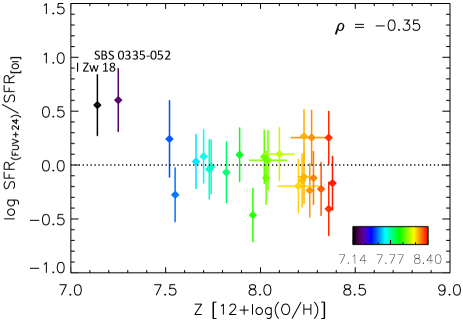
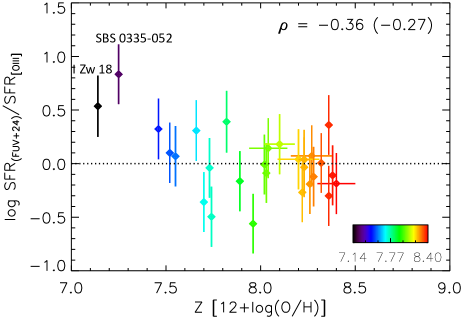
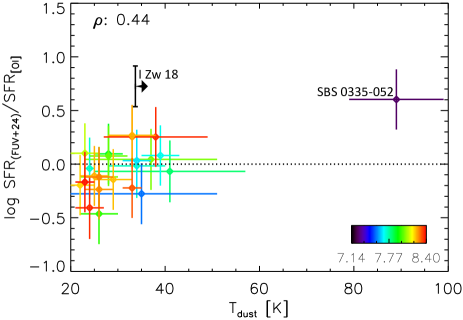
The shallow slope in the SFR calibrations for the DGS sample (as compared to the slopes for the literature sample in Section 5) and the weak correlations in Figure 7 ( -0.44 for [Cii], -0.35 for [Oi]63 and -0.36 for [Oiii]88) suggest that the metal abundance has an effect on the quantitative link between the SFR and FIR line emission (in particular for [Cii]). The true offset of the lowest abundance dwarfs might be even higher due to an underestimation of their SFR based on emission (see discussion in Section A.2). The weaker [Cii] emission towards lower metal abundances is consistent with the drop in [Cii] surface brightness in PDR models by a factor of about 5 from metallicities of 12+(O/H) 8.5 down to 12+(O/H) 7.5 (Röllig et al. 2006) (i.e. drop of a factor of 10 in metallicity) for a single cloud with density 103 cm-3 (see their Figure 6). The weak trends for [Oi]63 and [Oiii]88 are mainly driven by two galaxies of extreme low metal abundance, I Zw 18 and SBS 0335-052, in which the [Oi]63 and [Oiii]88 lines do not seem to add significantly to the overall gas cooling. Since the SFR is unlikely to be overestimated for these galaxies based on +MIPS 24 m (see comparison with other SFR tracers in Section A of the Appendix), the offset of these extremely dust deficient galaxies might suggest that other lines dominate the cooling processes (e.g. Ly ). The gas heating might, alternatively, be dominated by heating mechanisms other than the photoelectric effect (e.g. soft X-ray heating, mechanical heating, cosmic rays), which could disperse the link between the emission of cooling lines and the SFR. For I Zw 18, the heating has indeed been shown to be dominated by soft X-ray heating (Péquignot 2008 and Lebouteiller et al. in prep.), which is likely to also affect the SFR- relations.
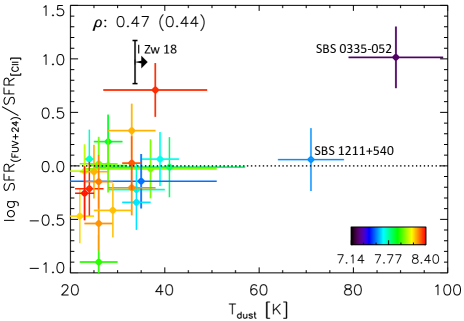
The dust temperatures of galaxies seem to correlate (weakly) with the dispersion in the SFR calibration for [Cii] ( = 0.47) and [Oi]63 ( = 0.44). The global galaxy analysis, hereby, confirms the trends observed in Figure 4 on spatially resolved galaxy scales. With the DGS sources showing a trend of increasing dust temperature with decreasing metal abundance (Rémy-Ruyer et al. 2013), the correlation of the dispersion in the SFR- and SFR- relations with dust temperature seems -at least in part- related to the metallicity of DGS sources.
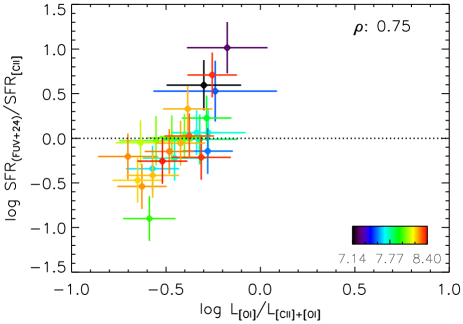
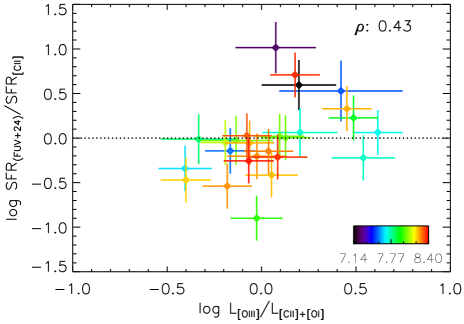
The dispersion in the SFR- relation clearly correlates with the [Oi]63/[Cii]+[Oi]63 line ratio ( = 0.75), while a trend is also present -although less obvious- for [Oiii]88/[Cii]+[Oi]63 ( = 0.43). Making similar plots for the dispersion in the SFR relation for [Oi]63 as a function of [Oi]63/[Cii]+[Oi]63 ( = 0.35) does not reveal a clear trend (graph is not shown here), suggesting that the [Oi]63 line is capable of tracing the SFR in a consistent way irrespective of changes in the ISM structure.
To understand the observed trends between the scatter in the SFR- relations and several physical parameters, we try to link the low abundance to the warm dust temperatures and different ISM structure observed in low-metallicity galaxies. In low abundance galaxies, the fraction of metals is lower in the solid as well as gas phase. The lower abundance of grains, however, does not directly cause a decrease of the photo-electric heating efficiency, since it is, at least partially, compensated by a higher heating rate in dwarf galaxies, exhibited by their hotter average temperature (e.g. Rémy-Ruyer et al. 2013). Similarly, the lower abundances of C and O in the gas phase will be balanced by higher line cooling rates. Deficits of species like C and N could, however, occur relative to the O/H abundance (used here to measure metallicity via the relative O abundance) which could result in relatively less cooling provided by the C lines.
The photon escape fraction might become more important with decreasing metallicity due to the porosity of the ISM, which lowers the energy input for the heating of dust and gas through the photo-electric effect. Other than higher photon escape fractions, the hard radiation fields in low-metallicity environments can also enhance grain charging, making grains less efficient for the photo-electric effect (e.g. Tielens & Hollenbach 1985a; Malhotra et al. 1997; Negishi et al. 2001; Croxall et al. 2012; Farrah et al. 2013).
Indeed, stars at lower metallicities have higher effective temperatures due to line blanketing effects. For a given stellar age and mass, they will produce more hard photons than at solar luminosities. Due to the longer mean free path lengths of UV photons in dust deficient media, the ionization of gas and participation in the gas/dust heating persist over large distances from the ionizing sources in star-forming complexes, which furthermore increases the dust temperatures. As a consequence of the longer distances traversed by ionizing photons, the -emitting zone in galaxies can be enlarged compared to higher metallicity environments due to the deeper penetration of photons capable of photo-dissociating CO molecules (e.g. Poglitsch et al. 1995; Israel et al. 1996; Madden et al. 1997; Israel & Maloney 2011). Also the filling factor of ionized gas phases will enlarge due to the hardness of the radiation field and the transparency of the ISM in low metallicity objects.
Grain properties might, furthermore, vary in objects of lower metal abundance. PAH emission has been shown to decrease below 12 + (O/H) 8.1 (Boselli et al. 2004; Engelbracht et al. 2005; Jackson et el. 2006; Madden et al. 2006; Draine et al. 2007; Engelbracht et al. 2008; Galliano et al. 2008), while the abundance of very small grains grows drastically relative to the large grain population due to the fragmentation of those large grains through shocks experienced in the turbulent ISM (Jones et al. 1996; Lisenfeld et al. 2002; Galliano et al. 2003, 2005). Knowing that PAHs and very small grains are the main contributors to the photo-electric effect, the outcome on the gas heating efficiency and the subsequent gas cooling remains a puzzle.
In summary, we argue that the best SFR tracer varies for different environments depending on the density and ionization state of the gas. Due to the hardness of the radiation field and longer mean free path lengths in metal-poor galaxies, the filling factors of ionized gas media are bound to grow drastically, resulting in [Cii] and [Oi]63 being poor SFR diagnostics. In such highly ionized regions, we expect most of the carbon and oxygen to be locked in elements with higher ionization potentials. The [Cii] and [Oi]63 line emission might, furthermore, be affected by a decrease in the photo-electric efficiency due to higher photon escape fractions and/or grain charging. The reliability of [Oiii]88 as a SFR indicator mainly relies on the filling factor of diffuse, highly ionized gas. The large range covered in [Oiii]88/[Cii]+[Oi]63 (from -0.4 to 0.6) suggests that the relative filling factors of PDRs and ionized media can differ significantly from one galaxy to another, depending on the hardness of the radiation field, excitation conditions and filling factor of low-density gas relative to compact gas clumps. The choice of a reference SFR tracer would, thus, benefit from knowledge on the ionization state and density of the gas. Without any precursory constraints on the ISM conditions, the [Oi]63 line is considered to be the most reliable SFR indicator for galaxies covering a wide range in metal abundances.
5 Prescriptions for extending the SFR calibrations to other galaxy samples
In this section, we derive SFR calibrations for different galaxy populations. Hereto, we gather FIR fine-structure line measurements from the literature for dwarf galaxies, starbursts, Ultra-Luminous InfraRed Galaxies (ULIRGs), galaxies harboring an active galactic nucleus (AGN) and high-redshift galaxies (ranging from to ). The entire galaxy sample constitutes of 530, 150 and 102 galaxies with [Cii], [Oi]63 and [Oiii]88 detections, respectively.
5.1 Literature sample
The literature sample of the local Universe () was assembled from FIR line measurements published based on ISO observations in Brauher et al. (2008) (83 galaxies) and Herschel data in Parkin et al. (2013) (1 galaxy), Sargsyan et al. (2012) (101 galaxies), Díaz-Santos et al. (2013) (206 galaxies), Farrah et al. (2013) (24 galaxies), Graciá-Carpio et al. (2011) and Graciá-Carpio et al. (in prep.) (56 galaxies). Where duplications exist between ISO and Herschel spectroscopy, we choose the Herschel data (see Section A.4 for a comparison between Herschel and ISO spectroscopy measurements.). For the Brauher et al. (2008) sample of ISO observations, we consider all galaxies with emission unresolved with respect to the ISO beam. While De Looze et al. (2011) only considered galaxies with GALEX and MIPS 24 m observations, we extend the literature sample to 84 galaxies from the Brauher et al. (2008) sample with IRAS 12, 25, 60 and 100 m flux measurements, from which the TIR luminosity and, thus, the SFR can be computed. Although some of the galaxies from the Brauher et al. (2008) sample have been observed with Herschel, the lack of their published FIR line fluxes led to the usage of the ISO flux measurements. All the literature works of Herschel observations present the FIR line measurements of all three lines of interest ([Cii], [Oi]63, [Oiii]88), with the exception of Sargsyan et al. (2012) and Díaz-Santos et al. (2013)888Other FIR lines have been observed for the GOALS sample, but have not yet been published. reporting only [Cii] measurements. The Great Observatories All-sky LIRG Survey (GOALS) sample (Díaz-Santos et al. 2013) was complemented with data from other Herschel programs. We exclude sources already presented in Sargsyan et al. (2012) and Graciá-Carpio et al. (in prep.) (and, thus, already part of our literature sample), resulting in 206 sources of the original GOALS sample.
FIR line detections and upper limits for high-redshift galaxies999We refer to high-redshift galaxies starting from redshifts . are gathered for fine-structure lines [Cii], [Oi]63 and [Oiii]88 based on observations with a large variety of ground-based facilities and the Herschel Space Observatory. To convert redshifts to luminosity distances, we use the NED cosmology calculator (Wright 2006) assuming a spatially flat cosmology with = 67.3 km s-1 Mpc-1, = 0.685 and = 0.315 (Planck Collaboration et al. 2013).
5.2 Source classification
We classify galaxies as dwarfs if the criterion is fulfilled, similar to the selection procedure applied in Boselli et al. (2008). We do not distinguish between the different classifications of dwarf galaxies (e.g. blue compact dwarfs, late-type spirals, Magellanic irregulars).
For the more massive galaxy populations, we make a distinction between the dominant power source for infrared emission, i.e. star formation or AGN activity. To homogenize the classification of starburst, composite and AGN sources for the different literature datasets, we adapt the source classification of Sargsyan et al. (2012) to the selection criteria used in Díaz-Santos et al. (2013) based on the EW of the mid-infrared PAH feature at 6.2 m. More specifically, galaxies are considered to be AGN-dominated if EW (PAH 6.2 m) 0.3 and classified as pure starburst if EW (PAH 6.2 m) 0.5. Galaxies characterized by intermediate equivalent width values are considered composite sources, i.e. with starburst and AGN contributions to the mid-infrared features. Applying these selection criteria results in the classification of 94 composite/AGN sources and 7 starburst galaxies from the galaxy sample presented in Sargsyan et al. (2012), among which 19 can be classified as ULIRGs. The GOALS sample consists of 129 starburst galaxies and 77 AGN or composite sources, among which 2 can be assigned ULIRGs. Based on the optical source classification of Farrah et al. (2013), we identify 6 Hii-dominated/starburst galaxies and 18 LINER/Seyfert galaxies. For the Brauher et al. (2008) sample, we use an optical classification similar to De Looze et al. (2011) to distinguish between purely star-forming objects (37 Hii/starburst galaxies) and objects with power sources other than star formation (36 transition/LINER/Seyfert galaxies). Galaxies with no or an uncertain object classification on the NASA Extragalactic Database (NED) were omitted from our sample. The Brauher et al. (2008) sample, furthermore, includes 10 dwarf galaxies. Based on the optical source classification for the SHINING sample (Survey with Herschel of the Interstellar Medium in Nearby Infrared Galaxies, Fischer et al. 2010; Sturm et al. 2010; Graciá-Carpio et al. 2011, Graciá-Carpio et al. in prep.), we identify 20 starburst galaxies and 36 composite or AGN sources, among which 21 objects fulfill the criterion for ULIRGs ( L⊙). We classify the central region of M51 as Hii-dominated, since Parkin et al. (2013) argue that the AGN in M51 does not significantly affect the excitation of gas.
To verify that the optical source classification is consistent with the classification based on the equivalent width (EW) of the mid-infrared PAH feature at 6.2 m, we compare the results for a subsample of 19 galaxies from the SHINING sample with measurements of EW (PAH 6.2 m) reported in Stierwalt et al. (2013) for all objects of the GOALS sample. The optical classification coincides with the limits in EW (PAH 6.2 m) to distinguish between pure starbursts and composite/AGN sources, except for 5 ULIRGs. The high level of obscuration in ULIRGs impedes the classification, but since we treat ULIRGs as a separate population with L⊙ distinct from starburst and composite/AGN galaxies with lower infrared luminosities, we are confident that the different methods applied for the source classification are consistent for galaxies with L⊙.
5.3 Reference SFR calibrator
For dwarf galaxies, we estimate the SFR from the same combination of (un)obscured SFR tracers (GALEX FUV) used for the DGS sample (see Section 2.3). We use the GALEX and MIPS 24 m flux measurements reported in De Looze et al. (2011), when available. For the remaining sources, we retrieve GALEX fluxes from the GALEX catalog101010http://galex.stsci.edu/GR6/. Catalog measurements have been corrected for Galactic extinction according to the recalibrated in Schlafly et al. (2011) from Schlegel et al. (1998), as reported on the NASA/IPAC Extragalactic Database, and assuming an extinction law with = 3.1 derived in Fitzpatrick et al. (1999). Relying on the conclusions drawn in Kennicutt et al. (2009) for the SINGS galaxy sample, we assume that the emission from MIPS 24 m and IRAS 25 m can be used interchangeably. We collect IRAS 25 m flux densities from the IRAS Revised Bright Galaxy Sample (Sanders et al. 2003) or, alternatively, from the IRAS Faint Source Catalog (Moshir & et al. 1990).
For all other galaxies in the literature sample, we estimate the star formation rates based on the TIR luminosity (111111Often FIR luminosities (42.5-122.5 m) are reported, while the SFR calibration requires the total infrared luminosity, (see Table 4). We use a common conversion factor of 1.75 to translate the quoted far-infrared into total infrared luminosities, following Calzetti et al. (2000). Some authors apply the convention that is the luminosity in the wavelength range 40-500 m. We convert the latter FIR luminosities to using a conversion factor of 1.167, following the factor of 1.75 (Calzetti et al. 2000) to convert from FIR (42.5-122.5 m) to TIR (8-1000 m) and the conversion factor = 1.5 (Sanders et al. 2003)., 8 - 1000 m) and the SFR calibration reported in Hao et al. (2011); Murphy et al. (2011) (see also Table 4). Total-infrared luminosities are reported in Sargsyan et al. (2012) and Farrah et al. (2013). For the SHINING sample, we compute FIR (42.5-122.5 m) luminosities from the Herschel continuum flux densities at 63 and 122 m, which could be determined based on a proper continuum estimation from the [Oi]63 and [Nii]122 line observations (see Graciá-Carpio et al. in prep.). Constraining the FIR luminosities in this manner (rather than relying on the total IRAS flux densities to compute FIR) allows us to determine the infrared emission within the same regions as the PACS line observations, preventing any overestimation of the SFR for galaxies only partly covered by Herschel spectroscopy observations. For the Brauher et al. (2008) sample, we use the IRAS flux densities at 12, 25, 60 and 100 m to compute the TIR luminosity based on the formulas from Sanders & Mirabel (1996). Similarly, the IRAS 60 and 100 m flux densities are used to compute and converted to using a correction factor of 1.75 for the GOALS sample. The SFR in M51 is estimated from total-infrared luminosity in the central 80 region, reported in Parkin et al. (2013).
Table 6 summarizes the FIR line measurements obtained from the literature and quotes and SFR of high-redshift sources derived in this manner. Since the uncertainties on the line and FIR luminosities (and thus SFR estimates) for high-redshift galaxies depend strongly on the uncertainty of their assumed distance -relying on a specific cosmological model with underlying uncertainties- as well as a possible magnification factor for lensed sources, we safely assume a conservative uncertainty of 50 on both the line luminosity and SFR estimate.
Tables 7, B and B give an overview of the galaxies classified as dwarfs, Hii/starburst and AGN, respectively, and indicate their name, luminosity distance , reference for their FIR line measurements, total infrared luminosity (8-1000 m) and SFR. In both tables, ULIRGs are indicated with an asterisk behind their name.
5.4 SFR- calibrations
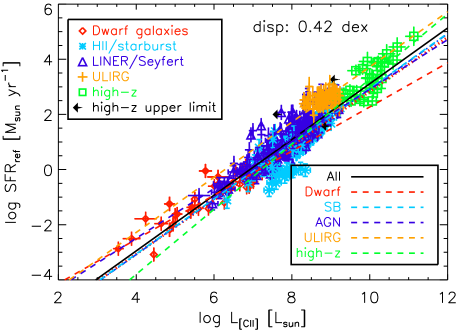
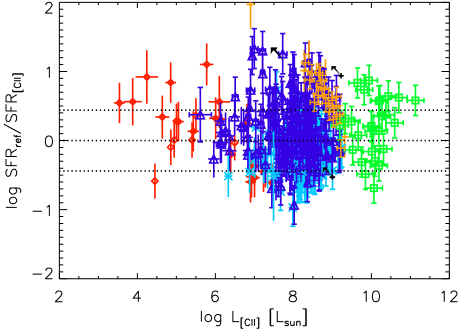
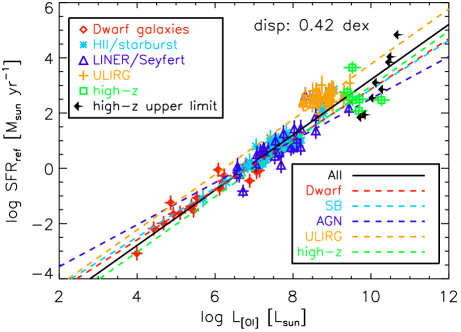
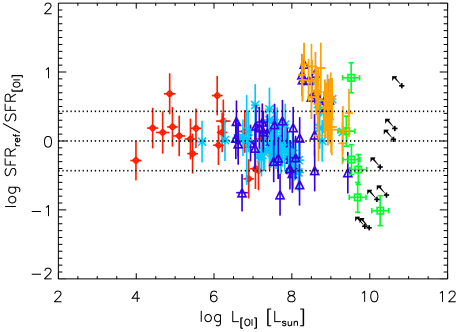
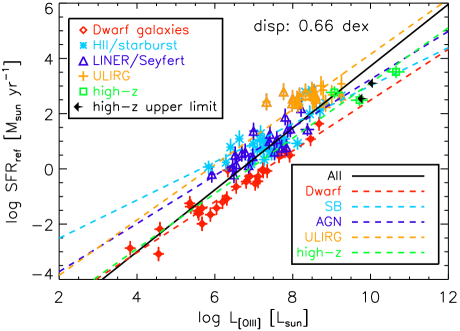
For the sample of literature data, we derive SFR calibrations for each of the fine-structure lines [Cii], [Oi]63 and [Oiii]88, as well as combinations of all lines based on the IDL procedure MPFITFUN and similar functions as defined in Eq. 3 and 4. To identify a correlation between the SFR and FIR line luminosities, we again require that the parameter is determined at the 5 significance level. The best fitting SFR calibrations are presented in Table 3 for each of the different galaxy populations along with the number of galaxies used for the calibration, the slope and intercept of the best fitting line and the dispersion (or the uncertainty on the SFR estimate in parentheses). The SFR calibrations for the entire galaxy sample allow us to compare the different FIR lines and their applicability to trace the star formation across a large sample of galaxy populations. Although all correlations are significant, the large dispersion in the SFR- relations (ranging from 0.42 to 0.66 dex) immediately tells us that [Cii], [Oi]63 and [Oiii]88 are fairly unreliable SFR tracers when calibrated for the entire literature sample. In particular, the link of the [Oiii]88 emission with the SFR appears to depend strongly on galaxy type.
To improve the applicability of each of the FIR lines as a SFR diagnostic, we derive separate SFR calibrations for each of the different galaxy populations in the literature sample, i.e. dwarf galaxies, Hii/starburst galaxies, composite/AGN sources, ULIRGs and high-redshift galaxies. All galaxy subpopulations are exclusive, i.e. the ULIRG population consists of starburst, composite and AGN galaxies, but the starburst and AGN samples do not contain ULIRGs to prevent SFR calibrations biased by the line deficits observed in ULIRGs. For every galaxy population, the fitting of a combination of FIR emission lines to probe the SFR was attempted (according to formula 4) with the aim of decreasing the scatter in the SFR calibrations. The majority of line combinations did not result in an improvement of the scatter, suggesting that other FIR cooling lines are necessary to supplement the [Cii], [Oi]63 and [Oiii]88 emission and, thus, trace a more complete cooling budget. While the three fine-structure lines ([Cii], [Oi]63, [Oiii]88) under investigation in this paper are the brightest FIR lines in our sample of metal-poor dwarfs, other composite line tracers might be more appropriate for high-energy sources like AGNs, starbursts and ULIRGs (e.g. [Nii]122,205, [Niii]57, higher-J CO lines,…). Farrah et al. (2013) find that [Oi]63,145 and [Nii]122 are the most reliable SFR tracers for a sample of ULIRGs, while Zhao et al. (2013) have shown that [Nii]205 is a potentially powerful SFR indicator in local Luminous InfraRed Galaxies (LIRGs) as well as in the more distant Universe.
| SFR calibrator | Number of galaxies | Slope | Intercept | 1 dispersion [dex] |
| SFR calibration: entire literature sample | ||||
| 530 | 1.01 0.02 | -6.99 0.14 | 0.42 (2.6) | |
| 150 | 1.00 0.03 | -6.79 0.22 | 0.42 (2.6) | |
| a𝑎aa𝑎aWe only rely on Herschel observations for the SFR calibrations for [Oiii]88 because of the significant difference found between the calibration of the Herschel and ISO instruments (see Section A.4). | 83 | 1.12 0.06 | -7.48 0.42 | 0.66 (4.6) |
| SFR calibration: metal-poor dwarf galaxies | ||||
| 42 | 0.80 0.05 | -5.73 0.32 | 0.37 (2.3) | |
| 31 | 0.91 0.05 | -6.23 0.30 | 0.27 (1.9) | |
| a𝑎aa𝑎aWe only rely on Herschel observations for the SFR calibrations for [Oiii]88 because of the significant difference found between the calibration of the Herschel and ISO instruments (see Section A.4). | 28 | 0.92 0.05 | -6.71 0.33 | 0.30 (2.0) |
| SFR calibration: HII/starburst galaxies | ||||
| 184 | 1.00 0.04 | -7.06 0.33 | 0.27 (1.9) | |
| 41 | 0.89 0.06 | -6.05 0.44 | 0.20 (1.6) | |
| a𝑎aa𝑎aWe only rely on Herschel observations for the SFR calibrations for [Oiii]88 because of the significant difference found between the calibration of the Herschel and ISO instruments (see Section A.4). | 9 | 0.69 0.09 | -3.89 0.63 | 0.23 (1.7) |
| SFR calibration: composite/AGN sources | ||||
| 212 | 0.90 0.04 | -6.09 0.29 | 0.37 (2.3) | |
| 37 | 0.76 0.09 | -5.08 0.73 | 0.35 (2.2) | |
| a𝑎aa𝑎aWe only rely on Herschel observations for the SFR calibrations for [Oiii]88 because of the significant difference found between the calibration of the Herschel and ISO instruments (see Section A.4). | 20 | 0.87 0.14 | -5.46 0.98 | 0.35 (2.2) |
| SFR calibration: ULIRGs | ||||
| 65 | 1.0b𝑏bb𝑏bThe number of galaxies and/or FIR line luminosity range was insufficient to constrain the slope and intercept of the best fitting line. Therefore, the fitting procedure was performed for a fixed slope of 1. | -6.28 0.04 | 0.31 (2.0) | |
| 35 | 1.0b𝑏bb𝑏bThe number of galaxies and/or FIR line luminosity range was insufficient to constrain the slope and intercept of the best fitting line. Therefore, the fitting procedure was performed for a fixed slope of 1. | -6.23 0.06 | 0.33 (2.1) | |
| 23 | 1.0b𝑏bb𝑏bThe number of galaxies and/or FIR line luminosity range was insufficient to constrain the slope and intercept of the best fitting line. Therefore, the fitting procedure was performed for a fixed slope of 1. | -5.80 0.09 | 0.40 (2.5) | |
| SFR calibration: high-redshift () | ||||
| 27 | 1.18 0.19 | -8.52 1.92 | 0.40 (2.5) | |
| 6 | 1.0b𝑏bb𝑏bThe number of galaxies and/or FIR line luminosity range was insufficient to constrain the slope and intercept of the best fitting line. Therefore, the fitting procedure was performed for a fixed slope of 1. | -7.03 0.29 | 0.64 (4.4) | |
| 3 | 1.0b𝑏bb𝑏bThe number of galaxies and/or FIR line luminosity range was insufficient to constrain the slope and intercept of the best fitting line. Therefore, the fitting procedure was performed for a fixed slope of 1. | -6.89 0.30 | 0.42 (2.6) | |
5.5 Prescriptions for different galaxy populations
Compared to the scatter in the SFR calibrations for the entire literature sample, the dispersion for each of the separate galaxy populations is significantly reduced (see Table 3). Given that the dispersion in the SFR relations also differs significantly among galaxy populations and for the different FIR lines, the correlation between the SFR and FIR lines is clearly dependent on galaxy type. As a guideline, we briefly summarize the reliability of the three FIR fine-structure lines [Cii], [Oi]63 and [Oiii]88 to trace the SFR in each of the following galaxy populations. In case knowledge on the source classification is lacking, the calibrations derived for the [Cii] and [Oi]63 lines for the entire source sample (see top part of Table 3) will provide the most reliable SFR estimates with an uncertainty of factor 2.6.
5.5.1 Metal-poor dwarf galaxies
The most reliable estimate of the SFR in metal-poor dwarf galaxies can be derived from the [Oi]63 luminosity following the calibration:
| (5) |
with an uncertainty factor of 1.9. The star formation activity can be traced with an uncertainty of factor 2 and 2.3 from the [Oiii]88 and [Cii] lines, respectively, based on:
| (6) |
and
| (7) |
All SFR calibrations for metal-poor dwarf galaxies have shallower slopes compared to the entire literature sample, due to their decreasing FIR line luminosity towards lower metal abundances (see Section 4.3).
5.5.2 Starburst galaxies
The [Cii] and [Oi]63 lines can estimate the SFR in starburst galaxies within uncertainty factors of 1.9 and 1.6, respectively, following the calibrations:
| (8) |
and
| (9) |
The SFR calibration for [Cii] is not very different from previous calibrations obtained by De Looze et al. (2011) and Sargsyan et al. (2012) for normal-star forming galaxies and starbursts, respectively (see Fig. 10), which suggests that the [Cii] line is linked to star formation in all galaxies extending from low levels of star formation activity (SFR 0.1 M⊙ ) to extremely active starbursts (SFR 100 M⊙ ).
For [Oiii]88, we only have 9 [Oiii]88 line fluxes from Herschel after excluding the ISO measurements, resulting in the following SFR calibration with an uncertainty factor of 1.7 on the estimated SFR:
| (10) |
Since [Oiii]88 emission requires highly ionized gas of low density, it is not surprising that the [Oiii]88 emission is weaker in starburst galaxies (with an average [Oiii]88/[Oi]63 line ratio of 0.4 in starburst as compared to 3 in dwarfs), where gas densities are also higher and mean free path lengths shorter. Although the hard radiation to ionize O+ is likely present in local starbursts, the radiation is produced in compact, dusty regions, prohibiting the high-energy photons to reach the lower density gas surrounding dense cores (e.g. Abel et al. 2009).
5.5.3 Composite/AGN sources
The SFR calibrations are more dispersed for composite and AGN sources compared to starburst galaxies. The substantial scatter might be due to a possible contribution from dust heated by the AGN to the total infrared luminosity (e.g. Sargsyan et al. 2012). Alternatively, some AGNs appear to show line deficits similar to ULIRGs caused by highly charged dust grains which limit the photoelectric heating efficiency (Tielens & Hollenbach 1985a; Malhotra et al. 1997; Negishi et al. 2001; Croxall et al. 2012; Farrah et al. 2013) and/or high dust-to-gas opacities due to an increased average ionization parameter (e.g. Graciá-Carpio et al. 2011; Díaz-Santos et al. 2013; Farrah et al. 2013). Part of the dispersion for the [Oi]63 line might be caused by self-absorption and optical depth effects as well as the excitation through shocks131313The literature data for AGNs and ULIRGs mostly correspond to total galaxy values, whereas the link between the SFR and [Oi]63 line might be more dispersed zooming in into the central regions of galaxies hosting AGNs..
The star formation activity in AGNs can be constrained up to a factor of 2.3 based on all three lines:
| (11) |
| (12) |
| (13) |
Several combinations of FIR lines, in particular for [Oiii]88, result in SFR calibrations with reduced scatter. With the [Oiii]88 line being on average 5 times fainter than [Cii], we believe the results are an artifact of the fitting procedure and do not have any physical interpretation.
5.5.4 Ultra-Luminous InfraRed galaxies
Since the ULIRG sample does not cover a sufficient range in luminosity to constrain the slope of the SFR calibration, we fix the slope to a value of 1 (similar to the slope for the entire literature sample) and determine the intercept from the fitting procedure. The SFR calibrations for ULIRGs are offset by about 0.5 to 1.0 dex from starbursts and AGNs due to line deficits relative to their total-infrared luminosity, which are caused either by the compactness of the size of starburst regions (e.g. Graciá-Carpio et al. 2011; Díaz-Santos et al. 2013; Farrah et al. 2013) and/or enhanced grain charging in regions with high / values (Tielens & Hollenbach 1985a; Malhotra et al. 1997; Negishi et al. 2001; Croxall et al. 2012; Farrah et al. 2013). Interestingly, the occurrence of line deficits has been shown to coincide with the transition between two different modes of star formation (Graciá-Carpio et al. 2011), i.e. the star-forming disk galaxies populating the main sequence in the gas-star formation diagrams and ultra-luminous gas-rich mergers with elevated levels of star formation for the same gas fractions (Daddi et al. 2010; Genzel et al. 2010).
With a fixed slope of 1, the SFR can be determined from the [Cii], [Oi]63 and [Oiii]88 luminosities within uncertainty factors of 2, 2.1 and 2.5, respectively, and using the calibrations:
| (14) |
| (15) |
| (16) |
The SFR calibrations derived from our sample of ULIRGs are offset from the SFR calibrations reported by Farrah et al. (2013) in the sense that our SFR estimates are 2 to 4 times higher. Given that our literature sample contains the same ULIRGs presented in Farrah et al. (2013), we believe the difference in the SFR estimate can be attributed to the reference SFR tracer that was used to calibrate the SFR relations. While we rely on the TIR luminosity and the SFR(TIR) calibration presented in Hao et al. (2011), Farrah et al. (2013) use the PAH luminosity and the SFR(PAH) relation presented in Farrah et al. (2007).
5.5.5 High-redshift galaxies
As [Cii] observations in high-redshift galaxies have been more popular than other FIR fine-structure lines, we can report a relatively reliable SFR calibration for the [Cii] line, based on:
| (17) |
Most high-redshift sources follow the trend of local starbursts and AGNs but with significant dispersion (0.40 dex), which results in an uncertainty factor on the SFR estimate of about 2.5. The large scatter can be attributed to some high-redshift galaxies, revealing similar [Cii] deficits as ULIRGs. Relying on the warmer temperatures inferred for high-redshift sources (e.g. Magdis et al. 2012), it might not be surprising that [Cii] is incapable of tracing the SFR accurately due to the presence of strong radiation fields.
For the [Oi]63 and [Oiii]88 lines, the literature high-redshift sample did not contain a sufficient number of objects to constrain the slope and intercept in our fitting procedure. Therefore, the slope was fixed to a value of 1, which is similar to the slope in the SFR calibrations for the entire literature sample. The SFR calibrations for [Oi]63 and [Oiii]88 determined in this way are:
| (18) |
and
| (19) |
The scatter in the SFR relations for [Oi]63 quickly increases with only 6 high-redshift detections resulting in an uncertainty factor of 4.4 on the SFR estimate. The [Oi]63 detections from Sturm et al. (2010), Coppin et al. (2012) and Ferkinhoff et al. (2014) suggest that the line emission is significantly brighter at high-redshift compared to the SFR calibration derived in the local Universe, which could imply that the ISM in those early Universe objects is warmer and denser compared to average conditions in the local Universe. The [Oi]63 line might, however, easily become optically thick and could be hampered by other excitation mechanisms (e.g. shocks) in dusty high-redshift galaxies, especially during merger episodes. We furthermore need to caution that the few [Oi]63 detections of high-redshift galaxies might be biased towards hot, dense objects given the difficulty to detect [Oi]63 at high redshift. One exception is the intermediate redshift () galaxy IRAS F16413+3954 (Dale et al. 2004), which shows a similar [Oi]63 deficit as local ULIRGs. More [Oi]63 detections at high-redshift sources are mandatory to infer the behavior of this line with the star formation activity in early Universe objects.
Based on the high-redshift [Oiii]88 detections and upper limits reported in the literature for 5 galaxies (Ivison et al. 2010b; Ferkinhoff et al. 2010; Valtchanov et al. 2011), the [Oiii]88 line might be a potentially powerful tracer of the star formation activity in the early Universe in the absence of [Cii] and with a similar degree of uncertainty on the SFR estimate (factor of 2.6). Requiring hard radiation to ionize O+, it is not surprising that the [Oiii]88 line is bright in high-redshift sources, which are known to harbor strong radiation fields (e.g. Magdis et al. 2012). Aside from the compact star-forming regions, high-redshift sources could have low-density components where the chemistry and heating is regulated by the hard radiation field.
6 Conclusions
Based on Herschel observations of low-metallicity dwarf galaxies from the Dwarf Galaxy Survey, we have analyzed the applicability of FIR fine-structure lines to reliably trace the star formation activity. More specifically, we investigated whether three of the brightest cooling lines in the DGS sample ([Cii], [Oi]63, [Oiii]88) are linked to the star formation rate as probed through a composite SFR tracer (GALEX +MIPS 24 m). We briefly summarize the results of our analysis:
-
•
On spatially resolved galaxy scales, the [Oiii]88 line shows the tightest correlation with the SFR (0.25 dex), which provides determination of the SFR with an uncertainty factor of 1.6. Also [Oi]63 is a reasonably good SFR tracer with an uncertainty factor of 1.7 on the SFR estimate. The spatially resolved relation between [Cii] and the SFR is heavily dispersed and does not allow us to constrain the SFR within a factor of 2.
-
•
The dispersion in the SFR calibrations results from the diversity in ISM conditions (i.e. density and ionization state of the gas) for the DGS sample covering a wide range in metallicity, rather than from variations within one single galaxy (on spatially resolved scales).
-
•
On global galaxy scales, the dispersion in the SFR- relation (0.38 dex) is again worse compared to the [Oi]63 (0.25 dex) and [Oiii]88 (0.30 dex) lines. The [Oi]63 line is the most reliable overall SFR indicator in galaxies of sub-solar metallicity with an uncertainty factor of 1.8 on the SFR estimate, while the SFR derived from [Oiii]88 is uncertain by a factor of 2. The [Cii] line is not considered a reliable SFR tracer in galaxies of low metal abundance.
-
•
The scatter in the SFR- relation increases towards low metallicities, warm dust temperatures and large filling factors of diffuse, highly ionized gas. Due to the porosity of the ISM and the exposure to hard radiation fields, an increased number of ionizing photons is capable of ionizing gas at large distances from the star-forming regions, which favors line cooling through ionized gas tracers such as [Oiii]88. The photo-electric efficiency might, furthermore, reduce in low-metallicity environments due to grain charging and/or increased photon escape fractions.
-
•
On spatially resolved scales, we can reduce the scatter in the SFR calibration by combining the emission from multiple FIR lines. Ideally, we want to probe the emission from all cooling lines that constitute the total gas cooling budget.
Based on the assembly of literature data, we furthermore analyze the applicability of fine-structure lines [Cii], [Oi]63 and [Oiii]88 to probe the SFR (as traced by the TIR luminosity) in Hii/starburst galaxies, AGNs, ULIRGs and high-redshift objects:
-
•
The [Cii] and [Oi]63 lines are considered to be the most reliable SFR tracers to recover the star formation activity in starburst galaxies with uncertainty factors of 1.9 and 1.6, respectively. The [Oiii] line, on the other hand, is weak and the SFR calibration could not be well constrained due to the low number of Herschel [Oiii]88 detections in starbursts.
-
•
All three FIR lines can recover the SFR from composite or AGN sources within an uncertainty of factor 2.3. The increased scatter in the SFR calibrations for AGNs (as compared to starbursts) might result from a possible AGN contribution to the total infrared luminosity (used to derive the SFR). Alternatively, some AGNs might show line deficits similar to ULIRGs.
-
•
ULIRGs are offset from the SFR calibrations for starbursts and AGNs due to line deficits relative to their total-infrared luminosity and, therefore, require separate SFR calibrations. The star formation rate in ULIRGs is preferentially traced through [Cii] and [Oi]63 line emission, providing SFR estimates with uncertainties of factor 2, while the SFR([Oiii]) estimate is uncertain by a factor of 2.5.
-
•
At high-redshift, we can only reliably determine a SFR calibration for the [Cii] line (with an uncertainty factor of 2.5 on the SFR estimate), due to the low number of observations for the other lines. The relatively few detections of [Oi]63 and [Oiii]88 appear to be bright at high-redshift, suggesting that the [Oi]63 and [Oiii]88 lines are also potentially powerful tracers of the SFR at high redshift, but more detections are mandatory to acquire conclusive evidence.
Acknowledgements.
IDL is a postdoctoral researcher of the FWO-Vlaanderen (Belgium). V.L. is supported by a CEA/Marie Curie Eurotalents fellowship. This research was supported by the Agence Nationale de la Recherche (ANR) through the programme SYMPATICO (Program Blanc Projet ANR-11-BS56-0023). PACS has been developed by a consortium of institutes led by MPE (Germany) and including UVIE (Austria); KU Leuven, CSL, IMEC (Belgium); CEA, LAM (France); MPIA (Germany); INAFIFSI/ OAA/OAP/OAT, LENS, SISSA (Italy); IAC (Spain). This development has been supported by the funding agencies BMVIT (Austria), ESA-PRODEX (Belgium), CEA/CNES (France), DLR (Germany), ASI/INAF (Italy), and CICYT/ MCYT (Spain). SPIRE has been developed by a consortium of institutes led by Cardiff University (UK) and including Univ. Lethbridge (Canada); NAOC (China); CEA, LAM (France); IFSI, Univ. Padua (Italy); IAC (Spain); Stockholm Observatory (Sweden); Imperial College London, RAL, UCL-MSSL, UKATC, Univ. Sussex (UK); and Caltech, JPL, NHSC, Univ. Colorado (USA). This development has been supported by national funding agencies: CSA (Canada); NAOC (China); CEA, CNES, CNRS (France); ASI (Italy); MCINN (Spain); SNSB (Sweden); STFC and UKSA (UK); and NASA (USA).References
- Abel et al. (2009) Abel, N. P., Dudley, C., Fischer, J., Satyapal, S., & van Hoof, P. A. M. 2009, ApJ, 701, 1147
- Aggarwal & Keenan (1999) Aggarwal, K. M., & Keenan, F. P. 1999, ApJS, 123, 311
- Alonso-Herrero et al. (2006) Alonso-Herrero, A., Rieke, G. H., Rieke, M. J., et al. 2006, ApJ, 650, 835
- Aniano et al. (2011) Aniano, G., Draine, B. T., Gordon, K. D., & Sandstrom, K. 2011, PASP, 123, 1218
- Annibali et al. (2009) Annibali, F., Tosi, M., Monelli, M., et al. 2009, AJ, 138, 169
- Asplund et al. (2009) Asplund, M., Grevesse, N., Sauval, A. J., & Scott, P. 2009, AR&A, 47, 481
- Baugh et al. (2005) Baugh, C. M., Lacey, C. G., Frenk, C. S., et al. 2005, MNRAS, 356, 1191
- Bendo et al. (2008) Bendo, G. J., Draine, B. T., Engelbracht, C. W., et al. 2008, MNRAS, 389, 629
- Bendo et al. (2010) Bendo, G. J., Wilson, C. D., Pohlen, M., et al. 2010, A&A, 518, L65
- Bendo et al. (2012a) Bendo, G. J., Boselli, A., Dariush, A., et al. 2012, MNRAS, 419, 1833
- Bendo et al. (2012b) Bendo, G. J., Galliano, F., & Madden, S. C. 2012, MNRAS, 423, 197
- Boquien et al. (2011) Boquien, M., Calzetti, D., Combes, F., et al. 2011, AJ, 142, 111
- Boselli et al. (2002) Boselli, A., Gavazzi, G., Lequeux, J., & Pierini, D. 2002, A&A, 385, 454
- Boselli et al. (2004) Boselli, A., Lequeux, J., & Gavazzi, G. 2004, A&A, 428, 409
- Boselli et al. (2008) Boselli, A., Boissier, S., Cortese, L., & Gavazzi, G. 2008, ApJ, 674, 742
- Brauher et al. (2008) Brauher, J. R., Dale, D. A., & Helou, G. 2008, ApJS, 178, 280
- Calzetti et al. (2000) Calzetti, D., Armus, L., Bohlin, R. C., et al. 2000, ApJ, 533, 682
- Calzetti et al. (2005) Calzetti, D., Kennicutt, R. C., Jr., Bianchi, L., et al. 2005, ApJ, 633, 871
- Calzetti et al. (2007) Calzetti, D., Kennicutt, R. C., Engelbracht, C. W., et al. 2007, ApJ, 666, 870
- Calzetti et al. (2010) Calzetti, D., Wu, S.-Y., Hong, S., et al. 2010, ApJ, 714, 1256
- Cannon & Skillman (2004) Cannon, J. M., & Skillman, E. D. 2004, ApJ, 610, 772
- Cannon et al. (2006) Cannon, J. M., Walter, F., Armus, L., et al. 2006, ApJ, 652, 1170
- Condon et al. (1998) Condon, J. J., Cotton, W. D., Greisen, E. W., et al. 1998, AJ, 115, 1693
- Coppin et al. (2012) Coppin, K. E. K., Danielson, A. L. R., Geach, J. E., et al. 2012, MNRAS, 427, 520
- Cormier et al. (2010) Cormier, D., Madden, S. C., Hony, S., et al. 2010, A&A, 518, L57
- Cortese et al. (2012) Cortese, L., Boissier, S., Boselli, A., et al. 2012, A&A, 544, A101
- Cox et al. (2011) Cox, P., Krips, M., Neri, R., et al. 2011, ApJ, 740, 63
- Crawford et al. (1985) Crawford, M. K., Genzel, R., Townes, C. H., & Watson, D. M. 1985, ApJ, 291, 755
- Croxall et al. (2012) Croxall, K. V., Smith, J. D., Wolfire, M. G., et al. 2012, ApJ, 747, 81
- Daddi et al. (2010) Daddi, E., Elbaz, D., Walter, F., et al. 2010, ApJ, 714, L118
- Dale & Helou (2002) Dale, D. A., & Helou, G. 2002, ApJ, 576, 159
- Dale et al. (2004) Dale, D. A., Helou, G., Brauher, J. R., et al. 2004, ApJ, 604, 565
- Davé (2008) Davé, R. 2008, MNRAS, 385, 147
- De Breuck et al. (2011) De Breuck, C., Maiolino, R., Caselli, P., et al. 2011, A&A, 530, L8
- de Jong et al. (1985) de Jong, T., Klein, U., Wielebinski, R., & Wunderlich, E. 1985, A&A, 147, L6
- De Looze et al. (2011) De Looze, I., Baes, M., Bendo, G. J., Cortese, L., & Fritz, J. 2011, MNRAS, 416, 2712
- Díaz-Santos et al. (2013) Díaz-Santos, T., Armus, L., Charmandaris, V., et al. 2013, ApJ, 774, 68
- Draine et al. (2007) Draine, B. T., Dale, D. A., Bendo, G., et al. 2007, ApJ, 663, 866
- Engelbracht et al. (2005) Engelbracht, C. W., Gordon, K. D., Rieke, G. H., et al. 2005, ApJ, 628, L29
- Engelbracht et al. (2007) Engelbracht, C. W., Blaylock, M., Su, K. Y. L., et al. 2007, PASP, 119, 994
- Engelbracht et al. (2008) Engelbracht, C. W., Rieke, G. H., Gordon, K. D., et al. 2008, ApJ, 678, 804
- Farrah et al. (2007) Farrah, D., Bernard-Salas, J., Spoon, H. W. W., et al. 2007, ApJ, 667, 149
- Farrah et al. (2013) Farrah, D., Lebouteiller, V., Spoon, H. W. W., et al. 2013, ApJ, 776, 38
- Ferkinhoff et al. (2010) Ferkinhoff, C., Hailey-Dunsheath, S., Nikola, T., et al. 2010, ApJL, 714, L147
- Ferkinhoff et al. (2014) Ferkinhoff, C., Brisbin, D., Parshley, S., et al. 2014, ApJ, 780, 142
- Fioc & Rocca-Volmerange (1999) Fioc, M., & Rocca-Volmerange, B. 1999, A&A, 344, 393
- Fischer et al. (2010) Fischer, J., Sturm, E., González-Alfonso, E., et al. 2010, A&A, 518, L41
- Fitzpatrick et al. (1999) Fitzpatrick, E. L. 1999, PASP, 111, 63
- Franx et al. (1997) Franx, M., Illingworth, G. D., Kelson, D. D., van Dokkum, P. G., & Tran, K.-V. 1997, ApJ, 486, L75
- Galametz et al. (2009) Galametz, M., Madden, S., Galliano, F., et al. 2009, A&A, 508, 645
- Galametz et al. (2010) Galametz, M., Madden, S. C., Galliano, F., et al. 2010, A&A, 518, L55
- Galametz et al. (2011) Galametz, M., Madden, S. C., Galliano, F., et al. 2011, A&A, 532, A56
- Galliano et al. (2003) Galliano, F., Madden, S. C., Jones, A. P., et al. 2003, A&A, 407, 159
- Galliano et al. (2005) Galliano, F., Madden, S. C., Jones, A. P., Wilson, C. D., & Bernard, J.-P. 2005, A&A, 434, 867
- Galliano et al. (2008) Galliano, F., Dwek, E., & Chanial, P. 2008, ApJ, 672, 214
- Gavazzi et al. (1999) Gavazzi, G., Boselli, A., Scodeggio, M., Pierini, D., & Belsole, E. 1999, MNRAS, 304, 595
- Gavazzi et al. (2003) Gavazzi, G., Boselli, A., Donati, A., Franzetti, P., & Scodeggio, M. 2003, A&A, 400, 451
- Genzel et al. (2010) Genzel, R., Tacconi, L. J., Gracia-Carpio, J., et al. 2010, MNRAS, 407, 2091
- Gil de Paz et al. (2003) Gil de Paz, A., Madore, B. F., & Pevunova, O. 2003, ApJS, 147, 29
- Glover & Clark (2014) Glover, S. C. O., & Clark, P. C. 2014, MNRAS, 437, 9
- Goldsmith et al. (2012) Goldsmith, P. F., Langer, W. D., Pineda, J. L., & Velusamy, T. 2012, ApJS, 203, 13
- Gordon et al. (2008) Gordon, K. D., Engelbracht, C. W., Rieke, G. H., et al. 2008, ApJ, 682, 336
- Graciá-Carpio et al. (2011) Graciá-Carpio, J., Sturm, E., Hailey-Dunsheath, S., et al. 2011, ApJL, 728, L7
- Griffin et al. (2010) Griffin, M. J., Abergel, A., Abreu, A., et al. 2010, A&A, 518, L3
- Groves et al. (2012) Groves, B., Krause, O., Sandstrom, K., et al. 2012, MNRAS, 426, 892
- Hailey-Dunsheath et al. (2010) Hailey-Dunsheath, S., Nikola, T., Stacey, G. J., et al. 2010, ApJL, 714, L162
- Hao et al. (2011) Hao, C.-N., Kennicutt, R. C., Johnson, B. D., et al. 2011, ApJ, 741, 124
- Heiles (1994) Heiles, C. 1994, ApJ, 436, 720
- Helou et al. (1985) Helou, G., Soifer, B. T., & Rowan-Robinson, M. 1985, ApJL, 298, L7
- Helou (2000) Helou, G. 2000, Infrared Space Astronomy, Today and Tomorrow, 337
- Helou et al. (2004) Helou, G., Roussel, H., Appleton, P., et al. 2004, ApJS, 154, 253
- Herrera-Camus et al. (2012) Herrera-Camus, R., Fisher, D. B., Bolatto, A. D., et al. 2012, ApJ, 752, 112
- Hodge et al. (1991) Hodge, P., Smith, T., Eskridge, P., MacGillivray, H., & Beard, S. 1991, ApJ, 379, 621
- Hollenbach & McKee (1989) Hollenbach, D., & McKee, C. F. 1989, ApJ, 342, 306
- Houck et al. (2004) Houck, J. R., Charmandaris, V., Brandl, B. R., et al. 2004, ApJS, 154, 211
- Hunt et al. (2005) Hunt, L. K., Dyer, K. K., & Thuan, T. X. 2005, A&A, 436, 837
- Hunter et al. (2001) Hunter, D. A., Kaufman, M., Hollenbach, D. J., et al. 2001, ApJ, 553, 121
- Hwang et al. (2012) Hwang, H. S., Geller, M. J., Diaferio, A., & Rines, K. J. 2012, ApJ, 752, 64
- Iono et al. (2006) Iono, D., Yun, M. S., Elvis, M., et al. 2006, ApJL, 645, L97
- Israel et al. (1996) Israel, F. P., Maloney, P. R., Geis, N., et al. 1996, ApJ, 465, 738
- Israel & Maloney (2011) Israel, F. P., & Maloney, P. R. 2011, A&A, 531, A19
- Ivison et al. (2010a) Ivison, R. J., Smail, I., Papadopoulos, P. P., et al. 2010, MNRAS, 404, 198
- Ivison et al. (2010b) Ivison, R. J., Swinbank, A. M., Swinyard, B., et al. 2010, A&A, 518, L35
- Jackson et el. (2006) Jackson, D. C., Cannon, J. M., Skillman, E. D., et al. 2006, ApJ, 646, 192
- Jones et al. (1996) Jones, A. P., Tielens, A. G. G. M., & Hollenbach, D. J. 1996, ApJ, 469, 740
- Kaufman et al. (1999) Kaufman, M. J., Wolfire, M. G., Hollenbach, D. J., & Luhman, M. L. 1999, ApJ, 527, 795
- Kaufman et al. (2006) Kaufman, M. J., Wolfire, M. G., & Hollenbach, D. J. 2006, ApJ, 644, 283
- Kennicutt (1998) Kennicutt, R. C., Jr. 1998, AR&A, 36, 189
- Kennicutt et al. (2003) Kennicutt, R. C., Jr., Armus, L., Bendo, G., et al. 2003, PASP, 115, 928
- Kennicutt et al. (2008) Kennicutt, R. C., Jr., Lee, J. C., Funes, S. J., José G., Sakai, S., & Akiyama, S. 2008, ApJS, 178, 247
- Kennicutt et al. (2009) Kennicutt, R. C., Jr., Hao, C.-N., Calzetti, D., et al. 2009, ApJ, 703, 1672
- Kennicutt & Evans (2012) Kennicutt, R. C., & Evans, N. J. 2012, AR&A, 50, 531
- Kraemer et al. (1996) Kraemer, K., Jackson, J. M., & Lane, A. P. 1996, Bulletin of the American Astronomical Society, 28, 1302
- Kroupa & Weidner (2003) Kroupa, P., & Weidner, C. 2003, ApJ, 598, 1076
- Lacey et al. (2008) Lacey, C. G., Baugh, C. M., Frenk, C. S., et al. 2008, MNRAS, 385, 1155
- Larson (1998) Larson, R. B. 1998, MNRAS, 301, 569
- Lebouteiller et al. (2004) Lebouteiller, V., Kunth, D., Lequeux, J., et al. 2004, A&A, 415, 55
- Lebouteiller et al. (2012) Lebouteiller, V., Cormier, D., Madden, S. C., et al. 2012, A&A, 548, A91
- Lee et al. (2013) Lee, J. C., Hwang, H. S., & Ko, J. 2013, ApJ, 774, 62
- Lequeux (1989) Lequeux, J. 1989, Evolution of Galaxies: Astronomical Observations, 333, 147
- Leroy et al. (2008) Leroy, A. K., Walter, F., Brinks, E., et al. 2008, AJ, 136, 2782
- Li et al. (2013) Li, Y., Crocker, A. F., Calzetti, D., et al. 2013, ApJ, 768, 180
- Lisenfeld et al. (2002) Lisenfeld, U., Israel, F. P., Stil, J. M., & Sievers, A. 2002, A&A, 382, 860
- Luhman et al. (1998) Luhman, M. L., Satyapal, S., Fischer, J., et al. 1998, ApJL, 504, L11
- Luhman et al. (2003) Luhman, M. L., Satyapal, S., Fischer, J., et al. 2003, ApJ, 594, 758
- Madden et al. (1997) Madden, S. C., Poglitsch, A., Geis, N., Stacey, G. J., & Townes, C. H. 1997, ApJ, 483, 200
- Madden (2000) Madden, S. C. 2000, NAR, 44, 249
- Madden et al. (2006) Madden, S. C., Galliano, F., Jones, A. P., & Sauvage, M. 2006, A&A, 446, 877
- Madden et al. (2013) Madden, S. C., Rémy-Ruyer, A., Galametz, M., et al. 2013, PASP, 125, 600
- Magdis et al. (2012) Magdis, G. E., Daddi, E., Béthermin, M., et al. 2012, ApJ, 760, 6
- Maiolino et al. (2005) Maiolino, R., Cox, P., Caselli, P., et al. 2005, A&A, 440, L51
- Maiolino et al. (2009) Maiolino, R., Caselli, P., Nagao, T., et al. 2009, A&A, 500, L1
- Malhotra et al. (1997) Malhotra, S., Helou, G., Stacey, G., et al. 1997, ApJL, 491, L27
- Malhotra et al. (2001) Malhotra, S., Kaufman, M. J., Hollenbach, D., et al. 2001, ApJ, 561, 766
- Markwardt (2009) Markwardt, C. B. 2009, Astronomical Data Analysis Software and Systems XVIII, 411, 251
- Marsden et al. (2005) Marsden, G., Borys, C., Chapman, S. C., Halpern, M., & Scott, D. 2005, MNRAS, 359, 43
- Mateo (1998) Mateo, M. L. 1998, ARA&A, 36, 435
- McKee & Ostriker (2007) McKee, C. F., & Ostriker, E. C. 2007, AR&A, 45, 565
- Moshir & et al. (1990) Moshir, M., & et al. 1990, IRAS Faint Source Catalogue, version 2.0 (1990), 0
- Moustakas & Kennicutt (2006) Moustakas, J., & Kennicutt, R. C., Jr. 2006, ApJS, 164, 81
- Murphy et al. (2011) Murphy, E. J., Condon, J. J., Schinnerer, E., et al. 2011, ApJ, 737, 67
- Negishi et al. (2001) Negishi, T., Onaka, T., Chan, K.-W., & Roellig, T. L. 2001, A&A, 375, 566
- Östlin et al. (2009) Östlin, G., Hayes, M., Kunth, D., et al. 2009, AJ, 138, 923
- Ouchi et al. (2013) Ouchi, M., Ellis, R., Ono, Y., et al. 2013, ApJ, 778, 102
- Parkin et al. (2013) Parkin, T. J., Wilson, C. D., Schirm, M. R. P., et al. 2013, ApJ, 776, 65
- Péquignot (2008) Péquignot, D. 2008, A&A, 478, 371
- Pérez-González et al. (2006) Pérez-González, P. G., Kennicutt, R. C., Jr., Gordon, K. D., et al. 2006, ApJ, 648, 987
- Pflamm-Altenburg et al. (2007) Pflamm-Altenburg, J., Weidner, C., & Kroupa, P. 2007, ApJ, 671, 1550
- Pilbratt et al. (2010) Pilbratt, G. L., Riedinger, J. R., Passvogel, T., et al. 2010, A&A, 518, L1
- Pilyugin & Thuan (2005) Pilyugin, L. S., & Thuan, T. X. 2005, ApJ, 631, 231
- Planck Collaboration et al. (2013) Planck Collaboration, Ade, P. A. R., Aghanim, N., et al. 2013, subm. to A&A (arXiv:1303.5076)
- Poglitsch et al. (1995) Poglitsch, A., Krabbe, A., Madden, S. C., et al. 1995, ApJ, 454, 293
- Poglitsch et al. (1996) Poglitsch, A., Herrmann, F., Genzel, R., et al. 1996, ApJL, 462, L43
- Poglitsch et al. (2010) Poglitsch, A., Waelkens, C., Geis, N., et al. 2010, A&A, 518, L2
- Rawle et al. (2013) Rawle, T. D., Egami, E., Bussmann, R. S., et al. 2013, arXiv:1310.4090
- Rémy-Ruyer et al. (2013) Rémy-Ruyer, A., Madden, S. C., Galliano, F., et al. 2013, A&A, 557, A95
- Rémy-Ruyer et al. (2014) Rémy-Ruyer, A., Madden, S. C., Galliano, F., et al. 2014, A&A, 563, A31
- Riechers et al. (2009) Riechers, D. A., Walter, F., Carilli, C. L., & Lewis, G. F. 2009, ApJ, 690, 463
- Riechers et al. (2013) Riechers, D. A., Bradford, C. M., Clements, D. L., et al. 2013, Nature, 496, 329
- Rieke et al. (2009) Rieke, G. H., Alonso-Herrero, A., Weiner, B. J., et al. 2009, ApJ, 692, 556
- Röllig et al. (2006) Röllig, M., Ossenkopf, V., Jeyakumar, S., Stutzki, J., & Sternberg, A. 2006, A&A, 451, 917
- Roy & Kunth (1995) Roy, J.-R., & Kunth, D. 1995, A&A, 294, 432
- Sanders & Mirabel (1996) Sanders, D. B., & Mirabel, I. F. 1996, AR&A, 34, 749
- Sanders et al. (2003) Sanders, D. B., Mazzarella, J. M., Kim, D.-C., Surace, J. A., & Soifer, B. T. 2003, AJ, 126, 1607
- Salim et al. (2007) Salim, S., Rich, R. M., Charlot, S., et al. 2007, ApJS, 173, 267
- Sandstrom et al. (2012) Sandstrom, K. M., Bolatto, A. D., Bot, C., et al. 2012, ApJ, 744, 20
- Sargsyan et al. (2012) Sargsyan, L., Lebouteiller, V., Weedman, D., et al. 2012, ApJ, 755, 171
- Schlafly et al. (2011) Schlafly, E. F., & Finkbeiner, D. P. 2011, ApJ, 737, 103
- Schlegel et al. (1998) Schlegel, D. J., Finkbeiner, D. P., & Davis, M. 1998, ApJ, 500, 525
- Schurer et al. (2009) Schurer, A., Calura, F., Silva, L., et al. 2009, MNRAS, 394, 2001
- Silk & Werner (1969) Silk, J., & Werner, M. W. 1969, ApJ, 158, 185
- Smith et al. (2012) Smith, M. W. L., Eales, S. A., Gomez, H. L., et al. 2012, ApJ, 756, 40
- Stacey et al. (1991) Stacey, G. J., Geis, N., Genzel, R., et al. 1991, ApJ, 373, 423
- Stacey et al. (2010) Stacey, G. J., Hailey-Dunsheath, S., Ferkinhoff, C., et al. 2010, ApJ, 724, 957
- Stierwalt et al. (2013) Stierwalt, S., Armus, L., Surace, J. A., et al. 2013, ApJS, 206, 1
- Sturm et al. (2010) Sturm, E., Verma, A., Graciá-Carpio, J., et al. 2010, A&A, 518, L36
- Swinbank et al. (2012) Swinbank, A. M., Karim, A., Smail, I., et al. 2012, MNRAS, 427, 1066
- Thuan et al. (1999) Thuan, T. X., Sauvage, M., & Madden, S. 1999, ApJ, 516, 783
- Thuan et al. (2004) Thuan, T. X., Hibbard, J. E., & Lévrier, F. 2004, AJ, 128, 617
- Tielens & Hollenbach (1985a) Tielens, A. G. G. M., & Hollenbach, D. 1985, ApJ, 291, 722
- Tielens & Hollenbach (1985b) Tielens, A. G. G. M., & Hollenbach, D. 1985, ApJ, 291, 747
- Tosi et al. (2007) Tosi, M., Aloisi, A., Mack, J., & Maio, M. 2007, IAU Symposium, 235, 65
- Tully (1988) Tully, R. B. 1988, Cambridge and New York, Cambridge University Press, 1988, 221 p.,
- Valtchanov et al. (2011) Valtchanov, I., Virdee, J., Ivison, R. J., et al. 2011, MNRAS, 415, 3473
- Verma et al. (2005) Verma, A., Charmandaris, V., Klaas, U., Lutz, D., & Haas, M. 2005, SSRv, 119, 355
- Wagg et al. (2010) Wagg, J., Carilli, C. L., Wilner, D. J., et al. 2010, A&A, 519, L1
- Wagg et al. (2012) Wagg, J., Wiklind, T., Carilli, C. L., et al. 2012, ApJL, 752, L30
- Wilkins et al. (2008) Wilkins, S. M., Hopkins, A. M., Trentham, N., & Tojeiro, R. 2008, MNRAS, 391, 363
- Wolfire et al. (1995) Wolfire, M. G., Hollenbach, D., McKee, C. F., Tielens, A. G. G. M., & Bakes, E. L. O. 1995, ApJ, 443, 152
- Wright (2006) Wright, E. L. 2006, PASP, 118, 1711
- Wu et al. (2005) Wu, H., Cao, C., Hao, C.-N., et al. 2005, ApJL, 632, L79
- Zhao et al. (2013) Zhao, Y., Lu, N., Xu, C. K., et al. 2013, ApJL, 765, L13
- Zhu et al. (2008) Zhu, Y.-N., Wu, H., Cao, C., & Li, H.-N. 2008, ApJ, 686, 155
Appendix A Comparison between different SFR tracers for the DGS sample
A.1 Limitations of SFR tracers in metal-poor dwarf galaxies
In this work, we rely on the most recent calibrations reported in Kennicutt & Evans (2012), which are calibrated for an initial mass function (IMF) characterized by a broken power law with a slope of -2.35 from 1 to 100 M⊙ and -1.3 between 0.1 and 1 M⊙ (Kroupa & Weidner 2003). Table 4 gives an overview of the reference SFR calibrations used in this work. SFR calibrations based on single tracers in the first part of Table 4 predict the SFR in yr-1 following the prescription SFR = - , where is the SFR indicator in units of erg s-1 and represents the calibration coefficients for a specific SFR diagnostic. The second part of Table 4 provides the calibrations to correct unobscured SFR indicators for extinction.
| SFR calibrations | |||
| [erg s-1] | Age range [Myr] | Refa𝑎aa𝑎aReferences: (1) Hao et al. (2011); (2) Murphy et al. (2011); (3) Rieke et al. (2009); (4) Calzetti et al. (2010) ; (5) Kennicutt et al. (2009). | |
| 0-10-100 | 43.35 | 1,2 | |
| H | 0-3-10 | 41.27 | 1,2 |
| 24 m | 0-5-100 | 42.69 | 3 |
| 70 m | 0-5-100 | 43.23 | 4 |
| 0-5-100 | 43.41 | 1,2 | |
| Composite SFR calibrations | |||
| Composite tracerb𝑏bb𝑏bThe luminosities of composite tracers are in units of erg s-1, except which is in units of erg s-1 Hz-1. | 1 disp [dex] | Refa𝑎aa𝑎aReferences: (1) Hao et al. (2011); (2) Murphy et al. (2011); (3) Rieke et al. (2009); (4) Calzetti et al. (2010) ; (5) Kennicutt et al. (2009). | |
| +c,d𝑐𝑑c,dc,d𝑐𝑑c,dfootnotemark: | 3.89 | 0.13 | 1 |
| + | 7.2 1014 | 0.14 | 1 |
| + | 0.27 | 0.09 | 1 |
| +c𝑐cc𝑐cThe SFR calibration is valid for the emission from MIPS 24 m or IRAS 25 m filters, due to the excellent correspondence that exists between both bands (Kennicutt et al. 2009). | 0.020 | 0.12 | 5 |
The empirically derived SFR calibrations from Table 4 assume a constant star formation rate over time scales comparable to or longer than the lifetime of stars to which the SFR tracers are sensitive. The age range for the SFR tracers used in this analysis are summarized in the second column of Table 4 and were adopted from Kennicutt & Evans (2012), with the first, second and third number representing the lower age boundary, the mean age and the age of stars below which 90 of the emission is contributed, respectively. For observations covering an entire galaxy, we sample a wide range in age across the different star-forming complexes, sufficient to maintain a constant level of star formation activity when averaging out over different galaxy regions. With low-mass galaxies being dominated by one or only few Hii regions and furthermore characterized by bursty star formation histories (e.g. Mateo 1998; Fioc & Rocca-Volmerange 1999), the assumption of constant star formation rate might not be valid due to the insufficient sampling of different ages. The SFR calibrations might, therefore, no longer hold. In particular, on spatially resolved scales (i.e. few hundreds of parsec or the size of a typical Hii region for nearby DGS sources achieved in Herschel observations), the sampling of different ages will not suffice to sample the entire age range to maintain a constant star formation activity (i.e. constant SFR across the entire age range) and the SFR calibrations might break down. Therefore, we caution the interpretation of the SFR in the analysis of metal-poor dwarf galaxies, in particular for the spatially resolved analysis in Section 3, in the sense that the unobscured SFR obtained from GALEX might underestimate the ”true” level of star formation activity all throughout the galaxy.
Other than the constant SFR, empirical SFR calibrations assume the universality of the initial mass function (IMF). Pflamm-Altenburg et al. (2007) question this universality of the IMF on global galaxy scales, especially in dwarf galaxies, arguing that the maximum stellar mass in a star cluster is limited by the total mass of the cluster with the latter being constrained by the SFR. Neglecting this effect could result in an underestimation of the SFR by up to 3 orders of magnitude. Since the data currently at hand do not allow a proper investigation of any possible deviations from an universal IMF, we apply and derive SFR calibrations in this paper under the assumption of universality of the IMF, but keep in mind that possible systematic effects might bias our analysis. The extendibility of SFR calibrations to the early Universe might furthermore be affected by deviations from this universal IMF, with indications for a top heavy IMF at high-redshift (Larson 1998; Baugh et al. 2005; Davé 2008; Lacey et al. 2008; Wilkins et al. 2008).
A.2 Comparison of unobscured SFR tracers: GALEX and H
and H are commonly-used tracers of the unobscured star formation. The applicability of as a star formation rate tracer might, however, be affected by the recent star formation history in dwarfs, which is often bursty and dominated by few, giant Hii regions (e.g. Mateo 1998; Fioc & Rocca-Volmerange 1999). With H being sensitive to the emission of OB stars with mean ages 107 yr and tracing the emission of massive A stars with ages 108 yr (Lequeux 1989), H might be more appropriate as SFR tracer in dwarf galaxies with a particular bursty star formation history.
In Figure 11, we compare the ratio of the SFR as obtained from the SFR calibrators +MIPS 24 m and H+MIPS 24 m (see SFR relations in Table 4) as a function of oxygen abundance. Total H fluxes are taken from Gil de Paz et al. (2003); Moustakas & Kennicutt (2006); Kennicutt et al. (2008); Östlin et al. (2009). We determine the best fit to the data points based on linear regression fits using the IDL procedure MPFITEXY, which is based on the non-linear least-squares fitting package MPFIT (Markwardt 2009). The best fitting line and a perfect one-to-one correlation are indicated as red, dotted and black, dashed lines, respectively. The dispersion around the best fit is indicated in the bottom right corner.
For galaxies with oxygen abundances 12+(O/H) 8.1, the two composite SFR tracers seem to provide consistent estimates of the SFR, while below 12+(O/H) 8.1 galaxies start to deviate from a perfect one-to-one correlation. Due to the lower stellar masses of metal-poor dwarfs, their star formation history is dominated by only few giant Hii regions and, thus, heavily dependent on the time delay since the last burst of star formation. With tracing the unobscured star formation over a time-scale of 10 to 100 Myr (Kennicutt 1998; Calzetti et al. 2005; Salim et al. 2007), the SFR derived from emission will be lower compared to H in galaxies characterized by a single recent burst of star formation ( 10 Myr) over a time scale of 100 Myr. Therefore, H is considered a better SFR calibrator in low-mass dwarfs which are dominated by single Hii regions. The correspondence between SFR estimates from and emission for galaxies with 12+(O/H) 8.1 might indicate an age effect, where the latter objects are rather in a post-starburst phase and the most recent starburst occurred more than 10 Myr ago. The unavailability of H maps (only global H fluxes could be retrieved from the literature for most galaxies) prevents us from using H as reference SFR tracer, since we are unable to recover the H emission that corresponds to the areas in galaxies covered by our Herschel observations. Therefore, is used as reference SFR tracer for this analysis, bearing in mind that the conversion to SFR might break down for low-mass metal-poor dwarfs where will on average underestimate the SFR derived from H by 50 (see Figure 11).
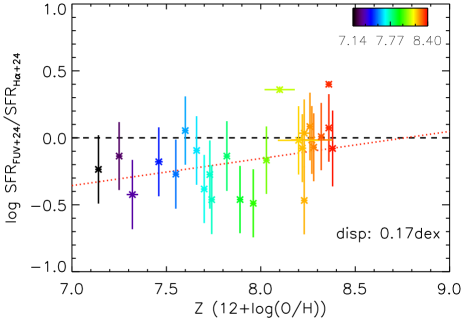
A.3 Comparison of obscured SFR tracers: IRAC8 m, MIPS 24 m, and 1.4 GHz
Different monochromatic and multi-band data in the infrared and radio wavelength domain can be used to trace the obscured star formation component. Here, we compare IRAC 8 m, MIPS 24 m, PACS 70 m, the total-infrared luminosity and radio continuum emission at 1.4 GHz. Total IRAC 8 m flux densities have been adopted from Rémy-Ruyer et al. (in prep.). The DGS sample has been observed by the Herschel PACS (70, 100, 160 m) and SPIRE (250, 350, 500 m) photometers in all continuum bands. Details about the observing strategy, the applied data reduction techniques and aperture photometry results are presented in Rémy-Ruyer et al. (2013). Total infrared luminosities are taken from Madden et al. (2013), as determined from Spitzer bands using the prescriptions in Dale & Helou (2002). Radio continuum measurements are retrieved from the NRAO VLA Sky Survey (NVSS) catalog (Condon et al. 1998), Cannon & Skillman (2004), Thuan et al. (2004) and Hunt et al. (2005).
The emission from polycyclic aromatic hydrocarbons (PAHs) usually dominates the IRAC 8 m band in metal-rich galaxies. In low-metallicity galaxies, the IRAC 8 m band might also contain an important contribution from the warm continuum emission from very small grains. Since the PAH emission has been observed to be under-luminous below 12 + (O/H) 8.1 (Boselli et al. 2004; Engelbracht et al. 2005; Jackson et el. 2006; Madden et al. 2006; Draine et al. 2007; Engelbracht et al. 2008; Galliano et al. 2008), in combination with the uncertainty to quantifying the 8 m band in terms of PAH and VSG contribution, the IRAC 8 m band is considered an unreliable SFR calibrator for the DGS sample covering a wide range in metallicity. Calzetti et al. (2007) could indeed identify that the sensitivity of the IRAC 8 m band to metallicity is about one order of magnitude worse compared to MIPS 24 m. The weak PAH emission towards lower metallicities is not directly related to the lower metal abundance but rather emanates from the generally strong and hard radiation fields in low-metallicity systems destroying and/or ionizing PAHs (e.g. Gordon et al. 2008; Sandstrom et al. 2012). Other than its dependence on metallicity (or thus radiation field), PAH emission tends to be inhibited in regions of strong star formation activity while it can be several times more luminous compared to other star formation rate tracers in regions with relatively weak or nonexistent star formation (e.g. Calzetti et al. 2005; Bendo et al. 2008; Gordon et al. 2008). Prior to any conversion of IRAC 8 m emission to SFR, the band emission needs to be corrected for any stellar contribution. Given that the contribution from the stellar continuum could be substantial in low abundance galaxies, this will make the correction using standard recipes (e.g. Helou et al. 2004) highly uncertain. All together, we argue that the IRAC 8 m is not appropriate as SFR indicator in our sample of dwarf galaxies with widely varying metallicities.
The most common monochromatic tracer of obscured star formation is MIPS 24 m emission, which generally originates from a combination of stochastically-heated very small grains (VSGs) and large grains at an equilibrium temperature of 100 K. For a grain size distribution similar to our Galaxy, we expect large equilibrium grains only to start dominating the MIPS 24 m emission above a threshold of 100 (where is the scaling factor of the interstellar radiation field, expressed relative to the interstellar radiation field from 6 to 13.6 eV for the solar neighborhood in units of Habing flux, i.e. 1.6 10-3 erg s-1 cm-2). The emission in the MIPS 24 m band has been shown to be well-correlated with other star formation rate tracers on both local scales (Calzetti et al. 2007; Leroy et al. 2008) and global scales (e.g. Calzetti et al. 2005, 2007; Wu et al. 2005; Alonso-Herrero et al. 2006; Pérez-González et al. 2006; Zhu et al. 2008; Kennicutt et al. 2009; Rieke et al. 2009; Hao et al. 2011) and directly traces the ongoing star formation over a timescale of 10 Myr (Calzetti et al. 2005; Pérez-González et al. 2006; Calzetti et al. 2007).
Since the grain properties and size distribution has been shown to be sensitive to the metallicity of galaxies (Lisenfeld et al. 2002; Galliano et al. 2003, 2005), we need to verify whether MIPS 24 m is an appropriate SFR tracer for the DGS sample. In low-metallicity objects, small grain sizes ( 3 nm) start to dominate the 24 m emission compared to larger dust grains (Lisenfeld et al. 2002; Galliano et al. 2003, 2005), due to the fragmentation of these larger dust grains through shocks experienced in the turbulent ISM. The hard radiation field in low metallicity galaxies (see Section 4.3) furthermore increases the maximum temperature of stochastically heated grains and shifts the peak of the SED to shorter wavelengths, boosting the MIPS 24 m flux (e.g. Thuan et al. 1999; Houck et al. 2004; Galametz et al. 2009, 2011). To verify the influence of metallicity on the MIPS 24 m band emission, we compare the estimated star formation rates obtained from MIPS 24 m to other SFR indicators which should not be biased (or at least less) by variations in the dust composition across galaxies with different metal abundances.
Towards longer wavelengths (70, 100, 160 m), the band emission is dominated by larger dust grains and should not depend strongly on the abundance of very small grains. For larger dust grains a significant fraction of the dust heating might, however, be attributed to more evolved stellar populations, making the link between far-infrared continuum emission and star formation more dispersed (Bendo et al. 2010; Calzetti et al. 2010; Boquien et al. 2011; Bendo et al. 2012a; Groves et al. 2012; Smith et al. 2012). In a similar way, the total-infrared luminosity might be subject to heating from old stars and, therefore, only linked to star formation on much longer timescales. Some individual studies argue that most of the dust heating is provided by star-forming regions in dwarfs (e.g. Galametz et al. 2010; Bendo et al. 2012a), even at wavelengths long ward of 160 m, suggesting that the longer wavelength data (70, 100, 160 m) could potentially be reliable star formation rate tracers. More detailed analyses of the dominant heating sources for dust in dwarfs might however be required to conclude on the applicability of far-infrared continuum bands to trace the SFR. In Figure 12, we compare the SFR as estimated from the single continuum bands MIPS 24 m and PACS 70 m (see top panel). The best fitting line and dispersion (0.28 dex) in this plot is mainly dominated by three galaxies (SBS 0335-052, Tol 1214-277, Haro 11) which have the peak of their SED at very short wavelengths and, therefore, the 24 m band will overestimate the SFR while the 70 m emission will underestimate the SFR. The other galaxies seem to follow the one-to-one correlation better with a dispersion of 0.18 dex around the one-to-one correlation (or difference between the two SFR estimates up to 51).
In the central panel of Figure 12, we make a similar comparison between the composite SFR tracers +24 m and +TIR. The best fitting line (with slope = 0.44) clearly diverges from the one-to-one correlation with the combination of and MIPS 24 m providing much higher SFR than inferred from +TIR. In particular for galaxies with 12+(O/H) 8.1, the SFR estimates can differ up to one order of magnitude. We argue that this discrepancy is mainly caused by the fact that the SFR relations for the total infrared luminosity were calibrated based on galaxy samples of normal star-forming galaxies with close to solar abundances. They might, therefore, be less appropriate for metal-poor dwarfs, which are typically characterized by steeply rising mid-infrared (MIR) to far-infrared (FIR) slopes and overall SEDs peaking at wavelengths lower than 60 m (e.g. Thuan et al. 1999; Houck et al. 2004; Galametz et al. 2009, 2011).
Radio continuum emission at 1.4 GHz is dominated by non-thermal synchrotron emission associated with the acceleration of electrons in a galaxy’s magnetic field, and, therefore, independent of the grain composition in a galaxy’s ISM. The emission at 1.4 GHz is often used as a tracer of star formation, since the optically thin radio synchrotron emission correlates well with the FIR emission (i.e. the FIR-radio correlation, e.g. de Jong et al. 1985; Helou et al. 1985). However, the 1.4 GHz is not really a tracer of obscured star formation since it probes the energy from supernovae associated with star forming regions and, therefore, rather correlates with the total energy output from star-forming regions, including both obscured and unobscured star formation. Figure 12 (bottom panel) shows the ratio of SFR estimated from +24 m and +1.4 GHz as a function of oxygen abundance (or metallicity), with the black dashed line representing the one-to-one correlation. In general, the SFR obtained from the composite tracer +MIPS 24 m is higher than the SFR estimated from +1.4 GHz. We argue that this deviation can again be attributed to the bursty star formation history in dwarf galaxies. Although the emission at 24 m and 1.4 GHz is sensitive to stars of ages up to at least 100 Myr (see Table 4), the MIPS 24 m band is dominated by the emission of stars younger than 10 Myr. In view of the recent trigger of star formation that characterizes most dwarf galaxies in our sample, the 1.4 GHz emission will typically underestimate the SFR since it was calibrated for models of constant SFR (or supernova rate) over the past 100 Myr. One exception is galaxy HS 0822+3542, for which the SFR seems to be underestimated based on +MIPS 24 m data. The strange behavior of this galaxy in the PACS wavebands (Rémy-Ruyer et al. 2013) supports the peculiarity of this object. Another outlier is Haro 11, which shows the highest ratio based on the composite tracer +24 m. We believe that the warmer dust temperatures with a peak in its SED at very short wavelengths ( 40 m, Galametz et al. 2009) in this Luminous InfraRed Galaxy (LIRG) causes an overestimation of the SFR based on MIPS 24 m.
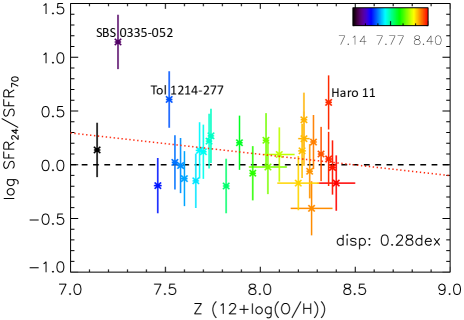
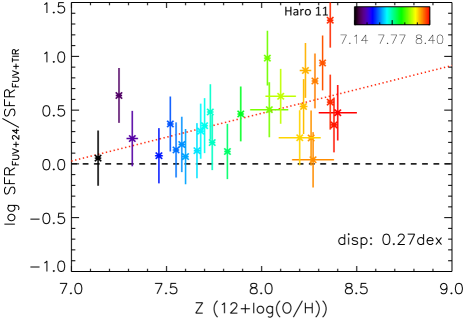
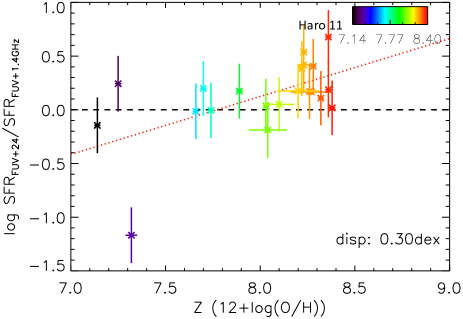
Based on the above comparison between different tracers of obscured star formation, we opted to use the reference SFR tracers and MIPS 24 m for the analysis of the DGS sample. By estimating the SFR from and MIPS 24 m emission, we should be tracing the emission of young stars with ages up to 100 Myr. However, it is possible to get diffuse emission that is not locally heated by star forming regions in both and MIPS 24 m bands originating from heating by the diffuse interstellar radiation field. This could potentially cause an overestimation of the SFR in diffuse regions and might bias the interpretation of the observed relations between the SFR and FIR line emission, in particular for the spatially resolved analysis of Section 3. With the Dwarf Galaxy Survey often not mapping the nearby galaxies completely in the FIR lines but rather focusing on the brightest star forming regions, we argue that the contribution from diffuse regions and the heating by evolved stellar populations most likely will be limited in many cases. Although, we should keep in mind the possible contribution of diffuse and 24 m emission to the SFR estimates upon analyzing the SFR relations. Similarly, the band might contain residual starlight from evolved stellar populations due to the low level of obscuration in some of the dwarfs. However, the presence of only few evolved stars in dwarfs (compared to more massive early-type galaxies with large spheroids) makes it unlikely that residual starlight of old stars will contribute significantly to the emission.
A.4 Comparison ISO-Herschel
Since the literature sample is composed of Herschel and ISO fluxes, we need to verify whether the spectroscopic flux calibration of the Herschel PACS and ISO LWS instruments are compatible. Hereto, we assemble the ISO fluxes from the Brauher et al. (2008) catalog for galaxies in our literature sample with Herschel measurements. We only consider galaxies which are classified as unresolved with respect to the LWS beam in Brauher et al. (2008) to minimize the influence of different beam sizes in our comparison. We gather a sample of 44, 19 and 10 sources with [Cii], [Oi]63 and [Oiii]88 fluxes from both Herschel and ISO observations. Those galaxies are indicated with a cross behind their name in Tables 7, B and B of the Appendix. Figure 13 presents the Herschel-to-ISO line ratios for [Cii] (top), [Oi]63 (middle) and [Oiii]88 (bottom). Based on the 44 measurements for [Cii], we find that the Herschel fluxes are on average 1.190.43 higher compared to the ISO measurements. The best fitting line (see red solid line in Figure 13, top panel) lies close to the one-to-one correlation. Overall, the Herschel and ISO [Cii] fluxes are consistent with each other within the error bars, in particular for the higher luminosity sources. Based on the 19 [Oi]63 and 10 [Oiii]88 measurements, we infer that the Herschel measurements are on average lower by a factor of 0.860.16 and 0.690.18, respectively, compared to the ISO fluxes. For the [Oi]63 line, the Herschel PACS and ISO LWS measurements still agree within the error bars, but for the [Oiii]88 line the discrepancy between Herschel and ISO measurements is considered significant. Although the larger ISO LWS beam ( 80) could collect more flux compared to the PACS beam for the [Oi]63 and [Oiii]88 lines (FWHM 9.5), we would expect to see a similar behavior for the [Cii] line (PACS FWHM 11.5) if the difference in beam size is driving the offset between Herschel and ISO fluxes. The absence of any beam size effects for [Cii] makes us conclude that the discrepancy between Herschel and ISO for [Oiii]88 can likely be attributed to a difference in calibration. Given the significant difference in [Oiii]88 line fluxes, we will only take the [Oiii]88 measurements derived from Herschel observations into account for the SFR calibrations.
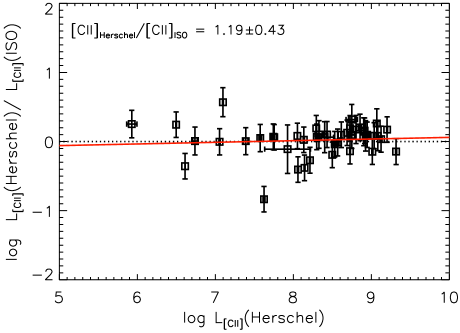
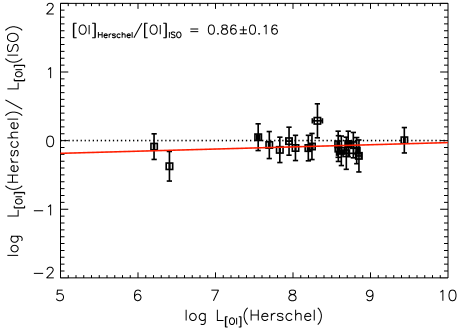
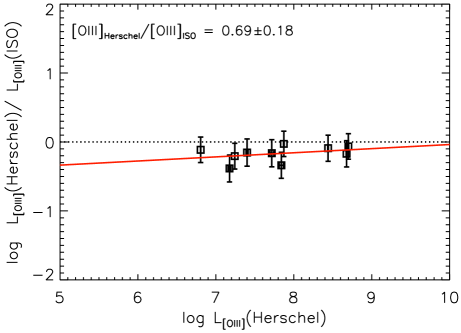
Appendix B Tables
| Source | Da𝑎aa𝑎aDistances and oxygen abundances are adopted from Madden et al. (2013).
|
12+(O/H)a𝑎aa𝑎aDistances and oxygen abundances are adopted from Madden et al. (2013).
|
MIPS 24 mb𝑏bb𝑏bMIPS 24 m flux densities with an asterisk correspond to total galaxy fluxes and were retrieved from Bendo et al. (2012b). | SFR | |
|---|---|---|---|---|---|
| [Mpc] | [mJy] | [mJy] | [M⊙ yr-1] | ||
| I Zw 18* | 18.2 | 7.14 | 1.482 0.220 | 6.1 0.3* | 0.057 0.021 |
| SBS 0335-052* | 56.0 | 7.25 | 0.805 0.119 | 76.8 3.2* | 0.890 0.313 |
| HS 0822+3542 | 11.0 | 7.32 | 0.166 0.025 | 3.2 0.3* | 0.0031 0.0011 |
| UGC 4483 | 3.2 | 7.46 | 1.011 0.150 | 10.1 0.5* | 0.0014 0.0005 |
| [1.762 0.261] | |||||
| Tol 1214-277* | 120.5 | 7.52 | 0.188 0.028 | 6.8 0.3* | 0.543 0.194 |
| SBS 1415+437* | 13.6 | 7.55 | 1.124 0.167 | 16.8 1.7 | 0.030 0.011 |
| SBS 1211+540 | 19.3 | 7.58 | 0.198 0.029 | 3.3 0.3* | 0.011 0.004 |
| HS 1442+4250 | 14.4 | 7.60 | 0.590 0.087 | 6.6 0.3* | 0.016 0.006 |
| [1.145 0.170] | |||||
| VII Zw 403* | 4.5 | 7.66 | 2.485 0.368 | 24.9 2.4 | 0.007 0.002 |
| SBS 1249+493 | 110.8 | 7.68 | 0.088 0.013 | 4.3 0.3* | 0.251 0.089 |
| NGC 2366* | 3.2 | 7.70 | 8.627 1.278 | 483.7 13.3 | 0.022 0.008 |
| UM 461* | 13.2 | 7.73 | 0.483 0.072 | 34.4 3.2* | 0.024 0.009 |
| Mrk 209* | 5.8 | 7.74 | 1.920 0.284 | 40.1 2.3 | 0.010 0.004 |
| UM 133* | 22.7 | 7.82 | 0.560 0.083 | 9.4 0.5* | 0.043 0.016 |
| [0.978 0.145] | |||||
| NGC 4861* | 7.5 | 7.89 | 7.911 1.172 | 262.7 10.0 | 0.085 0.030 |
| NGC 6822-Hubble V* | 0.5 | 7.96 | 7.619 1.129 | 970.6 18.1 | 0.0008 0.0003 |
| NGC 1569*† | 3.1 | 8.02 | 179.284 26.562 | 6709.9 154.4 | 0.348 0.124 |
| Mrk 930* | 77.8 | 8.03 | 1.100 0.163 | 152.4 5.6 | 3.095 1.085 |
| HS 0052+2536* | 191.0 | 8.04 | 0.262 0.039 | 20.7 1.2* | 2.963 1.045 |
| Mrk 1089* | 56.6 | 8.10 | 3.509 0.520 | 391.4 7.6 | 4.436 1.558 |
| NGC 4449* | 4.2 | 8.20 | 73.385 8.379 | 1967.1 19.7 | 0.226 0.080 |
| NGC 625*† | 3.9 | 8.22 | 6.253 0.926 | 717.1 16.6 | 0.038 0.013 |
| II Zw 40*† | 12.1 | 8.23 | 20.374 3.018 | 1361.3 54.4 | 0.831 0.294 |
| Haro 2* | 21.7 | 8.23 | 2.888 0.428 | 663.3 12.8 | 0.954 0.334 |
| NGC 4214* | 2.9 | 8.26 | 34.892 5.169 | 1495.7 29.1 | 0.063 0.023 |
| NGC 1705* | 5.1 | 8.27 | 12.768 1.892 | 43.9 0.9 | 0.038 0.014 |
| Haro 3* | 19.3 | 8.28 | 3.794 0.562 | 714.7 25.3 | 0.840 0.294 |
| UM 448* | 87.8 | 8.32 | 1.890 0.280 | 522.5 18.2 | 11.994 4.193 |
| UM 311* | 23.5 | 8.36 | 1.422 0.211 | 145.2 6.5 | 0.291 0.102 |
| Haro 11*† | 92.1 | 8.36 | 2.398 0.355 | 1854.4 96.3 | 43.010 15.022 |
| NGC 1140* | 20.0 | 8.38 | 5.923 0.877 | 271.0 9.1 | 0.530 0.189 |
| HS 2352+2733 | 116.7 | 8.40 | 0.044 0.007 | 2.6 0.3* | 0.155 0.055 |
| Source | z | Refa𝑎aa𝑎aReferences: (1) Dale et al. (2004); (2) Coppin et al. (2012); (3) Stacey et al. (2010); (4) Hailey-Dunsheath et al. (2010); (5) Sturm et al. (2010); (6) Ferkinhoff et al. (2014); (7) Ivison et al. (2010b); (8) Valtchanov et al. (2011); (9) Ferkinhoff et al. (2010); (10) Cox et al. (2011); (11) Wagg et al. (2010); (12) Swinbank et al. (2012); (13) Maiolino et al. (2009); (14) Iono et al. (2006); (15) Wagg et al. (2012); (16) De Breuck et al. (2011); (17) Marsden et al. (2005); (18) Rawle et al. (2013); (19) Riechers et al. (2013); (20) Maiolino et al. (2005); (21) Ouchi et al. (2013). | [Cii] | [Oi]63 | [Oiii]88 | ||
|---|---|---|---|---|---|---|---|
| [ L⊙] | [ L⊙] | [ L⊙] | [ L⊙] | [ M⊙ yr-1] | |||
| IRAS F16413+3954 | 0.59 | 1 | - | 9.52b𝑏bb𝑏bOnly a 2.7 detection. | - | 13.47 | 3.65 |
| IRAS F042070127 | 0.91 | 1 | - | 10.61 | - | 13.67 | 3.84 |
| LESS J033217.6275230 | 1.10 | 2 | - | 9.87 | - | 11.67 | 1.84 |
| IRAS F10026+4949 | 1.12 | 3 | 10.44 | - | - | 14.02 | 4.20 |
| 3C 368 | 1.13 | 3 | 10.00 | - | - | 13.14 | 3.31 |
| PG 1206+459 | 1.16 | 3 | 9.94 | - | - | 13.74 | 3.92 |
| SMM J224710206 | 1.16 | 3 | 10.28 | - | - | 13.56 | 3.74 |
| 3C 065 | 1.18 | 3 | 9.22 | - | - | 13.09 | 3.26 |
| SMM J123634.51+621241.0 | 1.22 | 3 | 10.20 | - | - | 12.77 | 2.94 |
| LESS J0333294.9273441 | 1.24 | 2 | - | 9.99 | - | 11.76 | 1.94 |
| PG 1241+176 | 1.27 | 3 | 10.60 | - | - | 13.80 | 3.97 |
| LESS J033155.2275345 | 1.27 | 2 | - | 9.69 | - | 11.91 | 2.08 |
| MIPS J142824.0+352619c𝑐cc𝑐cLuminosities have not been corrected for a possible lensing factor, but the galaxy could possibly be lensed up to a factor of 8 (Stacey et al. 2010). | 1.30 | 3, 4, 5 | 9.85 | 9.53 | - | 12.29 | 2.47 |
| LESS J033331.7275406 | 1.32 | 2 | - | 9.71 | - | 12.33 | 2.50 |
| IRAS F16348+7037 | 1.33 | 1 | - | 10.64 | - | 13.86 | 4.04 |
| IRAS F22231-0512 | 1.40 | 1 | - | 10.82 | - | 14.66 | 4.83 |
| 3C 446 | 1.40 | 3 | 11.13 | - | - | 14.66 | 4.83 |
| LESS J033150.84274438 | 1.61 | 2 | - | 10.43 | - | 12.68 | 2.86 |
| LESS J033140.1275631 | 1.62 | 2 | - | 10.27 | - | 12.29 | 2.47 |
| PKS 0215+015 | 1.72 | 3 | 10.70 | - | - | 14.27 | 4.44 |
| H-ATLAS J091043.1-000322d𝑑dd𝑑dTwo calibrations based on and MIPS 24 m have been reported in the literature. Zhu et al. (2008) found a calibration coefficient 6.31 based on a sample of 187 star-forming non-AGN galaxies, while Hao et al. (2011) found a lower scaling factor 3.89, calibrated on a sample of 144 galaxies retained from the spectrophotometric survey by Moustakas & Kennicutt (2006) (97 objects) and the SINGS survey (47 objects, Kennicutt et al. 2003). No clear reason has been found to explain the difference in calibration coefficients derived by Zhu et al. (2008) and Hao et al. (2011). | 1.79 | 6 | 9.33 | 9.40 | - | 12.33 | 2.75 |
| RX J094144.51+385434.8 | 1.82 | 3 | 10.38 | - | - | 13.69 | 3.86 |
| SDSS J100038.01+020822.4 | 1.83 | 3 | 10.06 | - | - | 13.13 | 3.30 |
| SWIRE J104704.97+592332.3 | 1.95 | 3 | 10.31 | - | - | 13.13 | 3.30 |
| SWIRE J104738.32+591010.0 | 1.96 | 3 | 10.09 | - | - | 12.73 | 2.91 |
| SMM J2135-0102e𝑒ee𝑒eWe apply the luminosities corrected for lensing reported by Ivison et al. (2010b). | 2.33 | 7 | 9.75 | 10.18 | 9.91 | 12.37 | 2.55 |
| H-ATLAS ID130f𝑓ff𝑓fLuminosities have been corrected assuming a lensing factor of 6, following the best fit for the lens model reported in Valtchanov et al. (2011). | 2.63 | 8 | - | 10.31 | 10.22 | 12.97 | 3.14 |
| SMM J023990136g𝑔gg𝑔gLuminosities have been corrected assuming a lensing factor of 2.38, following Ivison et al. (2010a). | 2.81 | 9 | - | - | 10.66 | 13.34 | 3.51 |
| H-ATLAS ID81hℎhhℎhLuminosities have been corrected assuming a lensing factor of 25, following the improved lens model presented in Valtchanov et al. (2011). | 3.04 | 8 | 10.11 | - | 9.76 | 12.36 | 2.53 |
| APM 08279+5255i𝑖ii𝑖iLuminosities have been corrected assuming a lensing factor of 90, following the most extreme estimate of the lensing factor ( 4-90) reported in Riechers et al. (2009). | 3.91 | 9 | - | - | 9.07 | 12.59 | 2.77 |
| H-ATLAS ID141j𝑗jj𝑗jLuminosities have been corrected assuming a lensing factor of 20, which is the median of the range in amplification factors reported in Cox et al. (2011) | 4.24 | 10 | 9.49 | - | - | 12.79 | 2.87 |
| BRI 1335-0417 | 4.41 | 11 | 10.22 | - | - | 13.74 | 3.91 |
| ALESS 65.1 | 4.42 | 12 | 9.52 | - | - | 12.32 | 2.49 |
| BRI 0952-0115k𝑘kk𝑘kLuminosities have been corrected assuming a lensing factor of 4.5, following Maiolino et al. (2009). | 4.43 | 13 | 9.66 | - | - | 12.67 | 2.85 |
| ALESS 61.1 | 4.44 | 12 | 9.19 | - | - | 12.34 | 2.51 |
| BR 12020725 N | 4.69 | 14, 15 | 10.00 | - | - | 13.15 | 3.33 |
| BR 12020725 S | 4.69 | 14, 15 | 9.82 | - | - | 13.48 | 3.66 |
| LESS J033229.4 | 4.76 | 16 | 10.01 | - | - | 12.78 | 2.96 |
| CI 1358+62l𝑙ll𝑙lLuminosities have been corrected assuming a lensing factor of 11, following the most extreme lensing predictions of Franx et al. (1997). | 4.93 | 17 | 9.98 | - | - | 12.38 | 2.56 |
| HLSJ091828.6+514223m𝑚mm𝑚mLuminosities have been corrected assuming a lensing factor of 8.9, following Rawle et al. (2013). | 5.24 | 18 | 10.19 | - | - | 13.27 | 3.44 |
| HFLS3 | 6.34 | 19 | 10.19 | - | - | 13.70 | 3.87 |
| SDSS J1148+52511 | 6.42 | 20 | 9.64 | - | - | 13.41 | 3.58 |
| Himiko | 6.60 | 21 | 7.75 | - | - | 10.80 | 2.00n𝑛nn𝑛nThe SFR is not calculated from since Himiko is an optically bright galaxy with low metal and dust content. Therefore, we adapt the SFR estimate ( 100 M⊙ yr-1) obtained from the stellar population synthesis in Ouchi et al. (2013). |
| Source | a𝑎aa𝑎aDistances for galaxies with redshifts are obtained from the Nearby Galaxies Catalog (Tully 1988) (if available), while for other galaxies distances are derived from the redshifts reported on the NASA Extragalactic Database (NED). For Virgo cluster galaxies, we retrieve distances from the Goldmine database (Gavazzi et al. 2003), based on results reported in Gavazzi et al. (1999). For galaxies with redshifts , the luminosity distances are calculated for a spatially flat cosmology with = 67.3 km s-1 Mpc-1, = 0.685 and = 0.315 (Planck Collaboration et al. 2013). | Refb𝑏bb𝑏bReferences: (1) Brauher et al. (2008) | MIPS 24 m/IRAS 25 m | ||
|---|---|---|---|---|---|
| [Mpc] | [mJy] | [mJy] | [ M⊙ yr-1] | ||
| NGC 4713 | 19.9 | 1 | 13.308 1.972 | 186.5 50.4 | -0.13 |
| NGC 4490 | 8.7 | 1 | 10.248 1.518 | 1394.8 55.9 | -0.45 |
| NGC 1156 | 7.1 | 1 | 23.307 3.453 | 447.1 18.0 | -0.74 |
| NGC 4299 | 18.7 | 1 | 8.996 1.333 | 210.4 8.5 | -0.28 |
| NGC 693 | 23.4 | 1 | 0.973 0.144 | 550.0 50.0 | -0.08 |
| NGC 814 | 24.1 | 1 | 0.321 0.048 | 897.2 62.8 | 0.14 |
| NGC 4294 | 17 | 1 | 5.249 0.778 | 192.5 57.8 | -0.52 |
| VCC 1326 | 17 | 1 | 0.290 0.043 | 418.4 54.4 | -0.49 |
| NGC 4522 | 17 | 1 | 2.766 0.410 | 211.2 48.6 | -0.62 |
| NGC 6821 | 25.1 | 1 | 6.920 1.025 | 307.4 46.1 | -0.02 |
| Source | a𝑎aa𝑎aDistances for galaxies with redshifts are obtained from the Nearby Galaxies Catalog (Tully 1988) (if available), while for other galaxies distances are derived from the redshifts reported on the NASA Extragalactic Database (NED). For Virgo cluster galaxies, we retrieve distances from the Goldmine database (Gavazzi et al. 2003), based on results reported in Gavazzi et al. (1999). For galaxies with redshifts , the luminosity distances are calculated for a spatially flat cosmology with = 67.3 km s-1 Mpc-1, = 0.685 and = 0.315 (Planck Collaboration et al. 2013). | Refb𝑏bb𝑏bReferences: (1) Brauher et al. (2008); (2) Parkin et al. (2013); (3) Graciá-Carpio et al. (in prep.); (4) Sargsyan et al. (2012); (5) Díaz-Santos et al. (2013); (6) Farrah et al. (2013). | ||
|---|---|---|---|---|
| [Mpc] | [ L⊙] | [ M⊙ yr-1] | ||
| NGC 5713 | 33.9 | 1 | 10.91 | 1.09 |
| NGC 7714 | 41.1 | 1 | 10.75 | 0.92 |
| Cartwheel | 137.5 | 1 | 10.73 | 0.91 |
| NGC 0986 | 25.9 | 1 | 10.76 | 0.94 |
| NGC 1317 | 18.8 | 1 | 9.69 | -0.14 |
| NGC 4041 | 25.3 | 1 | 10.49 | 0.67 |
| NGC 4189 | 18.7 | 1 | 9.64 | -0.18 |
| NGC 278 | 13.2 | 1 | 10.15 | 0.33 |
| NGC 1022 | 21.7 | 1 | 10.40 | 0.57 |
| NGC 1155 | 69.8 | 1 | 10.69 | 0.86 |
| NGC 1222 | 34.5 | 1 | 10.66 | 0.83 |
| IC 1953 | 24.6 | 1 | 10.13 | 0.31 |
| NGC 1385 | 19.5 | 1 | 10.37 | 0.54 |
| UGC 02855 | 22.6 | 1 | 10.88 | 1.05 |
| NGC 1482 | 21.8 | 1 | 10.68 | 0.85 |
| NGC 1546 | 14.9 | 1 | 9.82 | -0.002 |
| ESO 317G023 | 43.3 | 1 | 10.85 | 1.03 |
| NGC 3583 | 37.9 | 1 | 10.60 | 0.77 |
| NGC 3683 | 31.6 | 1 | 10.69 | 0.86 |
| NGC 3885 | 31.0 | 1 | 10.51 | 0.69 |
| NGC 3949 | 18.9 | 1 | 10.16 | 0.34 |
| NGC 4027 | 28.5 | 1 | 10.51 | 0.69 |
| NGC 4041 | 25.3 | 1 | 10.49 | 0.67 |
| VCC 873 | 17 | 1 | 9.82 | -0.002 |
| NGC 4519 | 17 | 1 | 9.60 | -0.23 |
| VCC 1972 | 17 | 1 | 9.80 | -0.03 |
| VCC 1987 | 17 | 1 | 10.15 | 0.33 |
| NGC 4691 | 25.1 | 1 | 10.46 | 0.63 |
| IC 3908 | 19.3 | 1 | 10.00 | 0.18 |
| NGC 4818 | 24.0 | 1 | 10.54 | 0.72 |
| NGC 5430 | 44.3 | 1 | 10.84 | 1.01 |
| NGC 5433 | 65.4 | 1 | 10.94 | 1.11 |
| NGC 5937 | 42.0 | 1 | 10.77 | 0.95 |
| NGC 5962 | 35.4 | 1 | 10.63 | 0.80 |
| NGC 7218 | 24.5 | 1 | 10.00 | 0.18 |
| NGC 7418 | 19.8 | 1 | 9.97 | 0.14 |
| III Zw 107 | 86.4 | 1 | 10.57 | 0.74 |
| M 51c𝑐cc𝑐cThe FIR line measurements correspond to the central 80 region in M 51. | 9.9 | 2 | 9.89 | 0.07 |
| NGC 253 | 3.3 | 3 | 10.61 | 0.79 |
| NGC 1808 | 12.0 | 3 | 10.73 | 0.91 |
| NGC 3256† | 41.7 | 3 | 11.82 | 1.99 |
| NGC 4945 | 5.8 | 3 | 10.92 | 1.09 |
| NGC 7552† | 21.7 | 3 | 11.10 | 1.28 |
| Arp 299† | 47.2 | 3 | 11.94 | 2.11 |
| IRAS F172080014*† | 197.0 | 3 | 12.68 | 2.85 |
| IRAS F205514250*† | 197.5 | 3 | 12.24 | 2.41 |
| IRAS F231285919*† | 205.3 | 3 | 12.21 | 2.38 |
| IRAS F105652448† | 198.2 | 3 | 12.28 | 2.45 |
| IRAS F192970406*† | 405.4 | 3 | 12.61 | 2.79 |
| IRAS F090223615* | 277.6 | 3 | 12.47 | 2.65 |
| M83 center | 5.2 | 3 | 10.06 | 0.23 |
| NGC 4038 | 28.3 | 3 | 10.56 | 0.74 |
| IRAS 15206+3342*†d𝑑dd𝑑dLuminosities have been corrected assuming a lensing factor of 18, following Ferkinhoff et al. (2014). | 610.0 | 3 | 12.30 | 2.47 |
| IRAS F224911808* | 366.2 | 3 | 12.42 | 2.59 |
| M83 bar | 5.2 | 3 | 9.33 | -0.50 |
| M83 arm | 5.2 | 3 | 8.72 | -1.11 |
| NGC 4039 | 28.3 | 3 | 10.77 | 0.95 |
| NGC 4038/4039 Overlap | 28.3 | 3 | 10.71 | 0.89 |
| MCG0201051 | 123.2 | 4 | 11.50 | 1.68 |
| ESO244G012 | 103.8 | 4 | 11.47 | 1.65 |
| UGC01385 | 84.9 | 4 | 11.11 | 1.29 |
| CGCG052037 | 111.2 | 4 | 11.43 | 1.61 |
| ESO286G035 | 78.5 | 4 | 11.15 | 1.33 |
| MCG0160022 | 105.2 | 4 | 11.23 | 1.41 |
| CGCG381051 | 139.9 | 4 | 11.24 | 1.42 |
| NGC 6907 | 48.1 | 5 | 10.55 | 0.73 |
| ESO286G035 | 79.0 | 5 | 10.96 | 1.14 |
| ESO343IG013S | 86.8 | 5 | 10.59 | 0.77 |
| IRAS 211015810 | 182.6 | 5 | 11.67 | 1.85 |
| CGCG453062 | 115.3 | 5 | 11.32 | 1.50 |
| Arp84N | 52.6 | 5 | 10.86 | 1.04 |
| VV705 | 186.9 | 5 | 11.84 | 2.02 |
| MCG1202001† | 71.2 | 5 | 11.34 | 1.52 |
| UGC12150 | 97.8 | 5 | 11.37 | 1.55 |
| NGC 5331S | 153.5 | 5 | 11.51 | 1.69 |
| NGC 5331N | 153.5 | 5 | 10.73 | 0.91 |
| UGC08387† | 107.0 | 5 | 11.80 | 1.98 |
| ESO320G030 | 48.5 | 5 | 11.34 | 1.52 |
| Arp240W | 103.8 | 5 | 10.62 | 0.80 |
| Arp240E | 103.8 | 5 | 10.86 | 1.04 |
| ESO440IG058S | 106.5 | 5 | 11.24 | 1.42 |
| ESO264G057 | 78.1 | 5 | 10.86 | 1.04 |
| CGCG043099 | 175.1 | 5 | 11.64 | 1.82 |
| NGC 1614† | 72.6 | 5 | 11.50 | 1.68 |
| MCG0233098W | 72.1 | 5 | 10.79 | 0.97 |
| MCG0233098E | 72.1 | 5 | 10.30 | 0.48 |
| NGC 5104 | 84.9 | 5 | 11.21 | 1.39 |
| ESO267G030W | 84.5 | 5 | 10.96 | 1.14 |
| ESO267G030E | 84.5 | 5 | 10.90 | 1.08 |
| ESO173G015† | 44.0 | 5 | 11.42 | 1.60 |
| NGC 6621 | 94.6 | 5 | 11.24 | 1.42 |
| NGC 6090 | 138.1 | 5 | 11.44 | 1.62 |
| CGCG049057† | 58.9 | 5 | 11.20 | 1.38 |
| IRAS 130525711 | 97.3 | 5 | 11.17 | 1.35 |
| ESO255IG007E | 181.7 | 5 | 10.74 | 0.92 |
| ESO255IG007W | 181.7 | 5 | 11.75 | 1.93 |
| ESO255IG007S | 181.7 | 5 | 10.75 | 0.93 |
| IRAS F051871017 | 130.6 | 5 | 11.40 | 1.58 |
| IRAS F032174022 | 107.5 | 5 | 11.42 | 1.60 |
| ESO069IG006 * | 219.6 | 5 | 12.05 | 2.23 |
| NGC 2342 | 80.4 | 5 | 10.89 | 1.07 |
| NGC 2388 | 62.6 | 5 | 11.23 | 1.41 |
| IC4734 | 70.8 | 5 | 11.33 | 1.51 |
| UGC11041 | 74.0 | 5 | 10.82 | 1.00 |
| IRAS 180900130 | 133.4 | 5 | 10.98 | 1.16 |
| IRAS 180900130 | 133.4 | 5 | 11.47 | 1.65 |
| VIIZw031* | 249.8 | 5 | 12.03 | 2.21 |
| NGC6286N | 83.6 | 5 | 10.51 | 0.69 |
| NGC6286S | 83.6 | 5 | 11.01 | 1.19 |
| CGCG142034E | 85.4 | 5 | 10.84 | 1.02 |
| UGC04881W | 185.0 | 5 | 10.86 | 1.04 |
| UGC03410W | 59.4 | 5 | 9.84 | 0.02 |
| UGC03410E | 59.4 | 5 | 10.51 | 0.69 |
| ESO557G002 | 97.3 | 5 | 10.40 | 0.58 |
| ESO557G002 | 97.3 | 5 | 11.16 | 1.34 |
| ESO432IG006 | 73.5 | 5 | 10.70 | 0.92 |
| UGC03608 | 97.8 | 5 | 11.20 | 1.38 |
| IRAS F182933413 | 82.7 | 5 | 11.85 | 2.03 |
| VV414W | 115.3 | 5 | 10.93 | 1.11 |
| NGC 3110 | 76.7 | 5 | 10.95 | 1.13 |
| Arp303S | 91.4 | 5 | 10.51 | 0.69 |
| Arp303N | 91.4 | 5 | 10.39 | 0.57 |
| ESO593IG008 | 231.1 | 5 | 11.87 | 2.05 |
| ESO467G027 | 79.4 | 5 | 10.47 | 0.65 |
| CGCG247020 | 119.5 | 5 | 11.35 | 1.53 |
| ESO077IG014W | 195.4 | 5 | 11.11 | 1.29 |
| IC5179 | 51.7 | 5 | 10.77 | 0.95 |
| MCG0448002 | 63.0 | 5 | 10.88 | 1.06 |
| IRAS 203512521 | 156.7 | 5 | 11.45 | 1.63 |
| VV250aW | 144.1 | 5 | 10.87 | 1.05 |
| VV250aE | 144.1 | 5 | 11.70 | 1.88 |
| UGC08739 | 76.2 | 5 | 10.52 | 0.70 |
| NGC 4194† | 43.6 | 5 | 10.94 | 1.12 |
| NGC 7592E | 112.1 | 5 | 11.10 | 1.28 |
| NGC 6670W | 132.0 | 5 | 11.21 | 1.39 |
| NGC 6670E | 132.0 | 5 | 11.27 | 1.45 |
| NGC 3221 | 62.1 | 5 | 9.93 | 0.11 |
| MCG0723019 | 160.5 | 5 | 11.64 | 1.82 |
| Arp256 | 125.5 | 5 | 11.44 | 1.62 |
| VV340aS | 156.7 | 5 | 10.59 | 0.77 |
| VV340aN | 156.7 | 5 | 11.37 | 1.55 |
| NGC 0023 | 68.9 | 5 | 10.93 | 1.11 |
| NGC 6701 | 59.8 | 5 | 10.65 | 0.83 |
| MCG0304014 | 155.8 | 5 | 11.63 | 1.81 |
| NGC 7679 | 78.1 | 5 | 10.88 | 1.06 |
| UGC01385 | 85.4 | 5 | 11.03 | 1.21 |
| NGC 6052† | 71.7 | 5 | 10.52 | 0.70 |
| ESO244G012 | 96.4 | 5 | 11.40 | 1.58 |
| ESO507G070 | 99.2 | 5 | 11.59 | 1.77 |
| IC4280 | 74.0 | 5 | 10.65 | 0.83 |
| Arp86S | 77.6 | 5 | 10.50 | 0.68 |
| NGC0232W | 101.5 | 5 | 11.47 | 1.65 |
| NGC7771N | 64.8 | 5 | 11.29 | 1.47 |
| Mrk 331† | 84.5 | 5 | 11.56 | 1.74 |
| NGC 5936 | 60.3 | 5 | 10.79 | 0.97 |
| NGC 5653 | 53.9 | 5 | 10.59 | 0.77 |
| ESO099G004 | 135.3 | 5 | 11.67 | 1.85 |
| ESO221IG010 | 46.7 | 5 | 10.66 | 0.84 |
| NGC 695† | 150.7 | 6 | 11.49 | 1.67 |
| MCG0506036S | 156.7 | 5 | 11.50 | 1.67 |
| UGC02369 | 147.9 | 5 | 11.66 | 1.84 |
| UGC02238† | 100.1 | 5 | 11.26 | 1.44 |
| ESO353G020 | 72.6 | 5 | 11.08 | 1.26 |
| NGC 828 | 81.7 | 5 | 11.19 | 1.37 |
| IRAS F161640746 | 125.0 | 5 | 11.68 | 1.86 |
| NGC0838E | 58.0 | 5 | 10.92 | 1.10 |
| NGC0838S | 58.0 | 5 | 11.04 | 1.22 |
| UGC01845 | 70.8 | 5 | 11.10 | 1.28 |
| IC0214 | 139.9 | 5 | 11.16 | 1.34 |
| NGC 992 | 62.6 | 5 | 10.77 | 0.95 |
| CGCG465012N | 101.9 | 5 | 10.43 | 0.61 |
| CGCG465012S | 101.9 | 5 | 11.06 | 1.24 |
| MCG0512006 | 85.4 | 5 | 11.06 | 1.24 |
| CGCG052037 | 112.5 | 5 | 11.32 | 1.50 |
| IRAS F165160948 | 103.3 | 5 | 10.96 | 1.14 |
| UGC02982 | 80.8 | 5 | 10.95 | 1.13 |
| IC4687 | 79.0 | 5 | 11.21 | 1.39 |
| IRAS 175780400N | 63.5 | 5 | 11.45 | 1.63 |
| ESO138G027 | 95.0 | 5 | 11.26 | 1.44 |
| IRAS 050832441S | 105.6 | 5 | 11.16 | 1.34 |
| IRAS 042713849 | 85.9 | 5 | 11.04 | 1.22 |
| NGC 1797 | 67.1 | 5 | 11.01 | 1.19 |
| IRAS F171381017 | 79.0 | 5 | 11.35 | 1.53 |
| CGCG468002E | 83.1 | 5 | 11.17 | 1.35 |
| IRAS 054421732 | 84.9 | 5 | 11.21 | 1.39 |
| MCG0811002 | 87.2 | 5 | 11.47 | 1.65 |
| IRAS 051295128 | 126.4 | 5 | 11.33 | 1.51 |
| UGC03351 | 67.6 | 5 | 11.22 | 1.40 |
| NGC 2146† | 19.2 | 5 | 10.83 | 1.01 |
| NGC 317B | 82.7 | 5 | 11.32 | 1.50 |
| AM0702601S | 145.1 | 5 | 11.37 | 1.55 |
| RR032N | 79.0 | 5 | 10.71 | 0.89 |
| RR032S | 79.0 | 5 | 10.73 | 0.91 |
| IRAS F112311456 | 158.1 | 5 | 11.55 | 1.73 |
| IRAS 010032238* | 571.0 | 6 | 12.32 | 2.50 |
| IRAS 201004156*† | 633.9 | 6 | 12.67 | 2.85 |
| IRAS 003971312* | 1378.7 | 6 | 12.90 | 3.08 |
| IRAS 060357102* | 372.5 | 6 | 12.22 | 2.40 |
| IRAS 204141651* | 412.5 | 6 | 12.22 | 2.40 |
| IRAS 232535415* | 633.9 | 6 | 12.36 | 2.54 |
| Source | a𝑎aa𝑎aDistances for galaxies with redshifts are obtained from the Nearby Galaxies Catalog (Tully 1988) (if available), while for other galaxies distances are derived from the redshifts reported on the NASA Extragalactic Database (NED). For Virgo cluster galaxies, we retrieve distances from the Goldmine database (Gavazzi et al. 2003), based on results reported in Gavazzi et al. (1999). For galaxies with redshifts , the luminosity distances are calculated for a spatially flat cosmology with = 67.3 km s-1 Mpc-1, = 0.685 and = 0.315 (Planck Collaboration et al. 2013). | Refb𝑏bb𝑏bReferences: (1) Brauher et al. (2008); (2) Graciá-Carpio et al. (in prep.); (3) Sargsyan et al. (2012); (4) Díaz-Santos et al. (2013); (5) Farrah et al. (2013). | ||
|---|---|---|---|---|
| [Mpc] | [ L⊙] | [ M⊙ yr-1] | ||
| NGC 0660 | 13.2 | 1 | 10.53 | 0.70 |
| NGC 1266 | 32.8 | 1 | 10.55 | 0.73 |
| NGC 4278 | 10.8 | 1 | 8.59 | -1.24 |
| NGC 4293 | 18.9 | 1 | 9.74 | -0.09 |
| NGC 4651 | 18.7 | 1 | 9.87 | 0.04 |
| NGC 4698 | 18.7 | 1 | 9.00 | -0.83 |
| NGC 6221 | 21.6 | 1 | 10.80 | 0.98 |
| NGC 6810 | 28.2 | 1 | 10.70 | 0.88 |
| NGC 7217 | 17.8 | 1 | 9.83 | 0.003 |
| NGC 449 | 71.9 | 1 | 10.74 | 0.91 |
| Mrk 573 | 77.5 | 1 | 10.58 | 0.76 |
| NGC 1052 | 22.5 | 1 | 9.30 | -0.52 |
| NGC 1326 | 18.8 | 1 | 9.95 | 0.12 |
| IC 356 | 18.1 | 1 | 9.85 | 0.02 |
| IC 450 | 85.0 | 1 | 10.66 | 0.83 |
| NGC 3705 | 18.9 | 1 | 9.75 | -0.07 |
| NGC 4102 | 18.9 | 1 | 10.71 | 0.88 |
| NGC 4314 | 17 | 1 | 9.53 | -0.30 |
| VCC 857 | 17 | 1 | 9.17 | -0.65 |
| NGC 4414 | 17 | 1 | 10.45 | 0.62 |
| VCC 1003 | 17 | 1 | 9.31 | -0.52 |
| VCC 1043 | 17 | 1 | 9.60 | -0.23 |
| VCC 1110 | 17 | 1 | 9.32 | -0.51 |
| NGC 4486 | 17 | 1 | 9.00 | -0.82 |
| VCC 1727 | 17 | 1 | 9.78 | -0.05 |
| NGC 5643 | 18.8 | 1 | 10.38 | 0.56 |
| I Zw 92 | 173.2 | 1 | 11.20 | 1.37 |
| NGC 5866 | 17.1 | 1 | 9.79 | -0.04 |
| NGC 5953 | 36.8 | 1 | 10.64 | 0.82 |
| NGC 6217 | 26.6 | 1 | 10.39 | 0.57 |
| NGC 6574 | 39.0 | 1 | 10.84 | 1.01 |
| NGC 6764 | 41.2 | 1 | 10.57 | 0.75 |
| Mrk 509 | 157.2 | 1 | 11.25 | 1.42 |
| NGC 6958 | 39.5 | 1 | 9.82 | -0.003 |
| IC 5063 | 51.0 | 1 | 10.88 | 1.06 |
| IC 1459 | 22.3 | 1 | 9.12 | -0.71 |
| NGC 1365 | 18.8 | 2 | 11.09 | 1.26 |
| NGC 3783 | 42.9 | 2 | 10.27 | 0.45 |
| NGC 4051 | 18.9 | 2 | 9.63 | -0.19 |
| NGC 4151† | 22.6 | 2 | 9.95 | 0.12 |
| NGC 4593 | 44.0 | 2 | 10.34 | 0.50 |
| NGC 5033 | 20.8 | 2 | 10.44 | 0.61 |
| NGC 5506 | 32.0 | 2 | 10.44 | 0.61 |
| NGC 7469† | 74.2 | 2 | 11.70 | 1.88 |
| IC 4329A† | 72.0 | 2 | 10.59 | 0.76 |
| Cen A | 5.5 | 2 | 9.98 | 0.16 |
| Circinus | 4.7 | 2 | 10.39 | 0.57 |
| NGC 1068† | 16.0 | 2 | 11.26 | 1.43 |
| NGC 1275† | 79.0 | 2 | 11.19 | 1.37 |
| NGC 1386 | 18.8 | 2 | 9.89 | 0.07 |
| NGC 7314† | 20.4 | 2 | 9.61 | -0.21 |
| NGC 7582† | 19.6 | 2 | 10.82 | 1.00 |
| Mrk 3† | 60.8 | 2 | 10.60 | 0.77 |
| IRAS F183255926 | 90.0 | 2 | 10.89 | 1.06 |
| UGC5101* | 180.8 | 2 | 12.17 | 2.35 |
| Mrk 231*† | 193.9 | 2 | 12.62 | 2.79 |
| Mrk 273*† | 173.0 | 2 | 12.36 | 2.53 |
| NGC 6240*† | 112.3 | 2 | 12.01 | 2.19 |
| IRAS F233653604*† | 301.1 | 2 | 12.37 | 2.55 |
| IRAS F152503609* | 257.0 | 2 | 12.19 | 2.37 |
| IRAS F121120305* | 342.7 | 2 | 12.48 | 2.65 |
| IRAS F131205453* | 141.6 | 2 | 12.47 | 2.64 |
| IRAS F143481447* | 390.3 | 2 | 12.60 | 2.77 |
| IRAS F051892524*† | 196.6 | 2 | 12.25 | 2.43 |
| IRAS F085723915* | 270.7 | 2 | 12.34 | 2.52 |
| NGC 3079 | 22.73 | 2 | 10.95 | 1.13 |
| M82 center | 5.8 | 2 | 11.28 | 1.45 |
| IRAS F072510248*c𝑐cc𝑐cIRAS F072510248 did not have an optical source classification in Graciá-Carpio et al. (in prep.). By relying on the equivalent width of the 6.2 m PAH feature (EW (PAH 6.2 m) = 0.29, Stierwalt et al. 2013), we classify the source as an AGN. | 277.6 | 2 | 12.47 | 2.65 |
| IRAS F195421110*d𝑑dd𝑑dIRAS 15206+3342 was observed during the Herschel performance verification phase. | 292.0 | 2 | 12.21 | 2.39 |
| NGC 4418† | 31.9 | 2 | 11.26 | 1.43 |
| Arp 220*† | 81.4 | 2 | 12.46 | 2.64 |
| IRAS F143783651* | 318.9 | 2 | 12.33 | 2.51 |
| Mrk 334 | 99.2 | 3 | 11.16 | 1.34 |
| IRAS001997426* | 459.9 | 3 | 12.37 | 2.55 |
| E12G21 | 150.7 | 3 | 11.10 | 1.25 |
| IRAS F004562904SW* | 531.1 | 3 | 12.26 | 2.44 |
| MCG0304014 | 160.0 | 3 | 11.67 | 1.85 |
| NGC 454 | 54.8 | 3 | 10.31 | 0.49 |
| ESO353G020 | 71.7 | 3 | 11.13 | 1.31 |
| IRAS F013641042 | 222.5 | 3 | 11.85 | 2.03 |
| NGC 788 | 61.2 | 3 | 10.21 | 0.39 |
| Mrk 590 | 111.6 | 3 | 10.74 | 0.92 |
| UGC01845 | 70.3 | 3 | 11.17 | 1.35 |
| IC1816 | 76.2 | 3 | 10.56 | 0.74 |
| NGC 973 | 73.1 | 3 | 10.51 | 0.69 |
| IRAS F024372122 | 105.6 | 3 | 11.22 | 1.40 |
| UGC02369 | 142.3 | 3 | 11.67 | 1.85 |
| Mrk 1066 | 53.9 | 3 | 10.97 | 1.15 |
| IRAS F032174022 | 106.1 | 3 | 11.37 | 1.55 |
| Mrk 609 | 157.7 | 3 | 11.44 | 1.62 |
| IRAS F033591523 | 161.9 | 3 | 11.62 | 1.80 |
| IRAS F034500055 | 141.3 | 3 | 11.09 | 1.27 |
| IRAS 041032838* | 568.4 | 3 | 12.25 | 2.43 |
| IRAS 041145117* | 607.5 | 3 | 12.29 | 2.47 |
| ESO420G013 | 53.5 | 3 | 11.15 | 1.33 |
| 3C120 | 150.7 | 3 | 11.23 | 1.41 |
| ESO203IG001 | 245.0 | 3 | 11.90 | 2.08 |
| MCG0512006 | 84.9 | 3 | 11.24 | 1.42 |
| Ark120 | 149.3 | 3 | 11.07 | 1.25 |
| IRAS F051871017 | 128.8 | 3 | 11.33 | 1.50 |
| 2MASXJ055802063820043 | 154.9 | 3 | 11.23 | 1.41 |
| IRAS F060762139 | 171.3 | 3 | 11.68 | 1.86 |
| IRAS 063017934* | 775.2 | 3 | 12.41 | 2.59 |
| IRAS 063616217* | 792.6 | 3 | 12.46 | 2.63 |
| NGC 2273 | 31.6 | 3 | 10.35 | 0.53 |
| UGC03608 | 96.9 | 3 | 11.24 | 1.42 |
| IRAS F065926313 | 104.2 | 3 | 11.24 | 1.42 |
| Mrk 9 | 183.1 | 3 | 11.20 | 1.37 |
| IRAS 075986508* | 734.1 | 3 | 12.56 | 2.74 |
| Mrk 622 | 105.2 | 3 | 10.77 | 0.95 |
| ESO60IG016 | 209.6 | 3 | 11.77 | 1.95 |
| Mrk 18 | 49.9 | 3 | 10.22 | 0.40 |
| MCG0124012 | 88.6 | 3 | 10.43 | 0.61 |
| Mrk 705 | 132.9 | 3 | 10.75 | 0.93 |
| IRAS F100383338 | 156.3 | 3 | 11.74 | 1.92 |
| NGC 3393 | 56.2 | 3 | 10.47 | 0.65 |
| ESO319G022 | 74.0 | 3 | 11.07 | 1.25 |
| IRAS120181941* | 841.8 | 3 | 12.55 | 2.73 |
| UGC07064 | 113.5 | 3 | 11.09 | 1.27 |
| NGC 4507 | 53.0 | 3 | 10.74 | 0.92 |
| PG1244026 | 222.5 | 3 | 11.05 | 1.23 |
| ESO507G070 | 98.3 | 3 | 11.51 | 1.69 |
| NGC 4941 | 7.1 | 3 | 8.87 | -0.95 |
| ESO323G077 | 70.3 | 3 | 11.03 | 1.21 |
| MCG0334064 | 74.4 | 3 | 11.19 | 1.37 |
| IRAS F132793401 | 107.9 | 3 | 10.53 | 0.71 |
| M63015 | 34.5 | 3 | 10.04 | 0.22 |
| IRAS 133423932* | 900.9 | 3 | 12.49 | 2.67 |
| IRAS F133492438* | 517.1 | 3 | 12.35 | 2.53 |
| NGC 5347 | 40.9 | 3 | 10.26 | 0.44 |
| OQ208 | 360.6 | 3 | 11.72 | 1.90 |
| NGC 5548 | 77.6 | 3 | 10.68 | 0.86 |
| Mrk 1490 | 116.7 | 3 | 11.37 | 1.55 |
| PG1426015 | 410.0 | 3 | 11.55 | 1.73 |
| PG1440356 | 367.6 | 3 | 11.57 | 1.75 |
| NGC 5728 | 47.0 | 3 | 10.77 | 0.95 |
| NGC 5793 | 52.1 | 3 | 10.72 | 0.90 |
| IRAS 150011433* | 809.5 | 3 | 12.52 | 2.70 |
| IRAS 152252350* | 681.6 | 3 | 12.21 | 2.39 |
| Mrk 876* | 628.6 | 3 | 12.01 | 2.19 |
| IRAS F161640746 | 106.5 | 3 | 11.62 | 1.80 |
| Mrk 883 | 173.2 | 3 | 11.01 | 1.19 |
| IRAS 163344630* | 965.2 | 3 | 12.49 | 2.67 |
| ESO069IG006 | 213.9 | 3 | 11.98 | 2.16 |
| IRAS F163990937N | 122.7 | 3 | 11.55 | 1.73 |
| IRAS 170446720* | 660.3 | 3 | 12.21 | 2.39 |
| IRAS 170684027* | 899.3 | 3 | 12.44 | 2.62 |
| IRAS F171325313 | 235.4 | 3 | 11.94 | 2.12 |
| ESO138G027 | 94.1 | 3 | 11.41 | 1.59 |
| CGCG141034 | 85.9 | 3 | 11.18 | 1.36 |
| IC4734 | 70.3 | 3 | 11.35 | 1.53 |
| IRAS184437433* | 658.7 | 3 | 12.37 | 2.55 |
| ESO140G043 | 63.9 | 3 | 10.65 | 0.83 |
| H1846786 | 348.3 | 3 | 11.46 | 1.64 |
| ESO593IG008 | 224.9 | 3 | 11.94 | 2.12 |
| ESO141G055 | 169.9 | 3 | 11.11 | 1.29 |
| ESO339G011 | 86.8 | 3 | 11.18 | 1.36 |
| IRAS 200371547* | 971.4 | 3 | 12.66 | 2.84 |
| NGC 6860 | 67.1 | 3 | 10.44 | 0.62 |
| NGC 7213 | 24.5 | 3 | 10.10 | 0.28 |
| ESO602G025 | 113.5 | 3 | 11.39 | 1.57 |
| UGC12138 | 113.5 | 3 | 10.82 | 1.00 |
| UGC12150 | 96.9 | 3 | 11.38 | 1.56 |
| ESO239IG002 | 197.7 | 3 | 11.85 | 2.03 |
| Zw453.062 | 113.9 | 3 | 11.41 | 1.59 |
| NGC 7603 | 134.3 | 3 | 10.90 | 1.08 |
| ESO339G011 | 87.7 | 4 | 11.00 | 1.18 |
| NGC6926 | 89.5 | 4 | 10.34 | 0.52 |
| ESO343IG013N | 86.8 | 4 | 10.86 | 1.04 |
| CGCG448020E | 168.5 | 4 | 11.78 | 1.96 |
| CGCG448020c | 168.5 | 4 | 10.66 | 0.84 |
| IC1623B | 91.8 | 4 | 11.47 | 1.65 |
| IC2810b | 158.1 | 4 | 11.27 | 1.45 |
| NGC4922 | 108.4 | 4 | 11.28 | 1.46 |
| CGCG0110767 | 114.4 | 4 | 11.26 | 1.44 |
| IRAS234365257 | 158.6 | 4 | 11.54 | 1.72 |
| ESO264G036 | 96.0 | 4 | 10.97 | 1.15 |
| NGC5135 | 62.1 | 4 | 11.33 | 1.51 |
| MCG0334064 | 75.3 | 4 | 10.85 | 1.03 |
| IRAS083554944 | 119.0 | 4 | 11.39 | 1.57 |
| ESO203IG001 | 252.2 | 4 | 11.91 | 2.09 |
| IRAS121165615 | 125.0 | 4 | 11.63 | 1.81 |
| IRASF060762139 | 175.1 | 4 | 11.67 | 1.85 |
| NGC2342b | 80.4 | 4 | 11.02 | 1.20 |
| NGC2388b | 62.6 | 4 | 9.93 | 0.11 |
| NGC2623 | 84.5 | 4 | 11.71 | 1.89 |
| CGCG142034W | 85.4 | 4 | 10.44 | 0.62 |
| UGC04881E | 185.0 | 4 | 11.58 | 1.76 |
| MCG0220003N | 74.0 | 4 | 11.07 | 1.25 |
| NGC1961 | 59.4 | 4 | 9.66 | -0.16 |
| ESO432IG006E | 73.5 | 4 | 10.75 | 0.93 |
| NGC2369 | 49.0 | 4 | 11.11 | 1.29 |
| IRASF065926313 | 105.2 | 4 | 11.34 | 1.52 |
| IRASF171325313 | 242.1 | 4 | 11.75 | 1.93 |
| VV414E | 115.3 | 4 | 11.01 | 1.19 |
| ESO60IG016 | 218.7 | 4 | 11.67 | 1.86 |
| IRASF101730828 | 233.0 | 4 | 11.89 | 2.07 |
| NGC5256 | 128.3 | 4 | 11.30 | 1.48 |
| MCG0818013 | 119.5 | 4 | 11.35 | 1.53 |
| ESO077IG014E | 195.4 | 4 | 11.68 | 1.86 |
| NGC7592W | 112.1 | 4 | 10.32 | 0.50 |
| NGC7674 | 133.9 | 4 | 11.24 | 1.42 |
| IRASF122240624 | 121.3 | 4 | 11.41 | 1.59 |
| IC0860 | 50.3 | 4 | 11.08 | 1.26 |
| ESO239IG002 | 202.5 | 4 | 11.90 | 2.08 |
| NGC7591 | 75.3 | 4 | 11.07 | 1.25 |
| MCG0160022 | 106.5 | 4 | 11.12 | 1.30 |
| IRASF013641042 | 228.7 | 4 | 11.86 | 2.04 |
| NGC 34 | 89.5 | 4 | 11.50 | 1.68 |
| ESO319G022 | 74.4 | 4 | 11.01 | 1.19 |
| IC5298 | 126.4 | 4 | 11.54 | 1.72 |
| Arp86N | 77.6 | 4 | 9.94 | 0.12 |
| NGC5734N | 62.1 | 4 | 10.78 | 0.96 |
| NGC5734S | 62.1 | 4 | 10.43 | 0.61 |
| NGC5990 | 58.0 | 4 | 10.81 | 0.99 |
| NGC0232E | 101.5 | 4 | 10.75 | 0.93 |
| NGC77714W | 64.8 | 4 | 10.21 | 0.39 |
| ESO420G013 | 53.9 | 4 | 10.98 | 1.16 |
| MCG0506036N | 156.7 | 4 | 10.98 | 1.16 |
| CGCG436030 | 144.6 | 4 | 11.67 | 1.85 |
| IIIZw035† | 128.8 | 4 | 11.66 | 1.84 |
| NGC6156† | 49.0 | 4 | 10.57 | 0.75 |
| NGC0838W | 58.0 | 4 | 10.53 | 0.71 |
| NGC0958 | 87.2 | 4 | 10.00 | 0.18 |
| NGC0877S | 58.9 | 4 | 10.34 | 0.52 |
| NGC0877N | 58.9 | 4 | 9.98 | 0.16 |
| UGC02608N | 107.0 | 4 | 11.25 | 1.43 |
| IRASF033591523 | 165.2 | 4 | 11.59 | 1.77 |
| NGC1572 | 93.2 | 4 | 11.39 | 1.57 |
| IRASF02437+2122 | 107.0 | 4 | 11.26 | 1.44 |
| ESO550IG025a | 148.8 | 4 | 11.36 | 1.54 |
| ESO550IG025b | 148.8 | 4 | 11.09 | 1.27 |
| IC4687b | 79.0 | 4 | 10.56 | 0.74 |
| IC4687c | 79.0 | 4 | 10.84 | 1.02 |
| IC4518ABa | 72.1 | 4 | 10.79 | 0.97 |
| UGC03094 | 113.5 | 4 | 11.12 | 1.30 |
| IRASF16399-0937 | 124.6 | 4 | 11.58 | 1.76 |
| CGCG141034 | 90.4 | 4 | 11.19 | 1.37 |
| CGCG468002 | 83.1 | 4 | 10.54 | 0.72 |
| IRAS035826012E | 139.0 | 4 | 11.13 | 1.31 |
| ESO602G025 | 115.3 | 4 | 11.31 | 1.49 |
| ESO453G005S | 95.0 | 4 | 11.36 | 1.54 |
| AM0702601N | 145.1 | 4 | 11.14 | 1.32 |
| IRAS 083112459* | 478.2 | 5 | 12.50 | 2.68 |
| IRAS 110950238* | 514.1 | 5 | 12.28 | 2.46 |
| IRAS 232306926* | 514.1 | 5 | 12.37 | 2.55 |
| 3C 273* | 783.9 | 5 | 12.83 | 3.01 |
| IRAS 062066315* | 437.6 | 5 | 12.23 | 2.41 |
| Mrk 463 | 235.9 | 5 | 11.79 | 1.97 |
| IRAS 192547245*† | 293.8 | 5 | 12.09 | 2.27 |
| IRAS 154620450* | 478.2 | 5 | 12.24 | 2.42 |
| IRAS 200870308* | 509.0 | 5 | 12.42 | 2.60 |
| IRAS 134511232* | 586.6 | 5 | 12.32 | 2.50 |
| IRAS 001880856* | 623.3 | 5 | 12.39 | 2.57 |
| IRAS 120710444* | 623.3 | 5 | 12.41 | 2.59 |
| IRAS 031584227* | 655.0 | 5 | 12.63 | 2.81 |
| IRAS 160900139* | 655.0 | 5 | 12.55 | 2.73 |
| IRAS 103781109* | 665.6 | 5 | 12.31 | 2.49 |
| IRAS 075986508* | 729.8 | 5 | 12.50 | 2.68 |
| IRAS 035210028* | 751.3 | 5 | 12.52 | 2.70 |
| Mrk 1014* | 811.1 | 5 | 12.62 | 2.80 |
$d$$d$footnotetext: IRAS F195421110 did not have an optical source classification in Graciá-Carpio et al. (in prep.). By relying on the equivalent width of the 6.2 m PAH feature (EW (PAH 6.2 m) = 0.09, Stierwalt et al. 2013), we classify the source as an AGN.