Can minimum-bias distributions on transverse energy test hadron production models?
Abstract
A recent study reports measurements of transverse-energy distributions at mid-rapidity for several high-energy nuclear collision systems. The data are analyzed in the context of constituent-quark (CQ) participants estimated with a Glauber-model simulation. The study concludes that systematic variations of hadron and yields previously interpreted in terms of a two-component soft+hard model (TCM) of hadron production including a dijet (hard) contribution are actually the result of CQ participant trends with only soft production. It is claimed that deviations from linear scaling with the number of nucleon participants of hadron yields vs A-A centrality do not actually arise from dijet production as previously assumed. In the present study we examine the new data in the context of the TCM and compare those results with previous differential spectrum and minimum-bias correlation analysis. We present substantial evidence supporting a significant dijet contribution to all high-energy nuclear collisions consistent with the TCM and conclude that the data, given their systematic uncertainties, fail to support claimed CQ model interpretations.
pacs:
12.38.Qk, 13.87.Fh, 25.75.Ag, 25.75.Bh, 25.75.Ld, 25.75.NqI Introduction
Some features of the hadronic final state of high-energy nuclear collisions may carry significant information about collision dynamics and production mechanisms. In order of successive integrations (and therefore reduced information) are multiparticle correlations, single-particle spectra, minimum-bias (MB) distributions of event number on integrated particle-number or momentum/energy yields within acceptance windows and centrality distributions of such quantities. This study considers MB distributions within a larger context provided by differential measures. We consider what information can be extracted from MB distributions on transverse energy and multiplicity within some angular acceptance.
Reference phenix studies mid-rapidity MB distributions on in the context of soft hadron production and a constituent-quark (CQ) model (CQM). The study concludes that a two-component model (TCM) including soft (projectile dissociation) and hard (jet-related) hadron production conventionally used to describe MB trends on and serves as a proxy for the real mechanism dominated by soft hadron production from QCD color strings connecting participant CQs, with no significant dijet contribution. The arguments supporting that interpretation are based in part on the historical development of hadronic physics since the 1960s and in part on apparent consistency between MB distributions on and and Monte Carlo simulation of MB distributions on the number of conjectured CQ participants voloshin .
The CQ narrative deviates strongly from the body of data represented by the TCM as it has developed during the past thirteen years of Relativistic Heavy Ion Collider (RHIC) operation. Study of spectra and correlations from GeV - collisions ppprd ; porter2 ; porter3 reveals a strong dijet contribution quantitatively consistent with perturbative QCD (pQCD) predictions that combine measured jet spectra describing Spp̄S calorimeter data ua1 with measured fragmentation functions (FFs) from the Large Electron-Positron (LEP) collider opal ; aleph . The - dijet systematics can be extrapolated to A-A centrality dependence via a Glauber A-A geometry model to form a TCM reference. Deviations from the - extrapolation reference may reveal new physics. In particular, features of the MB distribution on are described in detail by combining the - TCM with modification of FFs according to a simple pQCD prescription borg .
In this study we review claims that a soft mechanism following CQ scaling describes all mid-rapidity hadron and production. We summarize experimental evidence from - and Au-Au data that supports a soft+hard two-component model. We consider the structure of data from Ref. phenix and find that the reported MB distribution on for Au-Au collisions is actually consistent with the full TCM, including measured strong centrality variation of a jet-related hard component. We find no necessity to invoke CQ scaling. Certain aspects of - and A-A data appear to falsify that conjecture.
The parameter as used in this study has two conventional meanings. In the context of QCD hadron structure is a parton momentum fraction. In the context of the TCM for nuclear collisions is the fraction of - (N-N) multiplicity included in the hard component.
This article is arranged as follows: Sec. II introduces two-component and CQ models for and hadron production. Sec. III reviews relevant analysis methods for high-energy nuclear collisions. Sec. IV introduces PHENIX data and CQ interpretations. Sec. V summarizes the phenomenology of 200 GeV - collisions. Sec. VI summarizes the phenomenology of 62.4 and 200 GeV Au-Au collisions. Sec. VII presents a set of challenges for the CQ model based on material in the previous two sections. Secs. VIII and IX present Discussion and Summary. Three appendices review TCM descriptions of MB distributions, TCM energy dependence and the algebraic structure of joint MB distributions.
II and hadron production models
This study compares two-component (significant dijet component) and CQ (no significant dijet component) models for transverse-energy and hadron production near mid-rapidity. Reference phenix favors a CQM in which hadron production is dominated by soft processes (conjectured fragmentation of color strings connecting CQs) with systematics determined by CQ participant number . The role of dijets is assumed to be negligible. Supporting arguments for the CQM are derived from centrality dependence of and production and from the structure of MB distributions on those quantities. The TCM alternative includes dijet production from collisions of small- gluons as a significant component. Advocates of the CQM assert that the TCM serves only as a proxy for the CQM in describing and hadron production. In this section we introduce the two models.
II.1 The CQM and soft hadron production
Mid-rapidity measurements of and are reported to give “excellent characterization of the nuclear geometry…and are sensitive to the underlying reaction dynamics…” phenix . For example, is found to deviate from strict proportionality to the number of participant nucleons (linearity) expected for soft hadron production. That deviation has been characterized conventionally by the two-component (soft+hard) model, with dijet production as the hard component.
However, for the CQM it is assumed that mid-rapidity hadron and production are dominated by low- soft hadrons and should therefore be insensitive to hard processes. An alternative model based on the number of CQ participants includes only soft-hadron production (no dijets), with produced and proportional to the number of color strings that connect constituent quarks. The relation is assume voloshin based on data from Ref. phobostcm that cover only the most-central 40% of the Au-Au total cross section.
Reference phenix claims to establish the same proportionality for , but the analysis and its interpretation are constrained by critical assumptions: “…possible models motivated by the fact that half the momentum of a nucleon is carried by [small-] gluons when probed at high in hard-scattering are not considered…we limit our comparison to the nucleon and [large-] constituent-quark participant models…widely used since the 1970’s….” The study concludes that “…the success of the two component model [of hadron and production] is not because there are some contributions proportional to and some proportional to [], but rather because a particular linear combination of and turns out to be an empirical proxy for the nuclear geometry of the number of constituent quark participants, in A+A collisions.” Thus, the TCM “…does not represent a hard-scattering component in distributions.” Reference phenix rejects any statistically-significant role for dijets in HE nuclear collisions.
II.2 The TCM and importance of small- gluons
A key assumption in the argument of Ref. phenix is exclusion of the role of small- partons (mainly gluons) in hadron and production at mid-rapidity. However, that assumption contradicts modern QCD theory. The description of hadron small- structure (parton distribution functions or PDFs) has been greatly refined over the past two decades. It is likely that small- gluons dominate hadron production in high-energy nuclear collisions, both as sources of “soft” hadron production and, via large-angle parton-parton scattering, as sources of “hard” dijet production. The latter can be predicted quantitatively via pQCD calculations given the flux of small- gluons fragevo .
The TCM has had two principal manifestations at RHIC: (a) phenomenological description of A-A production with TCM parameter fitted to more-central A-A data kn and (b) extrapolation (based on the Glauber model of A-A collisions) of a detailed TCM for - collisions including direct dijet manifestations in spectra and correlations compatible with pQCD calculations. The extrapolation from - provides a Glauber linear superposition (GLS) reference for the TCM in A-A collisions porter2 ; porter3 ; ppprd . Reference (b) serves as a null hypothesis: A-A centrality trends inconsistent with the GLS reference (e.g., requiring a variable ) may indicate novel physics hardspec ; fragevo .
The number of constituent-quark participants is determined by a Glauber-model simulation of A-A collisions assuming three CQs per nucleon, with cross sections adjusted to be self-consistent. By hypothesis CQs reside near (dressed quarks or valons valons ) whereas according to modern QCD the partons most responsible for mid-rapidity hadron production at RHIC energies should reside near . Within the same QCD context the small- structure of hadrons should be universal, not influenced by the configuration of valence quarks.
In this study we present several examples from - collision systematics that exclude the CQ hypothesis. We summarize detailed relations among yields, spectra and correlations that are describe accurately by a TCM reference derived from - data quantitatively related to pQCD calculations. The - reference is then modified in a simple manner, again consistent with pQCD, to describe a broad array of data from more-central Au-Au collisions. We relate the TCM to model and data MB distributions and demonstrate accurate correspondence.
III Analysis methods
We briefly summarize the kinematic variables, spaces and methods required to describe high-energy nuclear collisions, especially related to A-A centrality measurement and yield, spectrum and correlation measurements. Additional method descriptions can be found in Refs. ppprd ; hardspec ; porter2 ; porter3 ; inverse ; axialci ; anomalous ; davidhq ; davidhq2 .
III.1 Kinematic variables and spaces
High-energy nuclear collisions are described efficiently within a cylindrical coordinate system , where is the transverse momentum, is the azimuth angle from a reference direction and pseudorapidity is a measure of the polar angle, the approximation being valid near . A bounded detector angular acceptance is denoted by intervals () in the primary single-particle space .
Although scalar momentum is directly measured by particle detectors in this study we prefer to use an alternative measure. To provide better visual access to low-momentum structure and to simplify the description of jet-related spectrum hard components (defined below) we present single-particle (SP) spectra in terms of transverse rapidity with transverse mass and rest mass assumed for unidentified hadrons. The statistical measure (both event-wise and ensemble means) is retained for analysis of spectra ppprd ; hardspec , fluctuations ptfluct and correlations ptscale ; ptedep .
The main kinematic quantity for this study is transverse energy as measured by an electromagnetic calorimeter (EMCal) and integrated within some angular acceptance. We adopt the PHENIX notation convention . We also consider per hadron = / within some acceptance.
III.2 A-A centrality measures
The A-A centrality evolution of , and other quantities is a major issue for this study. A-A centrality is conventionally measured at RHIC by Glauber-simulated participant-nucleon number . However, alternative measures offer better access to the more-peripheral centrality variation required to test relevant hypotheses.
Minimum-bias distributions of A-A cross section on participant number and N-N binary collision number are accurately described by power-law trends, leading to simple parametrizations in terms of the fractional cross section powerlaw
| (1) |
with and for 200 GeV Au-Au collisions. Those parametrizations describe Glauber simulations (with mb) at the percent level (e.g., within 1% of the 200 GeV values in Table V of Ref. phenix ). We use the same values for all energies above GeV as purely geometric centrality measures. The preferred centrality measure for data plots is mean participant path length which provides good visual access to the more-peripheral data required to test the N-N linear-superposition hypothesis.
In Ref. phenix the number of conjectured participant quarks is also determined with a Glauber Monte Carlo simulation. The CQ cross section is defined so as to sum to the N-N cross section at each collision energy, and the number of participant CQs is then determined vs A-A centrality. Simulation results are shown in Fig. 1 (left panel) as the ratio with open points ( from Ref. phenix Table V) and solid points [ from Eq. (III.2)]. The solid curve is a simple parametrization used below for illustration. The open and solid triangles represent estimated ratios for 200 GeV - collisions. The solid point is obtained by extrapolating the solid curve. The open point is discussed in Secs. IV.3 and VII.2.


In Sec. V of Ref. phenix the trend (solid curves) is said to be similar to that for the charged-particle yield per participant nucleon, possibly explaining the measured data trend without recourse to a TCM dijet contribution. In Fig. 1 (right panel) distributions for three energies are scaled down by common factor 1.35. The upper dashed line that does approximate the trend is the conventional TCM for 200 GeV assuming fixed parameter value for all centralities. The lower dashed curve is the TCM with parameter varying from 0.015 (GLS extrapolation from - collisions) to 0.095 (derived empirically from more-central Au-Au collisions) as required by the measured spectrum and angular-correlation data described below. The lowest two curves show the same variable- TCM model derived from 130 and 62.4 GeV data. Deviations from the - GLS reference value have been related quantitatively to modification of parton fragmentation to jets in more-central 200 GeV Au-Au collisions fragevo .
Figure 1 (right panel) suggests that detailed comparisons between measured hadron-production trends and the trend for more-peripheral A-A collisions may already falsify the CQM, as discussed in Sec. VII.3. But that centrality interval is typically de-emphasized at RHIC. More-differential methods may provide a definitive picture, as discussed in Secs. V and VI.
III.3 The two-component model
The TCM of hadron production in high-energy nuclear collisions includes (near mid-rapidity) a soft component (SC) attributed to projectile-nucleon fragmentation (dissociation) with A-A centrality dependence proportional to and a hard component (HC) attributed to large-angle-scattered parton fragmentation to dijets proportional to . The TCM has been applied successfully to single-particle spectra and their integrated yields ppprd ; hardspec and to two-particle correlations porter2 ; porter3 ; axialci ; anomalous from - and A-A collision systems at several energies.
The soft component of spectra appears to be universal across a broad range of collision systems and energies, reflecting local charge conservation (unlike-sign pair correlations dominate) and an spectrum described by a Lévy distribution with fixed parameters ppprd ; hardspec . The hard component of - spectra is quantitatively consistent with predictions fragevo derived from measured jet (parton) energy spectra ua1 and fragmentation functions (FFs) eeprd . The hard component of - angular correlations on angle differences is consistent with theoretical expectations for dijets: (a) a same-side (SS) 2D peak at the origin corresponds to intrajet correlations and (b) an away-side (AS) 1D peak on azimuth corresponds to interjet (back-to-back jet pairs) correlations.
A TCM reference (null hypothesis) for A-A collisions can be defined by extrapolation from - collision data assuming linear superposition of N-N collisions according to the Glauber model, the reference then described appropriately as Glauber linear superposition anomalous . Testing the GLS reference in A-A collisions requires accurate measurements especially for more-peripheral collisions. Deviations from the GLS reference in more-central A-A collisions may then signal new physics. Monte Carlos such as HIJING (with no jet quenching hijing ) based on models of - collisions (PYTHIA pythia , HERWIG herwig ) should follow the GLS model derived from - data for all Au-Au centralities, but they do not anomalous . The peripheral region is typically de-emphasized in RHIC analysis, for instance by plotting data vs where the more-peripheral 50% of the total cross section is confined to or 13% of the total axis interval. Rather than extrapolate upward from - collisions to establish a GLS reference the conventional approach at RHIC has been to derive a fixed value of TCM model parameter from more-central Au-Au data and then compare only the more-central region with A-A models phobostcm ; kn .
The hard components of spectra and angular correlations from more-peripheral Au-Au collisions are indeed consistent with extrapolation of measured - structure but undergo substantial changes with increasing Au-Au centrality above a sharp transition (ST) on centrality near or hardspec ; fragevo ; anomalous . Accurate spectrum and MB measurements reveal that the effective TCM from 200 GeV Au-Au increases with centrality from a smaller - value in more-peripheral collisions to six times that value in more-central collisions, the change corresponding mainly to evolution of parton FFs fragevo . The strong variation of has implications for the structure of MB event-frequency or cross-section distributions on and , as discussed in App. A.1.
III.4 Single-particle spectra in p-p and A-A collisions
Single-particle or spectra from high-energy - collisions can be grouped in multiplicity classes based on the total charge multiplicity within some angular acceptance . Variation of the spectrum shape with multiplicity can be employed to decompose spectra into two components with fixed shapes independent of multiplicity: “soft” (scaling approximately as ) and “hard” (scaling approximately as ) ppprd . The soft and hard spectrum components integrated within some angular acceptance yield soft and hard multiplicity components, with . The quantitative correspondence of the - spectrum hard component to a pQCD jet description was established in Ref. fragevo .
The - spectrum TCM serves in turn as the baseline or GLS reference for an A-A spectrum TCM in which some model parameters extrapolated from - phenomenology are permitted to vary to accommodate the A-A spectrum data. Whereas is the control or “centrality” parameter for - collisions participant path length is the relevant centrality parameter for A-A collisions.
III.5 Correlations in p-p and A-A collisions
Angular correlations on and correlations on transverse-rapidity space have been studied in detail for - and A-A collisions axialci ; axialcd ; porter2 ; porter3 ; anomalous ; elizabeth . A two-component model for correlations in - collisions provides the basis for a mathematical model of angular correlations porter2 ; porter3 which is then applied to A-A collisions with minor modifications axialci ; anomalous . The SC produces correlations only on , only for unlike-sign (US) charge pairs, and only below 0.5 GeV/c porter2 ; porter3 . It falls to zero amplitude by mid-centrality in 200 GeV Au-Au collisions.
The hard component of angular correlations is fully consistent with expectations for dijet correlations below the sharp transition on centrality. Above the ST the same-side 2D peak (intrajet correlations) becomes elongated on and narrows significantly on axialci ; anomalous . The volume of the SS 2D peak is consistent with the SP spectrum hard component in terms of number of integrated fragment pairs, corresponding quantitatively to the pQCD-predicted number of dijets and their fragments jetspec . angular correlations analogous to particle-number angular correlations are described in Sec. VI.4.
Particle-number correlations on transverse-rapidity space from - collisions also exhibit distinct soft and hard components porter2 ; porter3 . The 2D soft component lies almost completely below GeV/c. The 2D hard component lies almost completely above that point and, projected onto 1D , is consistent with the SP spectrum hard component. The phenomenology of correlations has been explored in detail porter2 ; porter3 ; elizabeth . Above the ST on Au-Au centrality the hard component splits, with one part (mainly pions) moving to smaller and the other part (mainly protons) moving to larger , again in agreement with measured SP spectrum trends hardspec .
IV PHENIX minimum-bias data
We first consider the analysis and alternative interpretation of MB distributions on presented in Ref. phenix . The basic data consist of MB distributions integrated within some fiducial angular acceptance and corrected to a reference acceptance as shown in Fig. 3 and corrected production vs centrality as in Table V of that paper. For the present study we emphasize the 200 GeV - and Au-Au data and do not consider d-Au data or Additive Quark Model scaling. As noted, to simplify the notation we adopt the PHENIX convention .
IV.1 PHENIX EMCal angular acceptance
The absolute size of the detector angular acceptance has important consequences for MB distributions. In Ref. phenix a distinction is established between the fiducial (physical) detector angular acceptance and the defined reference acceptance (). The PHENIX EMCal has a substantially smaller angular acceptance than some comparable detectors. For instance, the effective acceptance of the PHENIX EMCal is 1/(8.4 x 1.2) 1/10 the STAR TPC or barrel EMCal acceptance. Certain aspects of data obtained within the fiducial acceptance such as mean values can be corrected to a reference acceptance. But the effects of acceptance on other aspects such as statistical fluctuations may persist as biases in the corrected data. Two issues are relevant for this study: (a) void probabilities and (b) structure of the terminus or central-A-A end (tail) of MB distributions.
In the average non-single-diffractive (NSD) - collision approximately 10 particles (charged + neutral) may fall within the STAR fiducial EMCal/TPC acceptance (with ), but only 1 particle would fall within the PHENIX fiducial acceptance. The Poisson void probability for STAR is exp(-10) , but for PHENIX the void probability is (as in Table X of Ref. phenix ). Reference phenix notes that “The importance of taking account of …can not be overemphasized.” For the PHENIX acceptance that statement is well justified.
MB data from two detectors corrected to a common reference acceptance may be quite different in the limit of central collisions where the tail of the distribution reflects fluctuations in central collisions determined by the actual or fiducial acceptance. The tail width relative to the terminus mean (assuming Poisson statistics) for STAR relative to PHENIX should be . Rescaling the MB distribution to the reference acceptance will not change that ratio. Thus, the terminus widths of MB distributions from PHENIX should be about three times larger than the equivalent from STAR. That issue is discussed further in App. A.2.
IV.2 centrality trends
Figure 2 (left panel) shows ratio from Au-Au collisions for three energies vs centrality measured by mean participant pathlength . The data and uncertainties are from Tables V-VII of Ref. phenix while the and values are from Eq. (III.2). The uncertainties include total point-to-point plus common offset systematic uncertainties. The centrality trends are described as varying “nonlinearly” with , interpreted to imply inconsistency with the participant scaling expected from soft production and therefore apparently requiring hard scattering and the TCM.


Figure 2 (right panel) shows ratio vs centrality obtained by dividing the data in the left panel by ratio from Fig. 1. The ratio data above appear to be constant within systematic uncertainties, suggesting that mid-rapidity hadron production in Au-Au collisions actually occurs by a soft process scaling with the number of CQ participants, not with nucleon participants. Values for 200 GeV - collisions derived from data in Table X of Ref. phenix are plotted at ( NSD N-N collisions). The upper - datum is said to confirm the self-consistency of the CQ analysis. The two - results are related to - values in Fig. 1 and are discussed in Secs. IV.3 and VII.2.
Figure 3 (left panel) shows the TCM for data from three collision energies similarly scaled by . The dotted curve represents the conventional TCM with fixed , while the other curves represent variable- models that describe spectrum yields accurately. The dotted curve appears to be constant within typical systematic uncertainties, seeming to confirm a claim by Ref. phobostcm that the increase in described by the fixed- TCM arises not from increasing contributions by hard processes but rather from increasing CQ number (and associated soft hadrons) relative to participant nucleons. However the lowest three curves, representing measured production trends, consistent below the ST with the GLS reference extrapolated from - measurements, deviate substantially from the CQM for more-peripheral collisions and may falsify that model (see Sec. VII.3). The two points are - values derived from the two - values of from Fig. 1. The preferred value from a - Glauber simulation leads to the open point which is far above the trend for Au-Au collisions.


As a logical next step we bypass the conjectured geometry model parameters by calculating , where represents all hadrons contributing to , approximated in this case by to account for s. Figure 3 (right panel) shows vs Au-Au centrality (points with uncertainties) for three collision energies. The values are derived from the full TCM with variable that describes accurately the measured charged-particle spectrum integrals hardspec . Also shown is the value for 200 GeV - collisions (solid triangle) derived from the PHENIX corrected value for - collisions from Table X ( GeV). That value is consistent with NSD - charge-particle GeV/c given with additional factor 1.5 to approximate total hadrons.
If free-streaming hadrons emerge from a thermalized medium, or is expected to relate to a temperature T that may vary with A-A centrality. However, the concept of an equilibrated temperature for Au-Au collisions below the sharp transition that appear to exhibit negligible particle rescattering is questionable.
The centrality trend can be predicted from the TCM based on measured spectrum properties hardspec as
| (2) |
where is the same centrality-dependent parameter that describes integrated yields , is the fixed mean value for soft hadron production and is the mean value for the hard component that varies strongly with centrality due to modification of parton fragmentation. Below the Au-Au ST and have fixed values derived from - collision data.
To facilitate comparisons we approximate all hadrons as pions. The effect of the pion mass is small. is only a few percent larger than for GeV so we increase measured values by 0.05 GeV/c accordingly. The value for NSD - collisions (see Fig. 4 – right panel) is 0.385 GeV/c, and the value is 1.2 GeV/c. In Fig. 3 the horizontal hatched band estimates and the dash-dotted curve represents the GLS reference prediction. We observe that the hadron hard-component multiplicity increases much faster than GLS above the sharp transition (vertical band ST). If remained fixed while increased according to measurements the predicted trend would be the dashed curve. However, spectrum analysis reveals that hard falls from 1.2 GeV/c below the ST to 0.6 GeV/c for more-central Au-Au collisions. If that variation is also incorporated the TCM prediction for becomes the solid curve.
The PHENIX 200 and 130 GeV Au-Au data trends are consistently 35% above the solid curve, whereas the value for - collisions (solid triangle) is consistent with STAR data (hatched band). It is notable that the point-to-point variation of PHENIX data follows the TCM prediction closely. The dotted curve is the TCM solid curve multiplied by factor 1.35. The TCM was not otherwise adjusted to accommodate those data.
IV.3 Minimum-bias distributions on
Given those results for the Au-Au centrality dependence of mean values, Ref. phenix extends the CQ treatment to full MB distributions on . Several hypotheses are considered in which production scales with some element number , where can represent N-N binary collisions, participant (wounded) nucleons, constituent quarks or participant-quark-related strings. A model MB distribution on an observable such as is generated by folding a MB distribution on with model conditional MB distributions on given elements. The result is described as the Extreme Independent Model.
The A-A MB distribution on is determined by Glauber Monte Carlo simulations. The measured MB distribution on for - collisions is used to infer an equivalent for element type denoted . Conditional distribution for elements is obtained by convoluting multiple times and combining with calculated weights. Finally, the A-A MB distribution on is obtained by convoluting the MB distribution on with the according to Eq. (7) of Ref. phenix .
The model chosen for is the gamma distribution, for which a simple parameter change conveniently describes the results of multiple convolutions. Aside from the algebraic convenience the gamma distribution on does not describe the - MB distribution well; the tail is poorly represented. The importance of accounting for void events (N-N events with no in the fiducial acceptance, described by probability ) is emphasized.
The Au-Au Glauber MB distributions on and are accurately represented by Eq. (III.2). The MB distribution on is shown in Fig. 9 of Ref. phenix . Figure 10 (b) of Ref. phenix demonstrates an unfolding of the - MB distribution to obtain . The decomposition is based on numbers in Table XIII equivalent to for - collisions. That value can be contrasted with obtained by extrapolating the trend in Fig. 1 to (N-N collisions). The difference is discussed in Sec. VII.2. The MB endpoint on is 382, whereas that on is approximately . The CQM strongly disagrees with the tail of the - data distribution as noted. Those results are combined per Eq. (7) or (12) to obtain the model MB distribution compared with Au-Au data in Fig. 11. The model is said to describe the MB data well. The “excellent agreement” is interpreted to support the CQM.
IV.4 The TCM as expressed within a CQM context
In the CQM context a significant role for dijet production in the MR is considered unlikely based on historical experience: “This [hard scattering in the TCM] seems to contradict the extensive measurements of and distributions in p+p collisions described in Sec. II [of Ref. phenix ] which show that these distributions represent measurements of the ‘soft’ multiparticle physics that dominates the p+p inelastic cross section” phenix . Reference phenix proposes relations between the TCM and (a) production centrality trends and (b) MB distributions on based on its Eqs. (6,21) interpreted to demonstrate the unsuitability of the TCM for description of data.
The conjectured TCM for production includes a single-component factor pp to represent - collisions
| (3) |
implying that production for - soft and hard components is the same (a common factor). If TCM parameter in Eq. (3) also describes hadron yields then the equation reduces to AA = pp and production per hadron is assumed to be independent of A-A centrality. But those assumptions are contrary to the TCM with variable and contradicted by differential spectrum and correlation data. Equation (3) can be contrasted with Eq. (2) (and see App. A) where soft and hard components in - collisions are quite different, and the hard component is allowed to vary with Au-Au centrality consistent with measured spectrum HC evolution hardspec .
The relation of the TCM to MB distributions is considered to be especially problematic. Analogies are drawn from conjectured TCM descriptions of production centrality trends. It is first assumed that the data MB distribution is the weighted sum of the limiting cases (MB on and ) by analogy with the TCM for integrated yields [e.g. Eq. (3) above]. One example in Figs. 17 and 18 of Rev. phenix is represented by the first line of
| or | ||||
with the same value GeV for and . Figure 19 of Ref. phenix shows an alternative hypothesis, scaling the limiting cases horizontally on by fractions and as in the second line. Since neither expression corresponds to the MB data the TCM is rejected. But the apparent disagreements between CQM conjectured TCM implementations and MB data come not from inherent failings of the TCM but from incorrect implementations, as discussed further in Sec. VIII.4.
The TCM does appear to describe production vs centrality trends accurately, as demonstrated in Sec. VI.5. But that model is said to be “just a proxy for the correct description of the underlying physics, because is strictly proportional to ….” The TCM is described as an “empirical proxy” referring to the conventional RHIC TCM implementation with fixed fitted to more-central Au-Au data kn . But the TCM for production centrality dependence is not inferred empirically from a relation like Eq. (6) of Ref. phenix . It is predicted from measured - TCM trends and the Glauber model that serves as a null hypothesis (GLS) for more-central A-A collisions. The proper TCM for MB distributions describes MB data accurately as demonstrated in App. A, whereas the CQM cannot produce a GLS equivalent.
We now examine comprehensive yield, spectrum and correlation systematics from RHIC - and Au-Au collisions in the context of the TCM. We demonstrate that the TCM provides a remarkably accurate description of an extensive data phenomenology. Those data include dijet production trends that are quantitatively consistent with pQCD theory and thus inconsistent with the CQM.
V - collisions and minijets
The TCM derived from - spectrum data and extrapolated to A-A centrality provides a reference for A-A collisions representing Glauber linear superposition. The hard-component contribution to the - TCM is attributed to MB dijets. Because of the steepness of the QCD parton spectrum most dijets appear near the most-probable jet energy 3 GeV (defining minijets) ua1 . Issues relating to - collision centrality, hadron and dijet production and the TCM are discussed in pptheory .
V.1 Soft and hard events and yield components
- collisions can be classified as soft or hard event types. Soft and hard events are distinguished from soft and hard components of ensemble-averaged yields, spectra and correlations. Soft events include no jet structure within the acceptance and therefore only a soft component. Hard events include at least one minimum-bias dijet within the angular acceptance and therefore both soft and hard spectrum and correlation components.
We observe that dijet production in - collisions scales approximately as ppprd and is most directly related to the multiplicity soft component . For a given the dijet number within some acceptance is , with dijet frequency per unit scaled from non-single-diffractive (NSD) - collisions. The relation between soft and hard components and and dijet rate is established in Sec. V.3. The Poisson probabilities for soft and hard events are then respectively and . For small . For the PHENIX acceptance the probability of a dijet in NSD - collisions is .
The yields defined here correspond to spectrum integrals within some angular acceptance and . For each multiplicity class defined in terms of an interval we have averaged over all events. For soft events and for hard events . We then obtain the following relations:
| (5) | |||||
V.2 p-p single-particle spectra
Single-particle spectra from 200 GeV - collisions plotted on for several classes reveal a composite spectrum structure represented by two fixed functional forms [unit-integral soft and hard components and ] with amplitudes scaling approximately as and ppprd . The combination defines the TCM for spectra from - collisions conditional on measured integrated within some acceptance described by
where and are soft and hard angular densities, and is the corresponding total charge density. Soft component is defined as the limiting form as of spectra normalized as . Hard component models data hard components obtained by subtracting soft-component model from those normalized spectra.
The hard component of 1D SP spectra, interpreted as a manifestation of MB dijet structure, is quantitatively consistent with jet-related two-particle correlations and pQCD predictions ppprd ; hardspec ; fragevo ; jetspec . The fixed hard-component spectrum shape is predicted by measured - fragmentation functions convoluted with a minimum-bias pQCD parton (dijet) spectrum with lower bound near 3 GeV and spectrum integral mb fragevo .
V.3 p-p minimum-bias dijet production
Equation (V.2) integrated over some angular acceptance becomes
| (7) |
The multiplicity trend for the extracted hard components reported in Ref. ppprd implies that with within or
where the second line represents the jet hypothesis from Ref. ppprd and defines dijet frequency (dijet number per - event per unit ) with mean dijet fragment multiplicity into acceptance. Factor represents the average fraction of a dijet that appears in hard events within acceptance fragevo .
Scaling from the trend in Eq. (V.3) we can estimate for NSD - collisions
| (9) |
assuming for 200 GeV NSD - collisions and from - measurements eeprd ; ppprd . That result can be compared with a pQCD prediction for - NSD collisions fragevo . Thus, from a TCM analysis of the dependence of - spectra we obtain the model functions and , the soft and hard hadron densities and and the dijet density per - event .
V.4 p-p mid-rapidity production trends
Figure 4 (left panel) shows the data trend that lead to Eq. (V.3). The points are determined by running integrals of spectrum data to obtain integrated multiplicities and with minimal model bias. The ratios do not depend on a spectrum model except for the soft-component Lévy distribution used to extrapolate the spectra to zero momentum. The fixed soft model is common to all multiplicity classes. The solid line is for acceptance . The coefficient changes to 0.006 for the STAR TPC acceptance with . Given an accurate TCM reference for - SP spectra we can extract an analytic trend that may provide a baseline for data from Au-Au collisions.


Figure 4 (right panel) shows values also extracted as limits of running integrals of SP spectra. The solid line is the TCM weighted-mean expression [see Eq. (2)] ] GeV/c with , where the weights are approximately and , 0.385 GeV/c is an estimate of soft component soft and 1.2 GeV/c estimates hard component hard, slightly above the hard-component peak mode at 1 GeV/c due to its skewness (QCD power-law tail). The uncertainty in the soft-component (hatched band) is dominated by uncertainty in the spectrum extrapolation to zero momentum, since 30% of the spectrum integral lies below 0.2 GeV/c.
In conventional descriptions of scattered-parton fragmentation to collimated jets and projectile-hadron fragmentation (dissociation) to hadrons along the collision axis there is a direct correspondence between partons at the bottom of a fragmentation cascade and the final-state hadron distribution denoted by Local Parton-Hadron Duality (LPHD) lphd . In the LPHD description the small- partons described by a parton distribution function or PDF should correspond quantitatively to soft hadron production at mid-rapidity, and dijet production at mid-rapidity should correspond to counterpropagating fluxes of small- partons within the colliding hadron projectiles.
The detailed correspondence between soft and hard spectrum components represented by Fig. 4 suggests that (a) small- gluons represented by provide the underlying degree of freedom in high-energy - collisions and (b) the dijet production trend represented by falsifies the eikonal approximation as applied to - collisions. According to the Glauber model applied to A-A collisions and based on the eikonal approximation the expectation for - collisions should be (dashed curve in Fig. 4 – left panel). The data trend implies that each participant parton in one projectile can interact with any participant in the other projectile pptheory .
V.5 p-p two-particle correlations
Two-particle correlations for 200 GeV - collisions are fully consistent with the SP spectrum results described above and follow the same TCM quantitatively The correlation measure is a 2D density proportional to the number of correlated pairs per final-state hadron anomalous and is analogous to ratio assuming correlated-pair number.
Figure 5 (left panel) shows correlations for 200 GeV NSD - collisions. The logarithmic interval corresponds to GeV/c. The two peak features correspond to TCM soft and hard components. The 2D hard component with mode near = 2.7 (1 GeV/c) corresponds quantitatively to the 1D SP spectrum hard component modeled by . The soft component is consistent with longitudinal fragmentation (dissociation) of projectile nucleons.
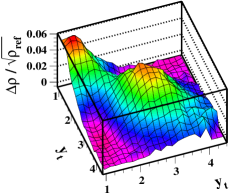
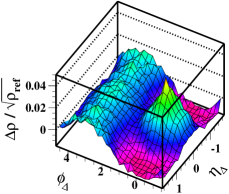
Figure 5 (right panel) shows 2D angular correlations on difference variables (e.g. ). The hadron values for that plot are constrained to lie near 0.6 GeV/c (just above = 2), corresponding to the saddle between soft and hard components in the left panel. Although the hadron is very low the structures expected for jet angular correlations are still clearly evident: a SS 2D peak at the origin representing intrajet correlations and a 1D peak on azimuth corresponding to interjet correlations between jets from parton collision partners. The soft component, a narrow 1D Gaussian on including only unlike-sign charge pairs, is excluded by the GeV/c cut. There are no “long-range” correlations on corresponding to the soft component.
VI A-A hard-component Systematics
Given the detailed reference TCM from - collisions we now consider TCM evolution with A-A centrality and some implications for hadron and production. The inferred A-A spectrum soft component is consistent with that derived from - spectra and appears to represent a universal transverse property of fragmentation.
VI.1 A-A integrated yields
The TCM for - collisions is controlled by the SC multiplicity , conjectured to represent the number of participant small- gluons. As noted, HC production proportional to number of participant-parton binary collisions scales as . The ratio of binary collisions to participants is then proportional to the number of participants, pptheory .
By analogy the TCM for A-A collisions is controlled by the SC scaling with participant multiplicity . The A-A hard component HC should scale with the number of N-N binary collisions estimated in the Glauber model (based on the eikonal approximation) to vary as . For yields and spectra scaled by number of participant pairs the HC should vary proportional to , consistent with the eikonal approximation (whereas - collisions do not follow the eikonal approximation). The TCM for A-A yields within some acceptance is
| (10) |
with the limiting case of Eq. (5). For the GLS reference retains the fixed value from NSD - collisions. We now focus on HCs for A-A spectra and correlations.
VI.2 Au-Au single-particle spectra
Figure 6 (left panel) shows Au-Au spectrum HC data for identified pions from 0-12% central 200 GeV Au-Au collisions (points). Hadron spectrum densities have the form . Also shown are the - TCM HC model derived from - collisions (dashed curve) and the GLS prediction for central Au-Au (dash-dotted curve, 5 times dashed curve). The centrality-dependent data HC (solid dots) is obtained by
| (11) |
where is by definition the limiting case of as (no dijet production) hardspec . As noted, is consistent with the shape of the SC model inferred from - collisions. For the GLS reference retains the fixed form independent of A-A centrality and the HC scales with .
Above = 4 ( GeV/c) the central-Au-Au pion spectrum is suppressed by factor 5, consistent with conventional measurements, and thus happens to coincide with the - hard component. At lower momenta (below = 3.3 or GeV/c) the hard-component data rise far above the GLS reference, which fact is obscured by due to severe bias by inclusion of the spectrum SC in that measure. The solid curve is a pQCD calculation based on a measured MB parton spectrum folded with parametrized FFs fragevo . The same calculation for - collisions (dashed curve) describes the - hard-component data (open circles) quantitatively at the 10% level. For more-central Au-Au collisions the FF parametrization is modified (one parameter is changed by 10%). The parameter change is equivalent to changing a gluon splitting function in the DGLAP equations borg . The theory description (solid curve) is then accurate over the entire acceptance. On that basis there can be little doubt that the TCM pion spectrum HC is jet related even in central Au-Au collisions.
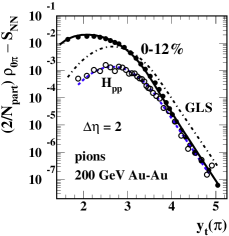
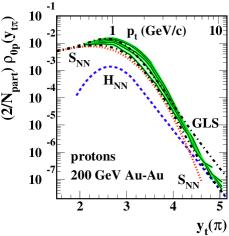
Figure 6 (right panel) shows full-spectrum data for identified protons. The proton spectra (thin solid curves) are compared with inferred spectrum SC (dotted curve) common to all centralities. The dashed curve is the --equivalent proton HC model derived as the limiting case of the Au-Au HC for (isolated N-N collisions). It is remarkable that the proton HC amplitude near ( GeV/c) is comparable to the pion HC amplitude at the same point, although the spectrum SCs are very different hardspec .
The proton HC evolution with Au-Au centrality is formally similar to that for pions in the sense that strong reduction at larger is compensated by enhancement at some smaller , but for protons the enhancement occurs only above 1 GeV/c (approximately the proton mass). The dash-dotted curves marked GLS are defined as with , 5.8. The spectrum data for protons in central collisions cross the GLS curve at (4 GeV/c), whereas the crossing for pions is at (1.3 GeV/c). And below 1 GeV/c the proton HC is consistent with no FF modification, follows the GLS.
The difference in evolution between proton and pion HCs fully accounts for the so-called baryon-meson (B/M) puzzle conventionally attributed to CQ coalescence. These results suggest that the B/M puzzle is actually an aspect of parton fragmentation possibly related to hadron fragment mass hardspec . The centrality evolution of proton spectra also strongly supports interpretation in terms of minimum-bias jets.
VI.3 Au-Au number angular correlations
Figure 7 shows 2D number angular correlations from 200 GeV Au-Au collisions for all GeV/c and for peripheral (left panel, 85-95%) and central (right panel, 0-5%) collisions. In both cases a SS 2D peak and AS 1D peak on azimuth are evident as for - collisions. Absent the restrictive cuts invoked for Fig. 5 (right panel) a narrow 2D peak attributed to conversion-electron pairs and Bose-Einstein correlations (at the origin) and a 1D peak on (soft component, left panel only) appear. In the right panel the SS 2D jet peak in central collisions is strongly elongated on . A nonjet quadrupole component proportional to is not evident for these centralities but does appear for mid-central data. The z-axis zeros are defined by 2D-model fits to data in which it is assumed that the AS 1D peak is positive definite and the nonjet quadrupole has zero mean anomalous .
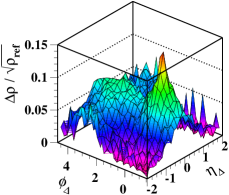
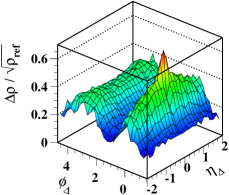
Figure 8 shows the centrality dependence of the SS 2D peak (left panel) and AS 1D peak (right panel) amplitudes for 200 GeV (solid points) and 62.4 GeV (open points). The GLS reference for those per-hadron fit-model parameters is the dashed curves defined by , where the numerator is consistent with the HC from - correlations and the denominator is the GLS hadron-yield centrality trend. The data follow the GLS trend up to the ST at (). Within a single centrality bin the slopes increase dramatically, and the amplitudes continue to increase rapidly until beyond which the data appear to fall off.


In the left panel the 62.4 GeV data multiplied by factor 1.6 coincide with the 200 GeV data. In Ref. ptedep it was observed that the energy dependence of correlation amplitudes attributed to MB jets appeared to vary as and to extrapolate to zero amplitude near GeV suggesting an energy dependence with energy scale GeV. The jet-related amplitudes in the left panel are consistent with that conjecture since . The energy trend suggests that dijet production drops to zero near 10 GeV due to kinematic constraints on parton (mainly gluon) fragmentation to charged hadrons fragevo .
The AS peak amplitudes for two energies in the right panel coincide over most centralities with no scale factor. That is expected if the energy dependence is due to the increased kinematic range of colliding small- partons with increasing collision energy. On 2D dijet rapidity space a dijet is represented by a single point. We speculate that while the kinematic boundaries of that space may expand with increasing collision energy the dijet density remains approximately the same, and the AS 1D peak represents the unchanging 2D dijet density. The SS 2D peak amplitude represents a 1D projection of that space onto its difference axis and therefore does scale with changes in the kinematic boundary on .
VI.4 Au-Au angular correlations
The plots in Figs. 5 (right) and 7 represent hadron number angular correlations. Angular correlations of hadron can be obtained either by inversion of the scale dependence of fluctuations ptscale ; inverse or by direct pair counting. The same jet-related correlation structures are observed, with minor quantitative differences in the SS 2D peak structure. Such results indicate that fluctuations, once expected to reveal critical fluctuations of temperature near a QCD phase boundary, are actually dominated by a MB jet (minijet) contribution.
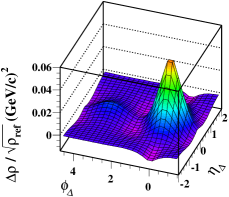
Figure 9 (upper panels) shows angular correlations for (a) 85-95% and (b) 10-20% central 200 GeV Au-Au collisions obtained by scale inversion of fluctuations inverse . Such 2D angular correlations are described by a standard fit model including several elements ptscale ; anomalous . In this case fitted AS dipole and nonjet quadrupole components have been subtracted to isolate the SS 2D peak structure. A similar analysis of HIJING Monte Carlo data confirms a jet interpretation for that structure hijscale .
Figure 9 (lower panels) shows angular correlations for the same collision systems obtained by direct pair counting, confirming the results in the upper panels obtained by fluctuation scale inversion. The inversion process smooths the data (regularization): statistical fluctuations are reduced but angular resolution is also reduced. The SS 2D peak for correlations is narrower than that observed for number correlations [compare panel (c) with Fig. 5 – right]. That difference is expected for jet correlations, since fewer fragments with larger momenta are found closer to the jet thrust axis and more fragments with smaller momenta appear at larger angles.
Two features of the SS 2D peak in correlations are especially notable. The negative-going region on either side of the peak near the origin suggests the possibility of a recoil component. These are covariance densities, and negative covariance corresponds to anticorrelation of momenta. The other feature is the “ridge” especially obvious in panel (d). The strong correlations at larger argue against elongation of the SS 2D peak in more-central Au-Au collisions residing within a soft background. Related studies of number angular correlations with cuts indicate that the SS peak elongation persists up to 4 GeV/c hadron momentum davidhq2 , a trend not likely to arise from a soft process.
Thus, in several ways the hard components of 2D number and angular correlations from Au-Au collisions follow trends expected for dijets. Dijet production closely follows the predicted GLS trend over half the Au-Au total cross section then undergoes a substantial change within a small centrality interval, described as the sharp transition. Above the ST the correlation structure continues to follow expectations for parton fragmentation to jets, but with fragmentation substantially modified.
VI.5 Correspondence of spectra and correlations
Further support for a jet interpretation of the TCM HC is provided by quantitative correspondence between spectrum and correlation data based on a dijet hypothesis. In Fig. 10 (left panel) the solid curve describes the number of dijets (at least one jet) appearing within angular acceptance (the STAR TPC acceptance) as a function of mean participant-nucleon pathlength . The - value is obtained from Eq. (9). The solid curve is the Au-Au GLS reference . The hatched band labeled ST indicates the position of the 200 GeV Au-Au sharp transition, which happens to correspond to dijet density . The dashed curve and left-hand hatched band are discussed in App. B.3.


Figure 10 (right panel) shows 200 GeV HC yields predicted from jet-related angular correlations summed with a measured soft-component contribution (solid curve jetspec ) compared to yields obtained directly from spectra (points hardspec ). The volume of the SS 2D peak in angular correlations is processed using the dijet number per event in the left panel to derive the number of correlated pairs per dijet. The number of correlated pairs is converted to the number of fragments per dijet and multiplied by to obtain the predicted fragment number per event . When that HC is added to SC we obtain the TCM prediction for charged-hadron yields. The agreement with integrated yields from hadron spectra (points) is within systematic uncertainties (upper hatched band). The dash-dotted line shows the conventional 200 GeV Au-Au TCM with fixed kn . The lower hatched band is the GLS reference TCM with derived from - spectrum data. The dashed curve shows a prediction based on CGC theory glasma1 ; kn . This comparison provides additional strong support for a dijet interpretation of the HC of spectra and correlations for all Au-Au centralities.
VII Challenging the CQM
We now confront the conjectured CQM with experimental evidence summarized in the previous two sections and arguments based on the historical development of QCD and logical structure.
VII.1 Arguments from historical concepts
Some supporting arguments for the CQM appear to be based on historical concepts of hadron production in HE nuclear collisions. It is notable that in Ref. phenix 31 references appear after 1990 whereas 48 appear before that date [note the relation to LEP commissioned in 1989 and the Hadron-Electron Ring Accelerator (HERA) commissioned in 1992]. The HERA e-p collider experiments provided a large volume of accurate data on hadron (proton) internal structure, including parton distribution functions (PDFs). The LEP - collider experiments provided a large volume of accurate data on parton FFs over a broad range of dijet energies and parton types. The two data volumes, combined with pQCD theory, accurately and comprehensively describe hadron production in HE nuclear collisions, including dijets eeprd ; fragevo .
Historical issues can be considered in a context where the full solid angle is divided into a limiting-fragmentation (LF) region near the beam rapidity and a mid-rapidity (MR) region near the collision center of momentum. With the discovery of partons (mainly valence quarks) in lower-energy e-p collisions at SLAC and the initial development of QCD the search commenced for hard parton scattering as a transport process from LF to MR in HE collisions. Hard parton scattering to jets should occur rarely, and the evidence should appear as transport from LF to MR. Jet-related hadron production in the MR should be sparse and highly structured.
As recounted in Ref. phenix , contrary to expectations copious and hadron production was actually observed in the MR. However, the production appeared to be weakly structured on angle and approximately thermal in terms of the fixed relation of to hadron multiplicity. That unexpected result lead to the conclusion that production in the MR must be dominated by soft processes such as QCD string fragmentation lund , with negligible jet contributions. The strings were thought to connect colored valence quarks/diquarks or dressed constituent quarks (valons valons ). That historical context apparently prompted Ref. phenix to the conclusion that inference of copious (semi)hard scattering to the MR (minijets) “seems to contradict the extensive measurements…[of and ]…which show that these distributions represent measurements of the ‘soft’ multiparticle physics that dominates…” - collisions. As a consequence, the study in Ref. phenix is restricted to “…the nucleon and constituent quark participant models of soft-multiparticle production widely used since the 1970’s….”
VII.2 Arguments from p-p phenomenology
The importance of projectile small- partons (mainly gluons) to hadron production in the MR has already been mentioned in Sec. II.2. Here we review some detailed aspects of - data phenomenology pertaining to that issue. The CQM must contend with the accurately-measured dependence of - collisions and copious dijet production for larger event multiplicities. Aside from substantial MB dijet production at mid-rapidity another major issue is the dominant role of fluctuations.
The integrated MR charge in 200 GeV - collisions fluctuates event-wise over a large interval (at least a factor ten), which is problematic for a CQM with 2-3 participant quarks per projectile and hadrons dominated by string fragments proportional to that number. The resolved-dijet production scales approximately as , leading to a factor 100 variation in dijet number. For 200 GeV - collisions with (NSD) the mean number of dijets within is approximately two per event, and fragments from resolved jets comprise 10% of all hadrons. A string/CQ model cannot generate dijets at that level (or at all) and cannot describe the large range of multiplicity fluctuations, whereas measured projectile small- structure and corresponding dijet production based on perturbative QCD can do so given event-wise fluctuations in the parton splitting cascade within a proton pptheory .
Figure 10 of Ref. phenix provides another indicator. The gamma-distribution model function representing the CQM (solid curve) deviates strongly from the tail of the - data distribution that represents large fluctuations in production. When applied in Eq. (7) to construct the CQ MB model function as a convolution the result actually fails to represent the MB data. Close examination of Fig. 11 at the terminus reveals that the CQM (red curve) has a much larger slope (smaller fluctuation width) than the data (blue points). The apparent agreement of the MB distributions arises directly from the relation shown in Fig. 1 (right panel) of the present study. The substantial deviations for more-peripheral collisions that may falsify the CQM are not visible in the conventional (and insensitive) semilog plotting format.
Use of a Glauber Monte Carlo to estimate the - as in Fig. III.2 seems problematic. In Sec. V.4 we note that the trend (with ) that describes dijet production in - collisions in terms of small- parton participants is inconsistent with the eikonal approximation which corresponds to . But the Glauber model is based on the eikonal approximation and cannot therefore be used to model - collisions in terms of conjectured CQ participants. The value inferred from a - Glauber simulation is inconsistent with the value obtained in Fig. III.2 by extrapolating the Au-Au trend (where the eikonal approximation and Glauber model are valid) to - collisions for . That is a significant issue because the value is supposed to indicate self-consistency of the CQM as in Sec. VIII-B of Ref. phenix .
VII.3 Arguments from A-A phenomenology
The CQM appears to be relevant because the simulated centrality trend approximates the A-A centrality trends for and , at least for more-central collisions. However, major problems arise for from more-differential analysis. Below the sharp transition near Au-Au spectra and correlations follow a TCM reference (GLS) quantitatively equivalent to that describing - collisions, with replaced by as the SC control parameter and replaced by as a measure of N-N binary collisions anomalous . The number of resolved dijets having correlation structure consistent with in-vacuum pQCD jets increases from 0.04 per event to about 2 per event within the STAR TPC acceptance, scaling with the number of N-N binary collisions as expected for dijets. The same jet correlation structure appears in both number and angular correlations. Substantial deviations from the trend for more-peripheral collisions are already evident in Fig. 1 (right panel). If the CQM is excluded by the dijet presence in - collisions it is excluded in more-peripheral Au-Au: the spectrum HC remains quantitatively related to pQCD dijets.
In more-central collisions above the sharp transition the dijet contribution is altered quantitatively, but the spectrum HC is still described by pQCD modulo a simple modification of FFs that conserves the parton energy and remains consistent with the general form of the DGLAP equations. The same basic correlation structure persists even in central collisions and still scales with , with no actual reduction from the expected dijet number. In central 200 GeV Au-Au collisions we find that 1/3 of the final state is included within resolved dijets jetspec ; anomalous , dramatically inconsistent with the CQM
Reference phenix states that the form of vs is statistically equivalent at 200 GeV and 2.76 TeV (ALICE data) “although the jet cross section increases by a very large factor.” The conclusion is drawn that hadron production must then be dominated by soft processes with no significant dijet contribution. But careful examination of the comparison reveals several issues, as established in App. B.2. The shape of the centrality trend for PHENIX data is substantially distorted by fluctuations for more-central collisions due to the small angular acceptance. The sharp transition at 200 GeV near appears to be significantly lower at 2.76 GeV. When the comparison is made by scaling the ALICE data down by the same factor 2.1 the more-peripheral 2.76 TeV data fall well below the measured 200 GeV NSD - numbers. Thus, a combination of several mitigating factors may conspire in the original comparison to give a false impression. We find that a TCM scaled up by factors 1.8 and 1.82 derived from RHIC energy systematics below 200 GeV predicts the ALICE data trend within rather small data uncertainties. The TCM is actually strongly supported by that comparison.
Reference phenix argues that dijets are strongly suppressed in more-central Au-Au collisions (jet quenching). So a TCM increase in hadron production due to dijets would be inconsistent with jet suppression inferred from data. However, spectrum data presented in Sec. VI.2 reveal that the actual jet-related hadron production integrated over the full acceptance increases with centrality by up to a factor six. The noted suppression at higher is compensated by a much larger enhancement at lower (so as to conserve the parton energy), still within the collimated jet structure hardspec ; fragevo . That conclusion is supported by jet-related angular correlation trends anomalous .
VII.4 Arguments from p-A phenomenology
Several lessons from p-A collision data that appear to support the TCM are drawn in Ref. phenix . A projectile nucleon (participant) interacting with a target nucleus may be excited (wounded) only once and thereafter does not change its internal state in subsequent N-N collisions. Because of time dilation the excited nucleon cannot fragment within the target nucleus. The projectile (p) hemisphere is independent of A, and the target (A) hemisphere depends on , the mean path length of the projectile in the target. The formation-time argument appears to eliminate the possibility for rescattering of secondary partons or hadrons: “This feature [formation time] immediately eliminates the possibility of a cascade in the nucleus from rescattering of the secondary products” phenix .
Certain implications follow for A-A collisions. Absence of rescattering would explain why 3 GeV minijets survive intact without significant loss in central Au-Au collisions anomalous . It would also explain the absence of collective (radial and elliptic) flows indicated by recent observations hardspec ; davidhq ; davidhq2 . Soft hadron production by linearly-independent projectile-nucleon dissociation would then scale as with properties independent of A-A centrality. Dijet production would scale as the number of N-N binary collisions . And the number of dijets per participant nucleon would scale with adopted from the p-A phenomenology. But that is exactly the A-A TCM.
VII.5 Arguments from logical structure
Reference phenix seeks to verify what may be called hypothesis A: Almost all hadron and transverse momentum/energy production in the MR results from soft hadron production following scaling. The paper establishes that A implies certain data trends B: (i) should be approximately constant with Au-Au centrality and (ii) the MB distribution on may be used to generate a model distribution on that should describe MB data. Evidence apparently supporting B is provided and it is concluded that hypothesis A is valid. We note that (i) and (ii) are mathematically equivalent, and results B rely on an approximate relation between and that may be accidental.
The logical structure of such an argument is known to be questionable. Other hypotheses A′ may also imply B, and other results B′ may falsify A. Observation of B̄ would indeed imply Ā, falsification of the hypothesis. But observation of B does not imply or require A, nor does it falsify alternatives A′ (e.g., the TCM). Examples of phenomena B′ that falsify A include the systematics of dijet production in - collisions, agreement with the GLS trend below the ST in Au-Au collisions, strong jet-related correlations for all collision systems, and the central role of HC scaling in all collision systems.
In contrast, the TCM is implied by modern QCD theory combined with the measured properties of hadrons (PDFs from HERA) and dijets (FFs from LEP). The TCM is required by the phenomenology of - and A-A collisions, including differential spectrum and correlation measurements. The TCM is not an empirical description of data (as conventionally represented). It is a quantitative prediction based on QCD theory and data from elementary collisions in the form of the GLS reference. In contrast, the CQM makes no such quantitative predictions and fails to describe data trends for more-peripheral A-A collisions. The CQM assumes no hard scattering, so copious evidence for hard scattering from spectra and correlations appears to falsify the CQM.
VII.6 Summary
With the premise that hadron production in the MR must be controlled by large- degrees of freedom in the LF represented by conjectured constituent quarks, that hadron production from jets must be sharply reduced with increasing A-A centrality as implied by data, and that “possible models motivated by the fact that half of the momentum of a nucleon is carried by gluons when probed at high in hard-scattering are not considered,” the CQM seems to be the only alternative. But the description of high-energy nuclear collisions during the past twenty years has become increasingly reliant on just the small- partons excluded from the CQM. And the improvement in analysis methods applicable to dijet structure since first RHIC operation is substantial.
We do observe that a soft component compatible with projectile nucleon dissociation plays a major role in hadron production complementary to dijet production, but the SC is easily described by a few universal parameters, with form independent of A-A centrality. Without a dijet contribution the CQM must rely on string fragmentation as the sole transport mechanism from LF to MR. The CQ concept and string fragmentation are nonperturbative, and the CQM can thus make no connection to pQCD theory. Direct evidence from several differential methods for copious dijet production in the MR, described quantitatively by pQCD for all A-A centralities, then appears to exclude the CQM. In contrast, the TCM describes a large variety of data at the few-percent level over a broad range of collision energies from SPS to LHC.
VIII Discussion
In this section we consider further aspects of hadron production mechanisms and methods intended to reveal them, including measure sensitivity, model energy dependence, the utility of MB distribution modeling and the role of fluctuations in MB distributions and production centrality trends.
VIII.1 Sensitivity to hadron and production
The question posed in the title of the present paper relates to the sensitivity of certain aspects of data to collision mechanisms. What mechanisms (or models thereof) can be tested by what aspects of the data. The ability to test models relies on the amount of information in the data, which in turn depends strongly on how the data are presented (statistical analysis and plotting format).
The greatest information is carried by multiparticle correlations within narrow multiplicity or centrality bins. Successive integrations (and therefore information loss) lead to two-particle correlations (a limiting case), fluctuations (integrals of correlations), spectra, full MB distributions and yields within centrality bins. The information carried by MB distributions is small compared to that in differential 2D correlations and 1D spectra.
Aside from the inherent information content of the data the choice of plotting format can determine the fraction of such information that is visually accessible. The peripheral centrality region is conventionally disregarded, by the choice of centrality interval for actual measurements (the top 40, 65 or 80% are common choices) and plotting format ( de-emphasizes the peripheral region). In contrast, a per-participant measure plotted vs provides an ideal format for testing the TCM hypothesis.
Use of instead of de-emphasizes the low- region where major jet-related variations with A-A centrality occur. Spectrum ratio nominally measuring jet structure is insensitive to jets below 4 GeV/c because of the spectrum SC which dominates the ratio below that point, whereas TCM analysis of spectra reveals large HC contributions extending down to 0.5 GeV/c or lower. MB distributions plotted in a semilog format on , or convey no significant information visually. The same data plotted in a power-law format over the full centrality range convey all available information, including variation of TCM parameter with centrality and fluctuations for central () A-A collisions and possibly - collisions.
In Ref. phenix the key data plots are Figs. 3, 5, 6, 7 and 16, with 3 and 16 being semilog plots vs . Such data are said to “provide excellent characterization of the nuclear geometry…and are sensitive to the underlying reaction dynamics….” But that claim is not born out by the data. Figs. 5 and 6 on are replotted on as Figs. 2 and 3 of the present paper. (Fig. 7 is effectively an integral of Fig. 6 and as such carries less information.) Whereas the ST is a prominent feature of the centrality dependence of correlations, spectra and integrated hadron yields from Au-Au collisions consistent with the TCM and QCD, there is no evidence for the ST in the data as plotted, no sensitivity to that important new phenomenon. Part of the problem is the large systematic uncertainties, especially for more-peripheral collisions, presumably arising from uncertainty in collision centrality and therefore correct values for or . Thus, although the TCM and CQM strongly disagree in more-peripheral collisions the data presented in Ref. phenix cannot test the model differences.
The composite nature of presents another issue. The integrated within some acceptance can be factored into the integrated hadron multiplicity and mean per hadron denoted by . A similar argument pertains to fluctuations ptfluct . Given the information extracted from distributions we seek unique aspects of production beyond hadron multiplicities. Such information may be carried in per-hadron mean values as shown in Fig. 3. Unfortunately, the large systematic uncertainties preclude effective model tests, especially regarding detailed structure predicted by the TCM and accessed by differential spectrum analysis. One may conclude that in the CQM context there is no new information from measurements beyond hadron multiplicities.
VIII.2 dependence of hadron and production
The energy comparison presented in App. B.2 has interesting implications. The production data at 2.76 TeV are described accurately by a TCM derived from 200 GeV data with two adjustments: The soft component is multiplied by factor 1.8, the hard component by factor . The factor 1.8 is inferred from a trend (with GeV) inferred from RHIC data below 200 GeV and interpreted to represent production of participant small- gluons (soft component) in - or N-N collisions which may then collide as binary pairs to produce dijets (hard component). The result in Fig. 14 (left panel) suggests that modifications to jet formation in Pb-Pb collisions at 2.76 TeV are essentially identical to those in Au-Au collisions at 62.4 and 200 GeV. The only difference may be a shift of the ST to more-peripheral collisions. Substantial FF modifications above the ST observed at RHIC energies apparently remain unchanged.
VIII.3 Utility of MB distribution modeling
Reference phenix models the MB distribution on based on convolution of a model for the distribution from - collisions and a MB distribution on derived from a Glauber simulation. The procedure is described as the Extreme Independent Model. The model is compared to data in Fig. 11 and “excellent agreement” is reported. However, one can question the utility of such a procedure.
Equation (7) of Ref. phenix represents a convolution integral that gives a MB distribution on given conditional distributions on for a given number of collisions and a MB distribution on , with the form
| (12) |
where the are derived by convoluting gamma distributions fitted to - data. In the CQM the implicit assumption is invoked that hadron and production remain the same for all A-A centralities. Only varies.
There is an exact equivalence between a MB frequency distribution on quantity X integrated within some angular acceptance and the centrality variation of the produced X. A running integral of the MB distribution gives vs . Combined with and vs from a Glauber MC as in Eq. (III.2) the running integral gives vs . That procedure is used in App. A.2 to determine the distortion effect of fluctuations at the terminus of the MB distribution on the per-participant production centrality trend, as in Fig. 13 (right panel).
is observed to have approximately the same trend as assuming fixed TCM parameter as in Fig. 1 (right panel). Thus, the MB distribution on is equivalent to that on within a rescaling of the axis. In App. C we obtain a correspondence between MB distributions , where Jacobian GeV is approximately independent of as indicated in Fig. 2 (right panel). The same argument holds for the relation between and , where the Jacobian is . Finally, we have GeV to close the circle.
Thus, the form of the CQM MB distribution on is determined to good approximation by that on and the equivalent on . Any MB distribution within that “family” can be generated from the TCM by the method described in App. A.1. The only difference is the Jacobian factor. The terminus half-maximum values are then related as follows (referring to figures in Ref. phenix ): [Eq. (III.2)], (Fig. 9) (Fig. 11 – upper panel). The comparison between CQM distribution and data in Fig. 11 of Ref. phenix is said to indicate “excellent agreement,” including the matched terminus positions. But the general MB model shape must describe the data as implied by Fig. 1 (right panel), and the endpoints are determined by Jacobians already established elsewhere.
The only unique information in a MB distribution within this family of kinematic quantities, beyond their production trends on centrality, is the slope at the terminus representing fluctuations in central collisions. Close examination of the terminus shapes in Fig. 11 reveals substantial disagreement. The model slope () is much larger than the data, indicating that fluctuations are underestimated. But the CQM assumes the same production mechanisms for - collisions and central Au-Au collisions, whereas the correlation structure in the two cases is very different anomalous , and fluctuations reflect (are integrals of) that correlation structure inverse .
There are substantial differences between the CQM and the TCM (and the data it describes accurately), but those differences (reflected for instance by significant variation of the Jacobians noted above) are concealed by the insensitive semilog format invoked for conventional MB distribution plots. Thus, we can conclude that the Extreme Independent Model of Ref. phenix does not reveal additional information beyond what is accessible from production centrality trends, visually suppresses significant model differences within the semilog plotting format and cannot describe fluctuations in central Au-Au collisions. Its utility is therefore questionable.
VIII.4 The TCM MB distribution in a CQM context
In Sec. IV.4 an argument is presented that the TCM fails to model MB data distributions and should therefore be rejected. However, the TCM implementation is incorrect as demonstrated in this subsection. The general problem relates to the 3D space where is some produced quantity such as and , are parameters modeling A-A geometry. The MB density on may be normalized to the total cross section or to unity. For this discussion we choose the latter and discuss probabilities in terms of .
The 3D space can be projected to three 1D marginal spaces. One marginal space is directly measurable and the other two are approximated by Glauber simulations. The running integrals in those spaces provide parametric relations, e.g. , and . Mean values of the three quantities are parametrically related through common parameter to define a curve or locus of means in the 3D space. Those relations provide the basis for inferred production centrality trends such as shown in Fig. 10 (right panel). We choose one model parameter as the basic degree of freedom for the TCM. We empirically observe simple power-law trends such as as expressed in Eqs. (III.2). Given that framework we consider details of the TCM as manifested in different contexts.
The MB distribution on can be related to the MB distribution on one of the geometry parameters through a Jacobian derived from the parametric relations, as in Eq. (18). That representation is advantageous because of the simple power-law structures on and and the TCM formulation of the parametric relations as in Eq. (11). The result is the correct form of the TCM for the MB distribution on as described in App. A, with direct comparisons to data. We find that the TCM accurately describes all the experimentally accessible features of MB data distributions to their uncertainty limits.
The conjectured relations in Eq. (IV.4) represent an alternative implementation of the TCM for MB distributions. Dividing both sides by we obtain probability densities with some interesting features. First, the density in one marginal space is related to a sum of densities in two other marginal spaces. In terms of probabilities that implies a dichotomy: In each event either participants or binary collisions are related to . Second, the Jacobians relating to and are both assumed to be equal to fixed value . Neither aspect seems plausible. We conclude that Eq. (IV.4) is an improper implementation of the TCM for MB distributions, and TCM comparisons with MB data as in Ref. phenix are misleading.
VIII.5 Multiplicity and fluctuations
Fluctuations in , and other kinematic quantities may convey some information about collision mechanisms. In general, fluctuations represent correlation structure integrated over some angular acceptance inverse . Thus, direct study of correlations is preferred. However, in case of sparse data (rare particles, low event numbers) an integral fluctuation measure may be the only option.
Fluctuations can be measured by specific statistics (e.g., cumulants) or by parametrized model functions fitted to frequency distributions. The negative-binomial distribution (NBD) describes distributions on discrete variables such as whereas the gamma distribution describes distributions on continuous variables such as . In either case the limiting form is the Poisson distribution (describing uncorrelated samples).
The NBD has two parameters and that are related to a variance (cumulant) by
| (13) |
In the limit the NBD goes to a Poisson distribution. The NBD is a generic model for fluctuations from any correlated discrete system that may include complex correlation structures (e.g., from dijets) hidden by the integral measure but accessible through other more-differential methods. The expression on the right represents the leading terms in a power series representing more-complex frequency distributions (e.g., excess events in the distribution tail, higher-order cumulants).
Multiplicity fluctuations are generally biased by fluctuations in the A-A collision geometry (width of a centrality bin) that cannot be fully controlled by an external parameter. However, fluctuations for central () collisions can be estimated from the slope of the terminus of the MB distribution plotted in the power-law format.
In the case of large fluctuation amplitudes the gamma and NBD models may fail to describe data distributions even approximately. For instance, in Fig. 10 of Ref. phenix the p-p MB distribution on (points) deviates strongly from the gamma model function (solid curves) in the tail region, presumably due to large fluctuations from small- gluons. For that reason among others the Au-Au CQM in Fig. 11 fails to describe the terminus (the slope is much too large). Further discussion appears in App. A.2.
IX Summary
Based on comparisons of Monte Carlo simulations for the number of constituent-quark participants with the measured centrality trends of integrated multiplicity and transverse energy it is argued that the two-component (soft+hard) model (TCM) of mid-rapidity production, including a substantial dijet contribution, is actually a proxy for a constituent-quark (CQ) model (CQM) in which dijets play no significant role. Further support for the CQM is derived from comparison of an Extreme Independent Model of minimum-bias (MB) distributions based on with MB data and comparisons of RHIC and LHC production trends that seem very similar despite the large energy difference. Hadron and production near mid-rapidity is seen as arising from fragmentation of QCD color strings joining CQs residing at large momentum fraction within projectile nucleons.
In the present study we confront arguments supporting the CQM with contrasting differential evidence from yields, spectra and correlations that provide strong support for the TCM and the major role played by dijets in - and A-A collisions near mid-rapidity. The TCM relates directly to pQCD predictions and provides detailed quantitative descriptions of a broad range of phenomena in correlations, spectra, yields and MB distributions.
Differential spectrum and correlation measurements from 200 GeV - collisions reveal a dijet contribution quantitatively consistent with pQCD predictions based on measured jet spectra and fragmentation functions, the production depending on the number of small- partons (mainly gluons) represented by a soft multiplicity component . The dijet rate (hard component) is proportional to representing parton-parton binary collisions and indicating that the eikonal approximation is not valid for - collisions. Fluctuations in the soft multiplicity over a ten-fold range correspond to variations in the dijet rate over a hundred-fold range, including multiple dijets per collision at the upper end. The - phenomenology provides the reference for a TCM in A-A collisions representing Glauber linear superposition of N-N collisions (GLS).
In A-A collisions the role of soft multiplicity is assumed by participant-nucleon number , and N-N binary collisions are represented by with ratio replaced by . The A-A TCM based on those parameters is observed to follow the GLS reference over half the Au-Au total cross section for 62.4 and 200 GeV collisions, with dijet structure as in - collisions. In more-central Au-Au collisions, above a sharp transition in the hard-component centrality trend, the dijet structure is observed to change quantitatively but remains consistent with a slightly-modified pQCD description. Although some dijet properties change the number of dijets remains proportional to . No dijets are lost.
The measured energy dependence of the TCM for Au-Au collisions below 200 GeV can be used to predict data trends at LHC energies. The hadron production vs centrality for Pb-Pb at 2.76 TeV is described within small data uncertainties by the extrapolated TCM.
In contrast the CQM is excluded by data in several ways. The - multiplicity dependence of spectrum and correlation structure, which clearly requires a dijet contribution, cannot be described by the soft-only CQM. Careful comparison of with integrated Au-Au centrality trends for more-peripheral collisions reveals substantial discrepancies (factor six difference in slopes below the sharp transition). The detailed evolution of Au-Au spectrum structure and angular correlations cannot be explained by a homogeneous model of soft production. The exact correspondence of jet-related correlated pair number and spectrum integrals based on a pQCD dijet frequency is also incompatible with the CQM.
A conjectured algebraic relation between the TCM and MB distributions invoked to reject that model is found to be invalid. The correct algebraic relation between the TCM for production centrality trends and MB distributions is established in the present study. The TCM description of MB data is accurate and provides new insights into detailed structure, including consequences of production fluctuations in central A-A collisions. In contrast, the Extreme Independent Model relating the CQM to MB distributions is shown to be misleading. The apparent agreement with data results from the insensitivity of the conventional semilog plotting format. The only real model test is the role of fluctuations in central collisions (shape of MB tail structure), which the CQM fails.
Can MB distributions on and test hadron production models? The answer is yes provided several conditions are met: (i) The MB plotting format must make all information visually accessible, (ii) distortions from production fluctuations in more-central collisions must be understood, (iii) systematic uncertainties relating to centrality determination in more-peripheral collisions must be controlled, (iv) a proper linear-superposition reference extrapolated from - collisions must be established and (v) a mathematically correct TCM model of MB distributions must be defined to extract quantitative data.
That being said, analysis of MB distributions however accurate must compete with more-differential methods (spectra and correlations) that provide much more information about collision dynamics. Collision models have already been rigorously tested by a combination of highly-differential spectrum and correlation analysis. The TCM prevails as a general framework within which model details can be evaluated, and dijet production is an essential feature of any model of nuclear collisions.
We conclude that the TCM is not a misleading proxy for a more-legitimate soft model based on constituent quarks. Instead, the CQM is a proxy based on a single accidental relation and is falsified by a complex of differential analysis results described accurately by a TCM consistent with the pQCD description of dijets.
This work was supported in part by the Office of Science of the U.S. DOE under grant DE-FG03-97ER41020.
Appendix A TCM and MB distributions
Figures 17-19 of Ref. phenix show conjectures about a relation between the TCM and MB data distributions. The figures show comparisons between MB data distributions on and the extreme cases of pure participant or N-N binary-collision scaling (Figs. 17 and 18) as discussed in Sec. IV.4. Since both hypotheses fail to describe the data the TCM is rejected. But the descriptions fail not from problems with the TCM but from misapplication of the TCM to MB distributions as discussed in Sec. VIII.4. In this Appendix we derived the correct relation between the TCM and MB distributions on and .
A.1 The TCM and MB distribution structure
Since in Fig. 3 (right panel) is nearly constant with centrality the power-law treatment of MB distributions on in Ref. powerlaw is a good approximation to the present case on . We assume some acceptance with integrated total charge . Reference powerlaw notes that the MB distribution on is almost exactly a power law and is therefore approximately constant on within some bounded interval (rectangular). The structure of the measured MB distribution on (deviations from the rectangular participant-scaling distribution) may directly reveal three aspects of hadron production: (a) fluctuations in - collisions, (b) fluctuations in central A-A collisions and (c) the parameter in the TCM, measured respectively by the slopes on the left and right ends and in the central part of the MB distribution.
The data MB distribution can be predicted quantitatively from the TCM in the following way. We assume the usual TCM expression for the charge yield , where is the charge yield for - (N-N) collisions. Then invoking Eq. (18) with power-law variables we obtain
| (14) |
where the first factor is a Jacobian that can be derived from the basic TCM yield expression and the second factor is the rectangular MB distribution representing participant scaling. The MB distribution on is then
where we have invoked the approximation powerlaw . If is constant for all centralities the first factor (inverse Jacobian) is approximately a straight line on with negative slope () reflecting some fractional contribution to from N-N binary-collision scaling. The inferred from differential spectrum data increases by a factor six from peripheral () to central () Au-Au collisions ppprd ; hardspec ; anomalous ; jetspec . The slope of the first factor then varies accordingly. Note that in Eq. (A5) of Ref. powerlaw the quantity should be as in Eq. (A.1).

Figure 11 (left panel) shows MB distributions on for (a) participant scaling (dotted lines, ) and (b) the TCM describing more-central 200 GeV Au-Au collisions (dashed lines, fixed for all centralities). Both distributions integrate to the Au-Au total cross section 7.2 barns. The sloping dashed line represents Eq. (A.1). In that plotting format the relation of distribution (b) to collision geometry and production mechanisms is easy to demonstrate (as discussed below). Figure 11 (right panel) shows the same distributions in the conventional semilog plotting format, with Jacobian factor . Connections to the underlying particle production mechanisms and collision geometry are not visually accessible. The straightforward TCM implementation in Eq. (A.1) and Fig. 11 is dramatically different from the conjectures in Figs. 17-19 of Ref. phenix .
Figure 12 (left panel) shows a comparison between STAR 130 GeV data (solid curve hminus ) and the corresponding TCM of Eq. (A.1) (dashed curve) with constant and (approximate density near for 130 GeV). The dotted curve represents participant scaling. A similar comparison appears in Fig. 3 of Ref. powerlaw . This semilog plotting format obscures essential data features relating to the TCM.

Figure 12 (right panel) shows the same distributions in the power-law format. The dotted lines represent participant scaling and the dashed lines (for more-central collisions) represent Eq. (A.1) with . Each distribution integrates to barns. The model curves extend over the full fractional centrality interval . The MB data and TCM agree to a few percent, well within systematic uncertainties. The TCM depends only on parameters and and otherwise was not fitted to the MB data. The right-hand dash-dotted line in the right panel is a good approximation to the tail structure in the left panel when transformed to that semilog format (dash-dotted curve).
The power-law format provides a precise estimate of the end-point multiplicity as the half-max point on the terminus (steeply falling part) of the MB distribution at the right end. That quantity is not accessible with the conventional semilog plotting format. For these data the endpoint lies at . From the corresponding Au-Au participant endpoint we obtain . Given for 130 GeV NSD - collisions we obtain at , implying . Thus, the terminus endpoint position accurately corresponds to TCM parameter and the slope of the dashed curve described by Eq. (A.1), at least for more-central collisions.
Also included in the right panel is a schematic model of the ST observed at 62.4 and 200 GeV. The dashed curve for more-peripheral collisions follows the GLS trend described by Eq. (A.1) with . Extrapolated to central collisions the endpoint in that case would be or . Near the ST at mid-centrality parameter increases from 0.02 to 0.08 (short vertical line), with endpoint as noted.
From these comparisons we find that one learns little from MB distributions in the conventional semilog plotting format but a substantial amount from data in the power-law format. Relative to the power-law Glauber model one can estimate - fluctuations, central A-A fluctuations and centrality evolution of TCM parameter . The consequence of dijet production in A-A collisions (TCM hard component) is redistribution of the A-A cross section to larger integrated yields according to Eq. (A.1).
A.2 Production fluctuations in central collisions
Fluctuations in particle and / production produce a distortion of MB distributions. Differences in detector angular acceptances can lead to corresponding differences in MB distributions. The terminus slope in the power-law format (e.g. Fig. 12, right-hand dash-dotted line) represents production fluctuations in central collisions (). The terminus slope is proportional to measuring charge multiplicity fluctuations (the variance depends on the angular acceptance). The mean slope of the right-hand terminus is , and the Gaussian r.m.s. on is . The corresponding fluctuation manifestation on is estimated by the dash-dotted curve in the left panel, with relative r.m.s. on or 8% for charge-number correlations within acceptance . Production fluctuations in - collisions from the terminus sketched by the left dash-dotted line aren’t accessible because these MB data do not extend low enough on .
The terminus fluctuation structure in the MB distribution has major consequences for plots of production vs centrality. We can determine fluctuation effects in the latter using the exact correspondence between a power-law MB distribution and the corresponding plot of production on centrality.
Figure 13 (left panel) shows the TCM model for 200 GeV Au-Au collisions (dash-dotted lines) with . The dotted curve represents that curve folded with a Gaussian (approximated by an error function) having a fluctuation width corresponding to the STAR TPC acceptance (see Fig. 12 – right panel). For the PHENIX EMCal acceptance the corresponding width is three times larger (solid curve). We transform MB fluctuation models to production centrality trends as follows. The running integral of a curve in the left panel yields vs . We divide by and convert to using Eqs. (III.2) to obtain the required production centrality dependence vs .

Figure 13 (right panel) shows the integration results as the solid and dotted curves plotted above . The solid curve below represents the ST trend as derived from jet-related angular correlations and shown in Fig. 10 (right panel). Corresponding PHENIX and “RHIC average” production data are plotted as open squares and open triangles respectively phenixnch compared to STAR spectrum integrals (solid dots) hardspec . This exercise demonstrates that the ten-times smaller PHENIX EMCal angular acceptance results in a substantial fluctuation distortion or bias for more-central collisions, equivalent to about 18% relative fluctuations compared to 6% for STAR within . The consequence for STAR data is a single most-central point falling slightly above the fixed- TCM dash-dotted line.
Comparing the right panels of Figs. 12 and 13 we observe that a MB distribution on produced quantity is more differential than the production centrality trend, but also includes substantial statistical noise. The running integral leading to the production centrality trend does filter the noise to better reveal the information. But the same noise reduction may be accomplished by rebinning the MB distribution (uniform bins in the power-law format). Both formats convey the same information.
Appendix B TCM vs Collision energy
Reference phenix presents arguments that the TCM, including its hard component representing dijet production, is actually a proxy for soft production scaling with the number of constituent-quark participants. LHC hadron production data alice are invoked to argue that the centrality trend for hadron production from 200 GeV Au-Au is essentially the same as that from 2.76 TeV Pb-Pb collisions, although “the jet cross section increases by a large factor.” Thus, hadron production at both energies must be dominated by soft processes with negligible dijet contribution. However, the detailed structure of the data trends and the predicted energy evolution of the TCM actually support the TCM interpretation.
B.1 Predicting the energy evolution of the TCM
Two features of 2D angular correlations at RHIC have been observed to scale with collision energy as . For the nonjet quadrupole GeV davidhq . For dijet production per final-state hadron in correlations GeV ptedep . A jet-production lower bound near GeV is consistent with the observed jet-energy lower bound 2 - 3 GeV for parton fragmentation to charged hadrons fragevo . For jet-related number correlations we observe that predicts factor 1.6 in Fig. 8 (left panel) relating dijet production per hadron in Au-Au collisions at 200 vs 62.4 GeV anomalous and predicts factor 2.2 relating equivalent dijet structure in - collisions at 200 GeV vs 7 TeV cmsridge . The corresponding factor relating 200 GeV to 2.76 TeV is 1.8.
Hadron production in - collisions inferred from spectrum dependence is described in Sec. V.4: (a) small- gluons estimated by soft yield provide the common underlying degree of freedom in high-energy N-N collisions, and (b) the dijet production trend is indicated by hard yield . If the relative density of small- gluons produced at a given N-N collision energy scales proportional to and then observed dijet energy trends are explained quantitatively.
The TCM centrality trend for 200 GeV Au-Au collisions is defined by with GLS below the ST and modified-FF 0.095 above the ST. According to the above argument the TCM for 2.76 TeV is predicted by scaling up the soft component (increased small- gluons) by factor 1.8 and the hard component relative to the soft component by another factor 1.8. The absolute increase in dijet production should then be factor (increased collisions of small- gluons).
B.2 Charged-hadron production at two energies
Figure 14 (left panel) shows per-participant-pair charge production data from 2.76 TeV Pb-Pb collisions (inverted solid triangles) and - collisions (upright solid triangle) alice . To accommodate the 6% larger atomic number of lead the path length is scaled up by 2% since is a good approximation. The TCM limiting cases are defined as described above by with (dashed line) and (dash-dotted line). The solid curve is the 200 GeV centrality trend inferred from jet-related correlations (reflecting the ST) scaled up in the same way. Given the relation to data the 2.76 GeV hadron production data are predicted by a TCM based on the energy dependence of soft and hard production below 200 GeV. The TCM was not adjusted to accommodate the 2.76 TeV data.

Figure 14 (right panel) shows the “RHIC average” hadron production data appearing in Fig. 13 (open triangles, reported in Ref. phenixnch ) compared to the 200 GeV TCM. The inverted solid triangles are the 2.76 TeV data in the left panel scaled down by factor 2.1. The apparent similarity has been invoked to support the conclusion that particle production follows the same general trend at two very different energies and therefore must be due exclusively to a soft process, inconsistent with the TCM phenix . In that comparison the 200 GeV data were actually scaled up by factor 2.1 to match the 2.76 TeV data, but this reversed-scaling comparison is equivalent.
The claimed similarity of data trends at two different energies is interpreted to imply a common soft hadron-production mechanism with no significant dijets from hard processes, but the comparison is misleading. The scaled 2.76 TeV data actually strongly disagree with the 200 GeV production data from Ref. hardspec (dotted curve) and the 200 GeV TCM in several ways: (i) The average slope of the scaled higher-energy data (solid line) is times larger than the STAR 200 GeV data trend and TCM (dash-dotted line). The difference greatly exceeds what is allowed by various systematic uncertainties. (ii) The apparent agreement for more-central data results from the substantial fluctuation bias in the PHENIX data, whereas that bias is small for the ALICE acceptance. The unbiased limiting case is the TCM dash-dotted line. (iii) The downscaled data for peripheral 2.76 TeV Pb-Pb and - collisions fall a factor 1.8/2.1 = 0.86 below the 200 GeV NSD value 2.5 and inferred , again well beyond data uncertainties. In contrast, the 200 GeV TCM scaled appropriately for small- parton participants and parton-parton binary collisions predicts a TCM in the left panel that describes the 2.76 TeV data within their uncertainties. Thus, the recent LHC data strongly favor a TCM based on small- parton energy dependence extrapolated from RHIC data trends.
B.3 Possible energy evolution of the sharp transition
The sharp transition first observed for minimum-bias jet-related angular correlations in Au-Au collisions and indicated by the hatched box ST in Fig. 14 (right panel) anomalous is a remarkable new feature of hadron production systematics. Below the ST hadron production (spectra and correlations) follows the GLS reference extrapolated from - collisions. Above the ST hadron production within the hard component increases dramatically, the increase attributed mainly to modified parton fragmentation fragevo . While fragment yields are suppressed at larger as indicated by ratio they are much more enhanced at lower (the increase concealed by the properties of ) but remain within the correlated jet structure and conserve the parton energy hardspec ; jetspec . The result is an increase in hadron fragments within intact jets of up to a factor 6 and no reduction in dijet number fragevo .
It could be argued that the most significant information in Fig. 14 (left panel) is the possible migration of the ST downward in centrality with increasing collision energy. In Fig. 10 (left panel) the ST at 200 GeV (right hatched box) corresponds to a dijet density per Au-Au collision (solid curve) of approximately unity. The dashed curve is the solid curve scaled up by factor corresponding to the predicted absolute increase in dijet yield from 200 GeV to 2.76 TeV. The left hatched box indicates the centrality for the same dijet density per Au-Au collision given the increased dijet rate per N-N collision. Comparing the two panels of Fig. 14 we find that the 2.76 TeV data are consistent with a shift in the ST downward from to consistent with the exercise in Fig. 10. That correspondence suggests that the ST and modified parton fragmentation may be determined by the dijet density within A-A collisions.
Appendix C Joint MB distributions
MB distributions such as Fig. 2 of Ref. phenix are related to a system of joint, conditional and marginal distributions of cross-section or event-number density on some measured kinematic quantity (e.g. or ) and one or more possible A-A model parameters derived from the 3D space by projection. The 3D density distribution is typically tightly correlated (localized) as expressed by a locus of mean values realized for instance by Eq. (10) for , and . Projections onto subspaces and running integrals within subspaces are used to determine the locus of mean values and detailed features of projected MB distributions.
It is useful to establish an algebraic context for such projections, for example based on the integrated within some angular acceptance vs a model parameter such as or . The 2D joint MB distribution may be normalized to unity (joint probability distribution) or to A-A total cross section . Applying the chain rule for joint probabilities we obtain
where for instance is the unit-normal conditional probability density distribution on given a specific condition, and is the marginal projection of 2D onto with
| (17) |
Equation (17) describes Fig. 2 of Ref. phenix where represents the individual lower curves and is the upper solid curve. In Eq. (7) of Ref. phenix and . For generality we treat as a density on continuous which could be a sum of delta functions at integer values.
Each conditional distribution is a density on peaked near some conditional mean value . On the other hand, for a given the ensemble of can be seen as a distribution on peaked near some mean value . The conditional distribution in the argument of the integral in Eq. (17) can be converted to a density on with a suitable Jacobian . Treating as a weight function on the integral in Eq. (17) can be interpreted as a weighted average of at given approximated by that ratio evaluated at . With we then obtain
| (18) |
where the Jacobian is a variable quantity derived from the locus (curve) of mean values . Analysis of MB distributions indicates that in cases relevant to A-A collision geometry the details of conditional distributions , other than the conditional mean values , are not relevant except at the ends (termini) of the distribution powerlaw .
References
- (1) S. S. Adler et al. (PHENIX Collaboration), arXiv:1312.667.
- (2) S. Eremin and S. Voloshin, Phys. Rev. C 67, 064905 (2003).
- (3) J. Adams et al. (STAR Collaboration), Phys. Rev. D 74, 032006 (2006).
- (4) R. J. Porter and T. A. Trainor (STAR Collaboration), J. Phys. Conf. Ser. 27, 98 (2005).
- (5) R. J. Porter and T. A. Trainor (STAR Collaboration), PoS CFRNC2006, 004 (2006).
- (6) C. Albajar et al. (UA1 Collaboration), Nucl. Phys. B 309, 405 (1988).
- (7) D. Buskulic et al. (ALEPH Collaboration), Z. Phys. C 55, 209 (1992).
- (8) M. Z. Akrawy et al. (OPAL Collaboration) Phys. Lett. B, 247, 617 (1990).
- (9) N. Borghini and U. A. Wiedemann, hep-ph/0506218.
- (10) B. B. Back et al. (PHOBOS Collaboration), Phys. Rev. C 65, 061901 (2002).
- (11) T. A. Trainor, Phys. Rev. C 80, 044901 (2009).
- (12) D. Kharzeev and M. Nardi, Phys. Lett. B 507, 121 (2001).
- (13) T. A. Trainor, Int. J. Mod. Phys. E 17, 1499 (2008).
- (14) R. C. Hwa and M. S. Zahir, Phys. Rev. D 23, 2539 (1981).
- (15) G. Agakishiev, et al. (STAR Collaboration), Phys. Rev. C 86, 064902 (2012).
- (16) J. Adams et al. (STAR Collaboration), Phys. Rev. C 73, 064907 (2006).
- (17) T. A. Trainor, R. J. Porter and D. J. Prindle, J. Phys. G 31, 809 (2005).
- (18) D. T. Kettler (STAR collaboration), Eur. Phys. J. C 62, 175 (2009).
- (19) D. Kettler ( STAR Collaboration), J. Phys. Conf. Ser. 270, 012058 (2011).
- (20) J. Adams et al. (STAR Collaboration), Phys. Rev. C 71, 064906 (2005).
- (21) J. Adams et al. (STAR Collaboration), J. Phys. G 32, L37 (2006).
- (22) J. Adams et al. (STAR Collaboration), J. Phys. G 33, 451 (2007).
- (23) T. A. Trainor and D. J. Prindle, hep-ph/0411217.
- (24) T. A. Trainor and D. T. Kettler, Phys. Rev. D 74, 034012 (2006).
- (25) X.-N. Wang, Phys. Rev. D 46, R1900 (1992); X.-N. Wang and M. Gyulassy, Phys. Rev. D 44, 3501 (1991).
- (26) T. Sjöstrand and M. van Zijl, Phys. Rev. D 36, 2019 (1987); T. Sjöstrand, Comput. Phys. Commun. 82, 74 (1994); T. Sjöstrand, L. Lönnblad, S. Mrenna and P. Skands, hep-ph/0308153.
- (27) M. Bahr, S. Gieseke, M. A. Gigg, D. Grellscheid, K. Hamilton, O. Latunde-Dada, S. Platzer and P. Richardson et al., Eur. Phys. J. C 58, 639 (2008).
- (28) E. W. Oldag (STAR Collaboration), J. Phys. Conf. Ser. 446, 012023 (2013).
- (29) J. Adams et al. (STAR Collaboration), Phys. Lett. B 634, 347 (2006).
- (30) T. A. Trainor and D. T. Kettler, Phys. Rev. C 83, 034903 (2011).
- (31) T. A. Trainor, Phys. Rev. D 87, 054005 (2013).
- (32) Ya. I. Azimov, Yu. L. Dokshitzer, V. A. Khoze, S. I. Troyan, Z. Phys. C 27, 65 (1985), Z. Phys. C 31, 213 (1986).
- (33) Q. J. Liu, D. J. Prindle and T. A. Trainor, Phys. Lett. B 632, 197 (2006).
- (34) T. A. Trainor, J. Phys. G 39, 095102 (2012).
- (35) B. Andersson, Camb. Monogr. Part. Phys. Nucl. Phys. Cosmol. 7, 1 (1997).
- (36) C. Adler et al. (STAR Collaboration), Phys. Rev. Lett. 87, 112303 (2001).
- (37) S. S. Adler et al. (PHENIX Collaboration), Phys. Rev. C 71, 034908 (2005), [Erratum-ibid. C 71, 049901 (2005)].
- (38) K. Aamodt et al. (ALICE Collaboration), Phys. Rev. Lett. 106, 032301 (2011).
- (39) T. A. Trainor and D. T. Kettler, Phys. Rev. C 84, 024910 (2011).