Thermoelectric properties of marcasite and pyrite FeX2(X=Se,Te): A first principle study
Abstract
Electronic structure and thermoelectric properties of marcasite (m) and synthetic pyrite (p) phases of FeX2 (X=Se,Te) have been investigated using first principles density functional theory and Boltzmann transport equation. The plane wave pseudopotential approximation was used to study the structural properties and full-potential linear augmented plane wave method was used to obtain the electronic structure and thermoelectric properties (thermopower and power factor scaled by relaxation time). From total energy calculations we find that m-FeSe2 and m-FeTe2 are stable at ambient conditions and no structural transition from marcasite to pyrite is seen under the application of hydrostatic pressure. The calculated ground state structural properties agree quite well with available experiments. From the calculated thermoelectric properties, we find that both m and p forms are good candidates for thermoelectric applications. However, hole doped m-FeSe2 appears to be the best among all the four systems.
I Introduction
The performance of a thermoelectric (TE) material depends on the dimensionless figure of merit, ZT, given by , where S, , T and are the Seebeck coefficient, electrical conductivity, absolute temperature and the thermal conductivity (which includes both electronic and lattice contribution , i.e. ) respectively, the efficiency of a thermoelectric device increasing with ZT. The best of the commonly available TE materials have a value of ZT to be of the order of unity.Bi2Te3 From the above expression for ZT, it is evident that finding materials with high ZT (more than unity) still remains an open challenge, as it needs to satisfy the conflicting requirement of high thermopower like an insulator and behave as a good conductor like a metal. Also it implies the need for materials with good electrical conductivity and poor thermal conductivity resulting in weak electron scattering and strong phonon scattering. In last few years efforts have been made for identifying strategies to improve the value of the ZT. Several reports have been published by different research groups with focus on band structure engineering to enhance S and and usage of nanostructure technology for reducing the lattice thermal conductivity. Recently, Xun Shi et al,Shi reported that the multiple-filled skutterudites show an improved figure of merit of 1.7 at 850 K, which is the highest value reported in skutterudites. Biswas et al.,Biswas reported that PbTe-SrTe doped with Na shows a ZT of 2.2 at 923 K due to the hierarchical structure which maximises the phonon scattering.
There are well known constraints in developing good TE materials, like toxicity and scarcity of the elements which prevent the usage of above materials in large scale industrial application. Nevertheless, the search for such new TE materials still continues despite the above mentioned restrictions. Recently, the natural minerals of the tetrahedrite (Cu12-xMxSb4S13) and tennantite (Cu12-xMxAs4S13), where M is a transition metal element such as Zn, Fe, Mn, or Ni, have shown potential thermoelectric application due to their intrinsic low lattice thermal conductivity.Slack ; Xlu_1 ; Xlu_2 Such studies have motivated us to explore thermoelectric properties of other family of minerals such as FeSe2 and FeTe2. The reason behind selecting the transition metal chalcogenides family is due to their excellent optical and magnetic properties,CNR and the potential for widespread applications. Recently, the polymorphic phases of FeSe2 have been shown to be good for solar cell absorber application.Ganga Several experimental reports are available attempting to understand the electrical resistivity, Hall coefficient and thermoelectric power of these compounds. The electrical resistivity and Hall coefficient of FeSe2 have been measured in sintered poly-crystals.Fischer ; Dudkin ; Hulliger Dudkin et. al., have measured the electronic resistivity of FeTe2. The same authors have also reported the thermoelectric properties of FeSe2 and FeTe2, measured at ambient temperature and the high temperature results have been reported by Harada.Harada The thermoelectric properties of pyrite-type FeSe2 and FeTe2 prepared at high pressure of 65 kbar was given by Bither et. al.TAB There are no theoretical studies on these compounds to understand thermoelectric properties.
In this work, we present a detailed theoretical study of electronic structure and thermoelectric properties of both the marcasite and pyrite phases of FeX2(X=Se,Te), for which the available experimental data are indicative of good TE potential, which however is not realized so far. The paper is organized as follows: in section II we describe the method used for the calculations and section III presents the results and discussion, followed by conclusion in section IV.
II Methodology
All the total energy calculations based on first principle density functional theory (DFT) were performed using pseudopotential method as implemented in the Plane wave self-consistent field (Pwscf) program Pwscf and full-potential linear augmented plane wave (FP-LAPW) method as implemented in the WIEN2k.Blaha The Pwscf method is used to perform the structural optimization, whereas FP-LAPW method is used to study the electronic and transport properties. The total energies are obtained by solving the Kohn-Sham equations self consistently within the Generalized Gradient Approximation (GGA) of Perdew-Burke-Ernzerhof (PBE).Perdew A plane wave kinetic energy cut off of 50 Ry is used and the first Brillouin zone in the reciprocal space is sampled according to the Monkhorst-Pack scheme Monkhorst by means of a 8x8x8 k-mesh in order to ensure that the calculations are well converged. The electron-ion interactions are described by Vanderbilt type ultrasoft pseudo potentials Vanderbilt and the following basis sets Fe: 3s2 3p6 3d6 4s2, Se: 4s2 4p4 and Te: 5s2 5p4 are used as valence states. Variable-cell structural optimisation has been performed by using BFGS (Broyden-Fletcher-Goldfarb-Shanno) conjugate gradient algorithm as implemented in Pwscf. To determine the ground state structure of FeSe2 and FeTe2 and possible phase transformation, we have calculated the total energy with applied hydrostatic pressure for both marcasite and pyrite crystal structures ranging from -8 GPa (expansion) to 8 GPa (compression) with a step size of 1 GPa. The threshold criteria of 1 Ry for total energies, 1 Ry/bohr for total forces and 0.002 GPa for total stress were used for structural relaxation at each pressure.
To study the electronic properties, we have used FP-LAPW method as implemented in the WIEN2k code. As it is well known, the first principles calculations often underestimate the band gap within the standard local scheme of the exchange-correlation functional (LDA or GGA) and they also fail to describe accurately the localised electrons in d or f states, in transition metal and rare earth compounds.Nieminen In order to overcome these drawbacks of the standard exchange methods, we have used the Generalized Gradient Approximation (GGA) along with the onsite Coulomb repulsion U (GGA+U). Here we have used 1000 k-points for calculating the electronic structures of both marcasite and pyrite forms. All our calculations are performed using the optimized parameters from the Pwscf calculation with an energy convergence up to 10-6 Ry per unit cell between the successive iterations. Further we have calculated the properties like thermopower (S), electrical conductivity () using BOLTZTRAPMadsen code with as many as 100 000 k-points, within the Rigid Band Approximation (RBA)Scheidemantel ; Jodin ; Chaput and the constant scattering time () approximation (CSTA). According to the RBA approximation, doping a system does not alter its band structure but varies only the chemical potential, and it is a good approximation for doped semiconductors to calculate the transport properties theoretically when doping level is not very high.Jodin ; Chaput ; Bilc ; Ziman ; Nag However certain types of dopant can drastically modify the nature of electronic structure near the gap giving rise to resonant statesBilc_04 ; Ahmad in which case the RBA can fail.MSlee According to CSTA, the scattering time of the electron is taken to be independent of energy and depends only on concentration and temperature. The detailed explanation about the CSTA is given in Ref. singh, ; aggate2, ; Khuong, and the references cited therein. It is evident that CSTA has been quite successful in the past in predicting the thermoelectric properties of many materials.DJS ; Parker ; Georg ; Khuong ; Lijun
III Results and discussion
III.1 Ground state properties
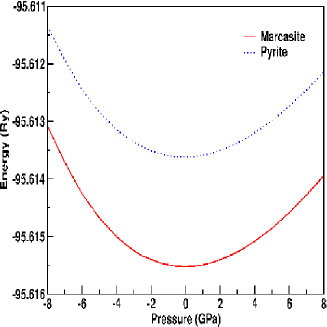
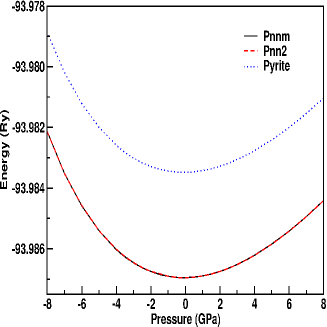
FeSe2 and FeTe2 crystallize in both the marcasite and the pyrite structures.Bither The marcasite form of both the compounds are available in nature whereas pyrite structure is a synthetic mineral. The atomic arrangements of the marcasite phase can be considered within either of the two space groups Pnn2 or Pnnm. However, we did not find any significant energy difference between these two arrangements (see Fig. 1(b) for FeTe2).Gunnar In general, most marcasite type minerals are available in the space group Pnnm, and hence we have used this space group for detailed electronic structure calculations for both the compounds. In order to verify their structural relation between the marcasite and pyrite we have calculated the total energy under the application of the hydrostatic pressure from -8 to 8 GPa. The total energy variation with the pressure for both the compounds is shown in Fig. 1(a) and (b). We find an energy difference of 1.9 mRy/unit cell between the marcasite and pyrite structures of FeSe2, whereas we found the energy difference between the marcasite and pyrite phases of FeTe2 to be 3.5 mRy/unitcell (see Fig. 1b). The optimized structural parameters are shown in Table-I along with available experimental results. The agreement between theory and experiment is quite good.
III.2 Band structure and Density of states
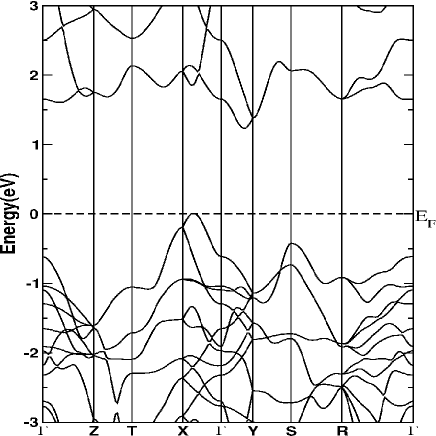
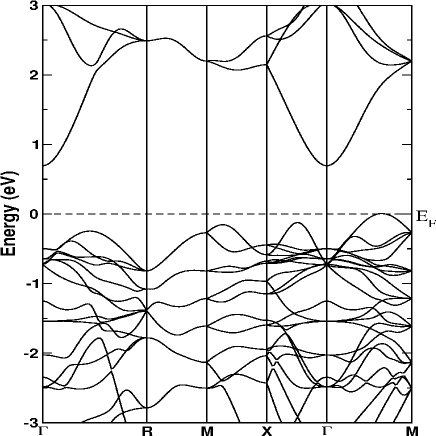
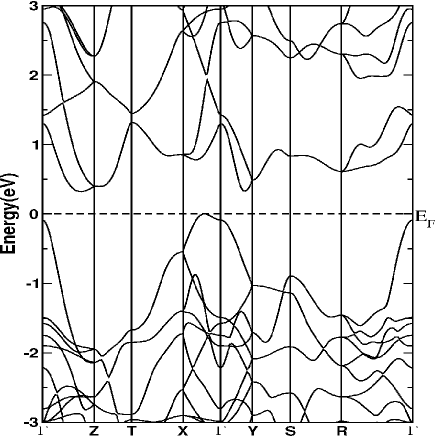
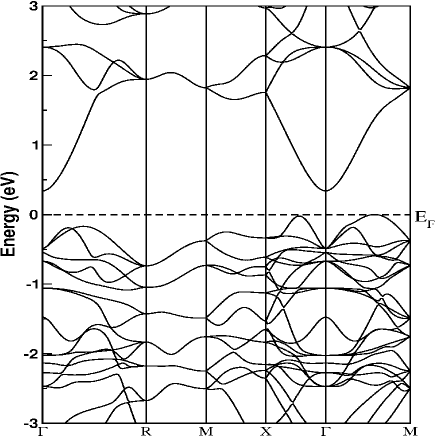
The electronic properties of FeX2 (X=Se,Te) are calculated using the optimized parameters obtained from the Pwscf calculations. Since LDA/GGA underestimate the band gaps in semiconductors and insulators, and as the studied compounds have partially filled Fe d-levels, we used GGA+U method and adjusted U to get a reasonable value of the band gap. In our calculations we have used a value of UFe = 0.52 Ry (7.07 eV) for the Fe d electrons in both the structures and both the compounds. This value of U is slightly on the higher side compared to values used in the literature (3-5 eV) for metals and semiconductors. The calculated band structures along high symmetry directions in the Brillouin zone for both the compounds and both marcasite and pyrite structures are shown in Figs. 2-5, along with the density of states (DOS).
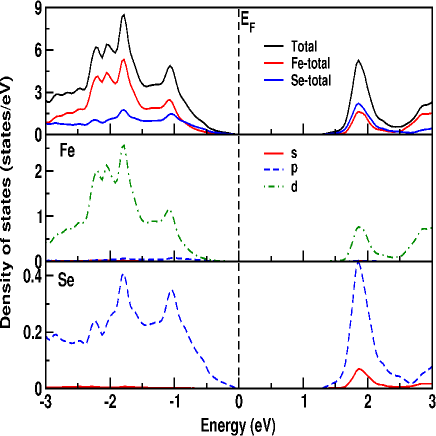
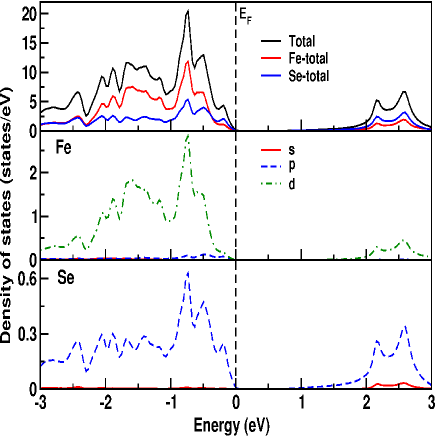
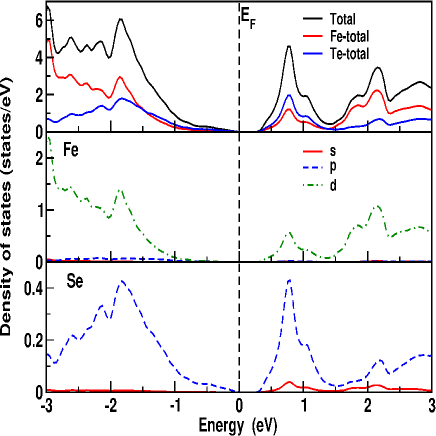
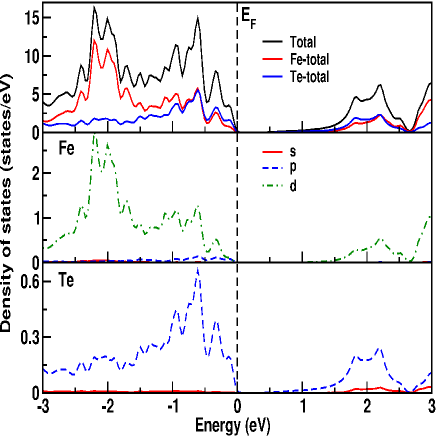
Both the compounds are indirect band gap semiconductors irrespective of their crystal structures. From the partial density of state (PDOS) analysis, we find that there is a strong hybridization between Fe-d and chalcogen p-bands. The Fe d-bands are partially filled and Se p-bands are partially empty. The top of the valence band is predominantly Fe-d whereas the bottom of the conduction band is predominately chalcogen p. However a closer look at the PDOS shows that the states within an energy range 0.25 eV just below the valence band maxima (VBM) (responsible for charge and energy transport) are equal mixture of Fe-d and chalcogen p states. In contrast, the states near the bottom of the conduction band minima (CBM) are mostly of chalcogen p-character. In the marcasite phase of FeSe2 (m-FeS2), the CBM and VBM are located along the - Y and - X directions respectively whereas for FeTe2 (m-FeTe2) they are along the - Y and - X directions, although there is another CBM along the - Z direction nearby in energy. In contrast, in the pyrite phase both of them (p-FeSe2 and p-FeTe2) show similar behavior, CBM is at the point and the VBM lies along the - M direction. Quite interestingly, in p-FeTe2, there are other nearly degenerate VBM along the - X directions. The nature of CBM and VBM and states near their neighborhood will have significant effect on the thermoelectric properties of these two compounds, as discussed later in the paper.
The theoretical values of the band gaps are 1.23 eV for m-FeSe2 and 0.69 eV for p-FeSe2, in good agreement with earlier theoretical calculations by Ganga et alGanga given in Table-II. The corresponding band gaps in the Te compounds are respectively 0.33 and 0.34 eV. The overall reduction in band gap in tellurides is consistent with other known chalcogenides (Bi2Se3, Bi2Te3 etc where the gap decreases in going from Se to Te). However, the sensitivity of the band gap to the structure in FeSe2 and lack thereof in FeTe2 is an important difference between these two compounds. As regards comparison with experiment (see TABLE II), theoretical values of the band gap in m-FeSe2 (1.234 eV in this work using GGA+U and 0.86 eV by Ganga et al using GGA) are in reasonable agreement with experiment (0.95-1.03 eV). GGA underestimates whereas GGA+U overestimates the band gap. However in m-FeTe2 the discrepancy between theory (0.328 eV using GGA+U) and experiment (0.92 eV) is quite large and in the wrong direction compared to m-FeSe2. We expect experimental band gap in m-FeTe2 should be smaller than that of m-FeSe2. In view of this we are calling for more experiments on the optical properties on FeTe2 to measure its band gap. To further understand the difference between the two compounds we have calculated the effective masses in the neighborhood of different VBM and CBM. The calculated results are shown in Table-III. Rapid increase in the DOS near the CBM in the marcasite phase for both the compounds suggests that these will be excellent n-type thermoelectric. In contrast, the pyrite structure is more favorable to p-type thermoelectric due to multiple valence band extrema close in energy. These qualitative ideas will be tested by explicit calculations of thermopower in the next section.
III.3 Thermoelectric properties
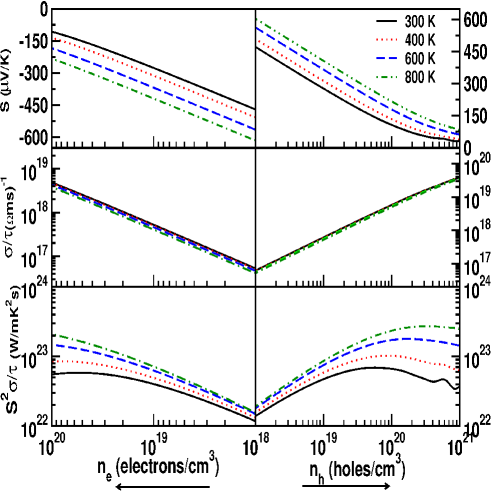
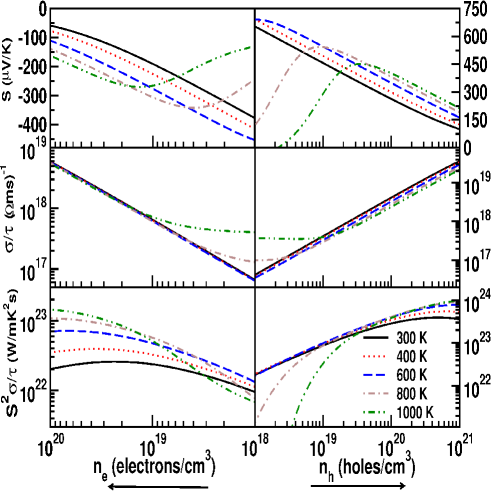
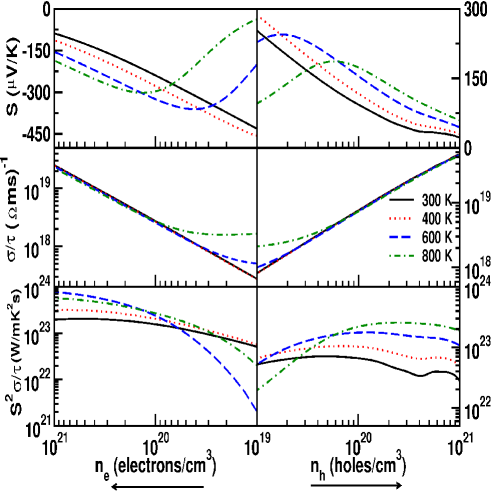
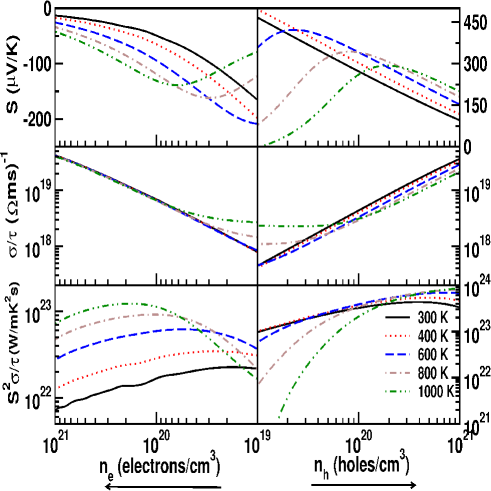
From the analysis of the DOS, the sharp increase in the DOS at the band edge suggests that the investigated compounds may have good thermoelectric properties, particularly large thermopower. To further explore this, we have studied the thermoelectric properties of both the marcasite and pyrite FeX2 using Boltzmann transport equation as implemented in BOLTZTRAP code.Madsen All the properties are calculated using Rigid Band Approximation (RBA)Scheidemantel ; Jodin ; Chaput and the relaxation time is assumed to be independent of energy.singh ; aggate2 ; Khuong In Table III we see that the effective masses change with symmetry directions for both m and p structures. Since most of the experiments are done in poly-crystalline samples, we have calculated the average of thermopower and conductivity over three orthogonal axes. The calculated thermoelectric properties such as thermopower (S in V/K), electrical conductivity ( in ) and power factor scaled by ( in ) for both the electron (ne) and hole (nh) dopings are given in Fig. 6-9. The melting temperatures of the marcasite phase of both the compounds are around 850 K, so we have calculated these properties up to 800 K for this structrure. The pyrite structure on the other hand is found to be stable up to 1300 K, and we have calculated S and up to 1200 K.
The observed reduction in the absolute value of the thermopower with decrease in the concentration is a peculiar feature of bipolar conduction (both electrons and holes contribute significantly to transport) at fixed temperature which we have seen in the case of p-FeSe2 (Fig.7), m- and p-FeTe2 (Fig.8 and 9) which is due to the small band gaps of these compounds (see Table II). From Fig. 6, we find that in m-FeSe2 the thermopower values are almost similar for both electron and hole doping, whereas the electrical conductivity is higher in the case of hole doping in comparison with the electron doping. A similar behaviour is also seen in the power factor values. For p-FeSe2, we have seen that up to 600 K all the thermoelectric quantities are better in the hole doping case which is also consistent with the results of DOS, but at high temperatures (800 K and 1000K) we find evidence of bipolar conduction. So p-FeSe2 can be a good thermoelectric up to 600 K. In the case of m-FeTe2 we find that electron doping is more favourable compared to the hole doping, whereas in p-FeTe2 hole doping is favourable compared to electron doping. We find evidence of bipolar conduction in m-FeTe2 above at 600 K and p-FeTe2 above 800 K. So both m- and p-FeTe2 can be used as thermoelectric material below 600 K.
As per the earlier study, the optimum value of the magnitude of usually falls in the region of 200-300 V/K to get a figure of merit (ZT) to be 1. In our study the hole concentration is between 2.10, 1.78 for m- and p-FeSe2 respectively. In case of FeTe2 the optimum value in the marcasite phase is found in the electron concentration range of 1.46 and for the pyrite phase it is found for the hole concentration range 1.36 at 600 K.
Our theoretical results for are compared with the earlier experimental work of Harada,Harada and can be compared with the thermopower values at room and high temperature for the m-FeSe2 structures. For marcasite the hole and electron concentrations are found to be 5.8 and 8.5 for a thermopower of +320 and -120 at 300 and 600 K, respectively. Similarly, for m-FeTe2 we find the hole and electron concentration to be 9.2 and 1.4 for the thermopower values of 96 and -74 at 300 and 600 K. The experimental data on thermoelectric power and electrical conductivity is used to obtain an estimation of the relaxation time . We find to be 1.01 s and 2.38 s for FeSe2 at 300 and 600 K respectively. Similarly, for m-FeTe2 is found to be 2.3 s and 3.1 s respectevely. We can clearly see that the relaxation time of m-FeSe2 is lower that that of m-FeTe2, and hence one could expect that FeSe2 shows better TE properties than FeTe2. Overall, both marcasite and pyrite phases of the investigated compounds are good candidates for thermoelectric properties, and marcasite FeSe2 is found to be the best thermoelectric material among all the compounds studied. In order to evaluate these compound’s figure of merit ZT, one should have experimental measurements of their thermal conductivities.
IV Conclusion
The structural and electronic transport properties of marcasite and pyrite phases of FeX2 are studied using density functional theory. We didn’t find any structural transition between the marcasite and pyrite, and also found that marcasite structure of both the compounds are energetically stable than the pyrite structure. The calculated ground state properties of FeX2(X=Se,Te) agree quite well with the available experiments. Electronic structure calculations show that all the investigated compounds are indirect band gap semiconductors, in good agreement with earlier reports. We further calculated the thermoelectric properties of the these compounds and compared with the available experimental reports. The calculations show all the investigated compounds to be very good thermoelectric materials for p-type doping, except marcasite FeTe2 which favours electron doping. Among all the studied compounds we find marcasite FeSe2 to be a good p-type thermoelectric material.
V Acknowledgements
V. K. G and V. K would like to acknowledge IIT-Hyderabad for the computational facility. V. K. G. would like to thank MHRD for the fellowship. V. K. thank NSFC awarded Research Fellowship for International Young Scientists under Grant No. 11250110051. One of us (SDM) would like to acknowledge support by the Department of Energy (DOE)-Energy Frontier Research Center(EFRC) at Michigan State University on “Revolutionary Materials for Solid State Energy Conversion”.
*Author for Correspondence, E-mail: kanchana@iith.ac.in
References
- (1) D.M. Rowe, CRC Handbook of Thermoelectrics (Boca Raton: CRC, 1995).
- (2) X. Shi, J. Yang, J. R. Salvador, M. Chi, J. Y. Cho, H. Wang, S. Bai, J. Yang, W. Zhang and L. Chen, J. Am. Chem. Soc., 2011, 133 7837.
- (3) K. Biswas, J. He, I. D. Blum, C.-I. Wu, T. P. Hogan, D. N. Seidman, V. P. Dravid and M. G. Kanatzidis, Nature, 2012, 489, 414.
- (4) G. A. Slack, Solid State Physics, ed. H. Ehrenreich, F. Weitz and D. Turnbull, Academic Press, New York, 1979, pp. 1–71.
- (5) X. Lu and D. T. Morelli, Phys. Chem. Chem. Phys., 2013, 15, 5762.
- (6) X. Lu, D. T. Morelli, Y. Xia, F. Zhou, V. Ozolins, H. Chi, X. Zhou and C. Uher, Adv. Energy Mater., 2013, 3, 342.
- (7) C. N. R. Rao, F. L. Deepak, G. Gundiah and A. Govindaraj, Prog. Solid State Chem. 2003, 31, 5.
- (8) B. G. Ganga, C. Ganeshraj, A. Gopal Krishna, and P.N.Santhosh,
- (9) G. Fischer, Can. J. Phys., 1958, 36, 1435.
- (10) L. D. Dudkin and V. I. Vaidanich, Sov. Phys. Solid State, 1961, 2, 1384.
- (11) F. Hulliger, Helv. Phys. Acta, 1962, 35, 535.
- (12) Takashi Harada, J. Phys. Soc. Jpn., 1998, 67, 1352-1358.
- (13) T. A. Bither, R. J. Bouchard, W. H. Cloud, P. C. Donohue and W. J. Siemons, Inorg. Chem. 1968, 7, 2208.
- (14) S. Baroni, S. D. Gironcoli and A. dal Corso et al, 2008.
- (15) P. Blaha, K. Schwarz, G. K. H. Madsen,D. Kvasnicka and Luitz J WIEN2K, An augmented plane wave + local orbitals program for calculating crystal properties (Karlheinz Schwarz, Techn. Universität Wien, Austria) (2001).
- (16) J. P. Perdew, K. Burke and M. Ernzerhof, Phys. Rev. Lett., 1996, 77, 3865.
- (17) H. J. Monkhorst and J. D. Pack, Phys. Rev. B, 1976, 13, 5188.
- (18) D. Vanderbilt, Phys. Rev. B, 1990, 41, 7892.
- (19) R. M. Nieminen, Topics in Applied Physics: Theory of defects in semiconductors (Springer, Berlin, 2006), Vol. 104, pp. 36–40.
- (20) G. K. H. Madsen and D. J. Singh, Comput. Phys. Commun. 2006, 175, 67–71.
- (21) T. J. Scheidemantel, C. Ambrosch-Draxl, T. Thonhauser, J. V. Badding and J. O. Sofo, Phys. Rev. B, 2003, 68, 125210.
- (22) L. Jodin, J. Tobola, P. Pécheur, H. Scherrer and S. Kaprzyk, Phys. Rev. B, 2004, 70, 184207.
- (23) L. Chaput, P. Pécheur, J. Tobola and H. Scherrer, Phys. Rev. B, 2005, 72, 085126.
- (24) D. I. Bilc, S. D. Mahanti and M. G. Kanatzidis, Phys. Rev. B, 2006, 74, 125202.
- (25) J. M. Ziman, Electrons and Phonons: Theory of Transport Phenomena in Solids (Oxford University Press, London, UK) (1960).
- (26) B. R. Nag, Electron Transport in Compound Semiconductors (Springer-Verlag, Berlin) (1980).
- (27) D. Bilc, S. D. Mahanti, Eric Quarez, Kuei-Fang Hsu, Robert Pcionek, and M. G. Kanatzidis, Phys. Rev. Lett, 2004, 93, 146403.
- (28) Salameh Ahmad, Khang Hoang, and S. D. Mahanti, Phys. Rev. Lett., 2006, 96, 056403.
- (29) Mal-Soon Lee and S. D. Mahanti, Phys. Rev. B, 2012, 85, 165149.
- (30) David J. Singh, Func. Mat. Letters. 2010, 3, 223.
- (31) Khuong P. Ong, David J. Singh and Ping Wu, Phys. Rev. B, 2011, 83, 115110.
- (32) David Parker, and David J. Singh, Phys. Rev. B, 2012, 85, 125209.
- (33) David J. Singh and I. I. Mazin, Phys. Rev. B, 1997, 56, R1650.
- (34) David Parker and David J. Singh, Phys. Rev. B, 2010, 82, 035204.
- (35) G. K. H. Madsen, K. Schwarz, Peter Blaha and David J. Singh, Phys. Rev. B, 2003, 68 125212.
- (36) Lijun Zhang, Mao-Hua Du and David J. Singh, Phys. Rev. B, 2010, 81, 075117.
- (37) T. A. Bither, C. T. Prewitt, J. L. Gillson, P. E. Bierstedt, R. B. Flippen and H. S. Young, J. Solid State Comm., 1966, 4, 533.
- (38) Gunnar Brostigen and Arne Kjekshus, Acta Chem. Scand., 1970, 24, 1925.
- (39) Arne Kjekshus, Trond Rakke and Arne F. Andresen, Acta Chem. Scand. A, 1974, 28, 996.
- (40) G. Yamaguchi, M. Shimada and M. Koizumi, J. Solid State Chem., 1976, 9, 63.
- (41) Landolt-Börnstein (New Series), ed.: K. H. Hellwege, Vol. III/6, Springer Verlag: Berlin, Heidelberg, New York 1971.
- (42) A. I. Liechtenstein, V. I. Anisimov and J. Zaanen, Phys. Rev. B, 1995, 52, R5467.
| FeSe2 | FeTe2 | ||||||||||
| Marcasite | Pyrite | Marcasite | Pyrite | ||||||||
| Present | Exp.a | Present | Exp.b | Present | Exp.c | Present | Exp.b | ||||
| a(Å) | 4.7627 | 4.8002 | 5.746 | 5.7859 | 5.2845 | 5.275 | 6.3083 | 6.2937 | |||
| b(Å) | 5.7439 | 5.7823 | 6.2865 | 6.269 | |||||||
| c(Å) | 3.5872 | 3.5834 | 3.9058 | 3.872 | |||||||
| V(Å3) | 98.13 | 99.46 | 189.71 | 193.70 | 129.75 | 128.04 | 251.04 | 249.30 | |||
| Ref. Arne, | |||||||||||
| Ref. TAB, | |||||||||||
| Ref. Yamaguchi, |
| FeSe2 | FeTe2 | ||||||||
|---|---|---|---|---|---|---|---|---|---|
| Marcasite | Pyrite | Marcasite | Pyrite | ||||||
| Present | 1.234 | 0.694 | 0.328 | 0.432 | |||||
| Exp/other | 0.95-1.03a | - | 0.92c | - | |||||
| Other calculation | 0.86b | 0.67b | - | - | |||||
| Ref. Arne, | |||||||||
| Ref. Ganga, | |||||||||
| Ref. Landolt, |
| Marcasite | FeSe2 | FeTe2 | |||
|---|---|---|---|---|---|
| Direction | Valence Band | Conduction Band | Valence Band | Conduction Band | |
| -Z | 0.048 | 0.451 | 0.019 | 0.038 | |
| -Y | 0.042 | 0.041 | 0.018 | 0.021 | |
| -X | 0.024 | 0.066 | 0.017 | 0.014 | |
| Pyrite | |||||
| -X | 0.012 | 0.028 | 0.010 | 0.027 | |
| -M | 0.028 | 0.055 | 0.019 | 0.046 | |
| -R | 0.032 | 0.036 | 0.028 | 0.025 |