Direct observation of the injection dynamics of a laser wakefield accelerator using few-femtosecond shadowgraphy
Abstract
We present few-femtosecond shadowgraphic snapshots taken during the non-linear evolution of the plasma wave in a laser wakefield accelerator with transverse synchronized few-cycle probe pulses. These snapshots can be directly associated with the electron density distribution within the plasma wave and give quantitative information about its size and shape. Our results show that self-injection of electrons into the first plasma wave period is induced by a lengthening of the first plasma period. Three dimensional particle in cell simulations support our observations.
Laser-wakefield accelerators (LWFA) operating in the ‘bubble’-regime pukhov02 can generate quasimonoenergetic multigigaelectronvolt electron beams leemans06 ; wang13 with femtosecond duration lundh11 ; buck11 and micrometer dimensions schnell12 ; plateau12 . These beams are produced by accelerating electrons in laser-driven plasma waves over centimeter distances. They have the potential to be compact alternatives to conventional accelerators hooker13 . In a LWFA, the short driving laser pulse displaces plasma electrons from the stationary background ions. The generated space charge fields cause the electrons to oscillate and form a plasma wave in the laser’s wake. This wave follows the laser at almost , the speed of light; for low amplitude it has a wavelength of
| (1) |
where is the electron density of the plasma. At high amplitude, electrons from the background can be injected into the wake and accelerated, producing monoenergetic electron pulses mangles04 ; geddes04 ; faure04 . Significant progress has been made regarding achievable peak energy wang13 , beam stability gonsalves11 and the generation of bright X-ray pulses rousse04 ; kneip10 ; powers14 . Until now, most of our knowledge about the dynamics of the self-injection process has been derived from detailed particle-in-cell (PIC) simulations. These simulations show that self-focusing thomasPRL07 and pulse compression faurePRL05 play a vital role in increasing the laser pulse intensity prior to injection. Furthermore, simulations indicate that self-injection of electrons is associated with a dynamic lengthening of the first plasma wave’s period (the ‘bubble’). This lengthening can be driven by changes of the electric field structure inside the plasma wave caused by the injected electrons tzoufras09 . In contrast, the lengthening may also be due to an intensity amplification of the laser pulse caused by the non-linear evolution of the plasma wave kalmykov09 ; kostyukov09 or due to a local increase in intensity caused by two colliding pulses lehe13 . In these latter scenarios, injection is a consequence of the lengthening of the bubble. However, experimental insight into these processes is extremely challenging due to the small spatial and temporal scales of a LWFA.
The plasma wave, a variation in the electron density, has an associated refractive index profile which can be detected using longitudinal marques96 ; siders96 ; matlis06 or transverse probes buck11 . Longitudinal probes cannot measure the rapid and dynamic evolution of the plasma wave that occurs in non-linear wakefield accelerators and suffer from the strong refraction caused by the steep refractive index gradients in a plasma wave. However, a small offset angle between pump and probe can measure the evolution, but only in 1D Li14 . Furthermore, to properly resolve the wake structure the probe must have a duration (or equivalent bandwidth) less then which has not yet been achieved buck11 ; Li14 , meaning that the important details of the wake evolution, e.g. the lengthening of the bubble in relation to the injection process have not yet been resolved. By using a probe pulse shorter than to perform high resolution shadowgraphy we are able to show for the first time that, under our experimental conditions, bubble expansion occurs before self-injection starts.
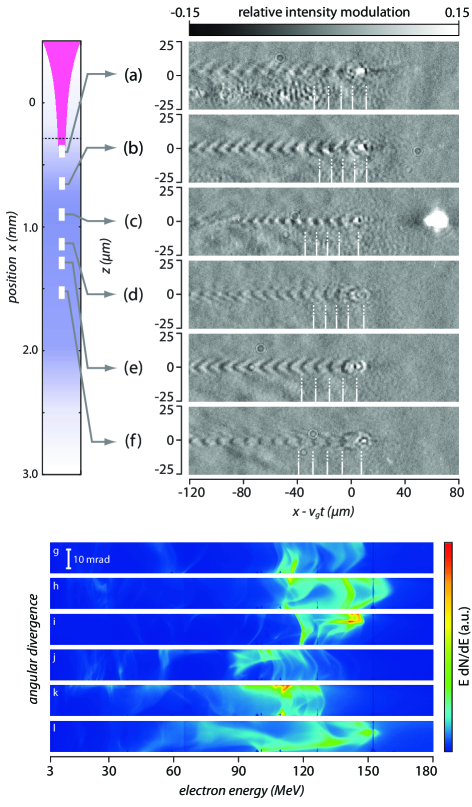
In the present study, the JETI-laser system at the Institut für Optik und Quantenelektronik in Jena, Germany delivered pulses of 750 mJ energy and 35 fs duration (central wavelength ). The pulses were focused by an off-axis parabolic mirror to an elliptical focal spot with dimensions (FWHM) containing of the energy, resulting in peak intensities of Wcm-2 (corresponding to a peak normalized vector potential of ). A supersonic helium gas jet was used, generating a plasma with electron density in the range of cm-3. Electrons accelerated during the interaction could be detected using a magnetic spectrometer or a scintillating screen. A small fraction of the laser was split from the main pulse, spectrally broadened in a hollow-core fiber filled with argon to support a transform limited pulse duration of fs. Using dispersive mirrors and glass wedges to optimize dispersion, probe pulses as short as fs were created schwab13 . These synchronized, few-cycle probe pulses were used to back-light the LWFA perpendicularly to the pump-pulse direction. A high-resolution imaging system produced shadowgraphic images with micrometer resolution on a CCD camera. By varying the delay between pump and probe, different stages of the plasma wave’s evolution were recorded on subsequent shots close to the threshold density for self injection. The snapshots shown in Fig. 1 are representative of each stage in the acceleration process. Shots were selected that exhibit similar quasi-monoenergetic electron spectra (Fig. 1(g-l)) and produced a high contrast shadowgram. The latter was affected by jitter in probe duration and pointing fluctuations of the pump which shifts the image out of focus. To reduce modulations induced by the probe pulse’s beam profile, the relative intensity modulation was plotted using with being the pixel value at each individual position and the value derived from a low order spline fit in the horizontal direction.
Early in the interaction the regions of high and low electron density gradient (dark and light regions in the image) are approximately equal in length, indicating a linear plasma wave, Fig. 1(a). The transverse extent of the plasma wave reduces and the amplitude of the wave increases, Fig. 1(b). Later on, significant increase of curvature of the plasma-wave train and, in particular, in the lengthening of the first plasma period, Fig. 1(c) is apparent. Just ahead of the region where this lengthening starts we observe bright emission from the plasma. This has a broad spectrum (covering at least a range from 600- 1000 nm, cf. the 60 nm bandwidth of the pump) and is consistent with ‘wavebreaking radiation’ thomas07 , which is a direct signature of the onset of self-injection in the experiment. Further propagation enhances the density gradient at the front of the bubble which now appears in the shadowgrams at the beginning of the wave train. After wavebreaking, the wave becomes highly non-linear, as indicated by the reversal in the direction of curvature of the trailing wave periods in the shadowgrams, Fig. 1(d) to 1(f). These features are closely linked to the process of transverse wavebreaking bulanov97 .
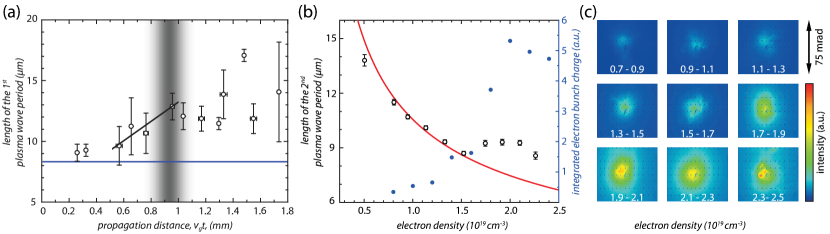
Our snapshots reveal that the dynamic process of bubble lengthening is intimately tied to self-injection. We plot in Fig. 2(a) the evolution of the plasma wave’s first period. Early in the interaction the length of the first period has already increased as compared to the wavelength for a linear relativistic plasma wave, . The length of the bubble increases up to the point of wavebreaking, cf. Fig 1(c). During a single interaction, this radiation is emitted from a distinct spot on the optical axis with longitudinal position varying slightly in the experiment around m for . Beyond this point the shape of the plasma wave varies from shot to shot. This can lead to the formation of a single bubble or to the merging of the first two plasma wave periods due to beam loading resulting in a strong variation of the bubble length after injection (Fig. 2(a)). A linear regression fit to the data (Fig. 2(a)) shows that the bubble starts expanding from a diameter of at an expansion velocity of . The fact that we observe bubble lengthening before injection clearly demonstrates that the initial expansion is not caused by the effect of charge loaded into the wake. This lengthening is therefore most likely caused by intensity amplification of the pulse as it propagates in the plasma wave.
We also measured the length of the second wave period, shown in Fig. 2(b), as a function of density at a fixed position in the plasma (mm). These measurements were made sufficiently far into the gas jet to ensure that it was in the uniform density plateau. At low densities, the length is well matched to Eq. (1), but at high densities, is significantly longer. The density at which this transition occurs corresponds to the onset of injected charge, see Fig. 2(c), and to the self-injection threshold predicted in Ref mangles12 . The second period lengthens due to the relativistic -factor of the electrons associated with the large amplitude plasma wave. As is increased beyond cm-3, decreases but the rate of expansion increases so that we observed an approximately constant wavelength at this fixed position.
In addition, three dimensional particle in cell (3D-PIC) simulations were performed with the code EPOCH epoch . A laser pulse with duration and was focused to a spot size of (FWHM), into a plasma density profile similar to the experiment (peak density cm-3). In order to take into account imperfections in the experimental focal spot we set the maximum intensity of the laser pulse to , leading to similar energies within the focal spot FWHM in experiment and simulation genoud13 . The computational domain was a ‘sliding window’ of size moving at . We used cells with two electrons per cell and a stationary ion background. A order finite-difference-time-domain scheme was employed, together with order particle weighting.
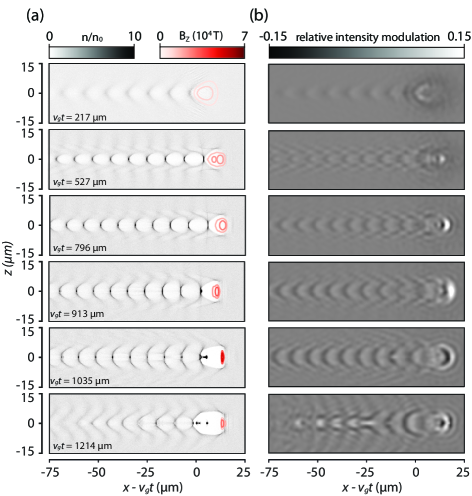
Probe propagation has also been fully simulated in 3D with EPOCH. At different time steps during the driver pulse propagation the moving window was stopped and the probe was injected from the side of the box, propagating in the negative direction, perpendicularly to the pump. The probe had a central wavelength , a Fourier limited duration of and a negative linear chirp increasing its duration to for a best match to the experimental images. The probe propagated past the wakefield structure, until m. Subsequently, propagation in vacuum was assumed and modeled in Fourier space including the imaging system aperture, sensor sensitivity and image plane position. To adjust for the latter, we propagated the probe pulse backwards and recorded the time-averaged Poynting flux through the object plane, which was at . The comparison of density maps and PIC generated shadowgrams in Fig. 3 verifies that shadowgrams capture local variations in plasma density and allows a direct interpretation of the experimental shadowgrams. We note that the injected electron bunch appears neither in the simulated nor the experimental shadowgrams. This is caused by the reduction of local plasma frequency due to the -factor to the index of refraction. These simulated probe images confirm that few-femtosecond shadowgraphy provides quantitative information about the plasma wave including the plasma wave length, curvature and number of trailing periods.
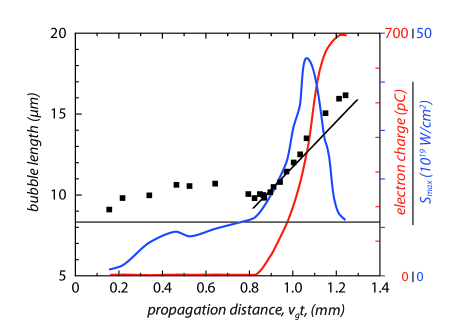
The length of the first plasma period, i.e. the bubble, as taken from the PIC simulations at various positions during the evolution is shown in Fig. 4 together with the maximum amplitude of the pump pulse’s Poynting vector and the total injected charge with energy above . The intensity increase due to pump compression and self-focusing [see also Fig. 3(a)] is slow until approximately . Until that point the bubble length grows from to . After a phase of rapid intensity amplification begins, accompanied by bubble expansion and injection. At this stage, there is no substantial charge injected and so the bubble expansion is not due to beam-loading but due to intensity amplification of the pump and the associated increase of the -factor of the plasma electrons; . This intensity amplification manifests itself in an increased visibility of the front of the bubble in the simulation, Fig. 3(b) and experimental (Fig. 1(e-f)) shadowgrams. In the PIC simulation significant charge is only injected into the wake (around ) after the length of the bubble has started to increase as also observed previously in simulations bulanov98 ; mangles04 ; kalmykov09 . After , the intensity decreases, while the length of the bubble keeps increasing due to beam-loading. At approximately , the simulation shows a merging of the first two periods of the wake. The simulation supports the experimental observation that self-injection in the LWFA is caused by the expansion of the bubble. It predicts an expansion velocity of the bubble length of (cf. Fig. 4), which is faster than the experimentally measured value. This could be due to imperfections in the experimental pulse profile leading to less efficient pulse self-compression and self-focusing than in the simulation. Our ability to determine the rate of expansion of the bubble from the experimental shadowgrams could allow the benchmarking and further development of dynamic bubble models in the future.
Applying our approach to visualize the full non-linear evolution of the plasma wave allows the acceleration process to be studied with unprecedented precision. As well as providing greater understanding of acceleration in the bubble-regime, our technique can easily be adopted to more complex acceleration geometries, e.g. staging gonsalves11 , or for beam-driven acceleration blumenfeld07 ; caldwell09 ; litos14 . Furthermore, increasing the probe pulse’s wavelength while keeping a few-cycle duration will increase the sensitivity of our technique to probe low-density plasmas at the same relative resolution. Such low plasma densities are essential for high-energy plasma-acceleration scenarios. As LWFAs are widely expected to become useful sources of ultra short radiation albert14 , the increased level of understanding of plasma wave evolution and injection that can be gleaned from few-femtosecond shadowgraphy and the improvements in beam properties resulting from this technique are therefore likely to have a large impact on biomedical imaging and ultrafast condensed-matter study.
We thank B. Beleites, W. Ziegler, and F. Ronneberger for running the JETI-laser system. E.S. and S.S. thank V. T. Tikhonchuk for helpful discussions. This study was supported by DFG (grants TR18 A12, B9 and KA 2869/2-1), BMBF (contracts 05K10SJ2 and 03ZIK052), European Regional Development Fund (EFRE), STFC (ST/J002062/1) and EPSRC (EP/H00601X/1). The collaboration was funded by LASERLAB-EUROPE (grant agreement n∘ 284464, EC’s Seventh Framework Programme). EPOCH was developed under UK EPSRC grants EP/G054940/1, EP/G055165/1 and EP/G056803/1. For the computations, the Max Planck supercomputer at the Garching Computing Center RZG was used.
References
- (1) A. Pukhov and J. Meyer-ter-Vehn, Appl. Phys. B 74, 355 (2002).
- (2) W. P. Leemans et al., Nature Phys. 2, 696 (2006).
- (3) X. Wang et al., Nature Commun. 4, 1988 (2013).
- (4) O. Lundh et al., Nature Phys. 7, 219 (2011).
- (5) A. Buck et al., Nature Phys. 7, 543 (2011).
- (6) M. Schnell et al., Phys. Rev. Lett. 108, 075001 (2012).
- (7) G. R. Plateau et al., Phys. Rev. Lett. 109, 064802 (2012).
- (8) S. M. Hooker, Nature Photon. 7, 775 (2013).
- (9) S. P. D. Mangles et al., Nature 431, 535 (2004).
- (10) C. G. R. Geddes et al., Nature 431, 538 (2004).
- (11) J. Faure et al., Nature 431, 541 (2004).
- (12) A. J. Gonsalves et al., Nature Phys. 7, 862 (2011).
- (13) A. Rousse et al., Phys. Rev. Lett. 93, 135005 (2004).
- (14) S. Kneip et al., Nature Phys. 6, 980 (2010).
- (15) S. M. Powers et al., Nature Photon. 8, 28 (2014).
- (16) A. G. R. Thomas et al., Phys. Rev. Lett. 98, 095004 (2007).
- (17) J. Faure et al., Phys. Rev. Lett. 95, 205003 (2005).
- (18) M. Tzoufras et al., Phys. Plasmas 16, 056705 (2009).
- (19) S. Kalmykov et al., Phys. Rev. Lett. 103, 135004 (2009).
- (20) I. Kostyukov et al., Phys. Rev. Lett. 103, 175003 (2009).
- (21) R. Lehe et al., Phys. Rev. Lett. 111, 085005 (2013).
- (22) J. R. Marques et al., Phys. Rev. Lett. 76, 3566 (1996).
- (23) C. W. Siders et al., Phys. Rev. Lett. 76, 3570 (1996).
- (24) N. H. Matlis, et al., Nature Phys. 2, 749 (2006).
- (25) Z. Li et al., Phys. Rev. Lett. 113, 085001 (2014).
- (26) M. B. Schwab et al., Appl. Phys. Lett. 103, 191118 (2013).
- (27) A. G. R. Thomas et al., Phys. Rev. Lett. 98, 054802 (2007).
- (28) S. V. Bulanov et al., Phys. Rev. Lett. 78, 4205 (1997).
- (29) S. P. D. Mangles et al., Phys. Rev. ST Accel. Beams 15, 011302 (2012).
- (30) http://ccpforge.cse.rl.ac.uk/gf/project/epoch
- (31) G. Genoud, et al., Phys. Plasmas, 20 064501 (2013).
- (32) S. Bulanov et al., Phys. Rev. E 58, R5257 (1998).
- (33) I. Blumenfeld et al., Nature 445, 741 (2007).
- (34) A. Caldwell et al., Nature Phys. 5, 363 (2009).
- (35) M. Litos et al., Nature 515, 92 (2014).
- (36) F. Albert, et al., Plasma Phys. Control. Fusion 56, 084015 (2014).