A low-noise frequency down-conversion to the telecommunication band for a quantum communication based on NV centers in diamond
Rikizo Ikuta1,∗, Toshiki Kobayashi1, Shuto Yasui1, Shigehito Miki2, Taro Yamashita2, Hirotaka Terai2, Mikio Fujiwara3, Takashi Yamamoto1, Masato Koashi3, Masahide Sasaki4, Zhen Wang2,5, Nobuyuki Imoto1
1Graduate School of Engineering Science, Osaka University, Toyonaka, Osaka 560-8531, Japan
2Advanced ICT Research Institute, National Institute of Information and Communications Technology (NICT), Kobe 651-2492, Japan
3Photon Science Center, The University of Tokyo, Bunkyo-ku, Tokyo 113-8656, Japan
4Advanced ICT Research Institute, National Institute of Information and Communications Technology (NICT), Koganei, Tokyo 184-8795, Japan
5Shanghai Center for SuperConductivity, Shanghai Institute of Microsystem and Information Technology, Chinese Academy of Sciences, R3317, 865 Changning Road, Shanghai 200050, PR China
∗ikuta@mp.es.osaka-u.ac.jp
Abstract
We demonstrate a low-noise frequency down-conversion of photons at 637 nm to the telecommunication band at 1587 nm by the difference frequency generation in a periodically-poled lithium niobate. An internal conversion efficiency of the converter is estimated to be 0.44 at the maximum which is achieved by a pump power of 430 mW, whereas a rate of internal background photons caused by the strong cw pump laser is estimated to be 9 kHz/mW within a bandwidth of about 1 nm. By using the experimental values related to the intrinsic property of the converter, and using the intensity correlation and the average photon number of a 637-nm input light pulse, we derive the intensity correlation of a converted telecom light pulse. Then we discuss feasibility of a single-photon frequency conversion to the telecommunication band for a long-distance quantum communication based on NV centers in diamond.
OCIS codes: (270.5565) Quantum communications; (270.5585) Quantum information and processing; (130.7405) Wavelength conversion devices; (190.4223) Nonlinear wave mixing
References and links
- [1] N. Sangouard, C. Simon, H. de Riedmatten, and N. Gisin, “Quantum repeaters based on atomic ensembles and linear optics,” Reviews of Modern Physics 83, 33 (2011).
- [2] N. Gisin and R. O. B. Thew, “Quantum communication,” Nature Photonics 1, 165 (2007).
- [3] D. N. Matsukevich and A. Kuzmich, “Quantum state transfer between matter and light.” Science 306, 663 (2004).
- [4] S. Ritter, C. Nölleke, C. Hahn, A. Reiserer, A. Neuzner, M. Uphoff, M. Mücke, E. Figueroa, J. Bochmann, and G. Rempe, “An elementary quantum network of single atoms in optical cavities.” Nature 484, 195 (2012).
- [5] S. Olmschenk, D. N. Matsukevich, P. Maunz, D. Hayes, and C. Monroe, “Quantum teleportation between distant matter qubits,” Science 323, 486 (2009).
- [6] E. Togan, Y. Chu, a. S. Trifonov, L. Jiang, J. Maze, L. Childress, M. V. G. Dutt, a. S. Sø rensen, P. R. Hemmer, a. S. Zibrov, and M. D. Lukin, “Quantum entanglement between an optical photon and a solid-state spin qubit.” Nature 466, 730 (2010).
- [7] W. B. Gao, P. Fallahi, E. Togan, and A. Imamoglu, “Observation of entanglement between a quantum dot spin and a single photon,” Nature 491, 426 (2012).
- [8] P. Kumar, “Quantum frequency conversion.” Optics Letters 15, 1476 (1990).
- [9] M. S. Shahriar, P. Kumar, and P. R. Hemmer, “Connecting processing-capable quantum memories over telecommunication links via quantum frequency conversion,” Journal of Physics B: Atomic, Molecular and Optical Physics 45, 124018 (2012).
- [10] A. G. Radnaev, Y. O. Dudin, R. Zhao, H. H. Jen, S. D. Jenkins, A. Kuzmich, and T. A. B. Kennedy, “A quantum memory with telecom-wavelength conversion,” Nature Physics 6, 894 (2010).
- [11] Y. Dudin, A. Radnaev, R. Zhao, J. Blumoff, T. Kennedy, and a. Kuzmich, “Entanglement of Light-Shift Compensated Atomic Spin Waves with Telecom Light,” Physical Review Letters 105, 260502 (2010).
- [12] H. Takesue, “Single-photon frequency down-conversion experiment,” Physical Review A 82, 013833 (2010).
- [13] N. Curtz, R. Thew, C. Simon, N. Gisin, and H. Zbinden, “Coherent frequency-down-conversion interface for quantum repeaters,” Optics Express 18, 22099 (2010).
- [14] S. Zaske, A. Lenhard, and C. Becher, “Efficient frequency downconversion at the single photon level from the red spectral range to the telecommunications C-band.” Optics Express 19, 12825 (2011).
- [15] R. Ikuta, Y. Kusaka, T. Kitano, H. Kato, T. Yamamoto, M. Koashi, and N. Imoto, “Wide-band quantum interface for visible-to-telecommunication wavelength conversion.” Nature communications 2, 1544 (2011).
- [16] S. Zaske, A. Lenhard, C. Keß ler, J. Kettler, C. Hepp, C. Arend, R. Albrecht, W.-M. Schulz, M. Jetter, P. Michler, and C. Becher, “Visible-to-Telecom Quantum Frequency Conversion of Light from a Single Quantum Emitter,” Physical Review Letters 109, 147404 (2012).
- [17] R. Ikuta, H. Kato, Y. Kusaka, S. Miki, T. Yamashita, H. Terai, M. Fujiwara, T. Yamamoto, M. Koashi, M. Sasaki, Z. Wang, and N. Imoto, “High-fidelity conversion of photonic quantum information to telecommunication wavelength with superconducting single-photon detectors,” Physical Review A 87, 010301 (2013).
- [18] E. Neu, D. Steinmetz, J. Riedrich-Möller, S. Gsell, M. Fischer, M. Schreck, and C. Becher, “Single photon emission from silicon-vacancy colour centres in chemical vapour deposition nano-diamonds on iridium,” New Journal of Physics 13, 025012 (2011).
- [19] M. W. Doherty, N. B. Manson, P. Delaney, F. Jelezko, J. Wrachtrup, and L. C. Hollenberg, “The nitrogen-vacancy colour centre in diamond,” Physics Reports 528, 1 (2013).
- [20] A. Batalov, C. Zierl, T. Gaebel, P. Neumann, I. Chan, G. Balasubramanian, P. R. Hemmer, F. Jelezko, and J. Wrachtrup, “Temporal Coherence of Photons Emitted by Single Nitrogen-Vacancy Defect Centers in Diamond Using Optical Rabi-Oscillations Fluorescence,” Physical Review Letters 100, 077401 (2008).
- [21] M. J. B. Tim Schroder, Friedemann Gadeke and O. Benson, “Ultrabright and efficient single-photon generation based on nitrogen-vacancy centres in nanodiamonds on a solid immersion lens,” New Journal of Physics 13, 055017 (2011).
- [22] B. J. M. Hausmann, T. M. Babinec, J. T. Choy, J. S. Hodges, S. Hong, I. Bulu, A. Yacoby, M. D. Lukin, and M. Lonar, “Single-color centers implanted in diamond nanostructures,” New Journal of Physics 13, 045004 (2011).
- [23] N. Mizuochi, T. Makino, H. Kato, D. Takeuchi, M. Ogura, H. Okushi, M. Nothaft, P. Neumann, A. Gali, F. Jelezko, J. Wrachtrup, and S. Yamasaki, “Electrically driven single-photon source at room temperature in diamond,” Nature photonics 6, 299 (2012).
- [24] T. Schröder, M. Fujiwara, T. Noda, H.-Q. Zhao, O. Benson, and S. Takeuchi, “A nanodiamond-tapered fiber system with high single-mode coupling efficiency.” Optics express 20, 10490 (2012).
- [25] H. Bernien, B. Hensen, W. Pfaff, G. Koolstra, M. S. Blok, L. Robledo, T. H. Taminiau, M. Markham, D. J. Twitchen, L. Childress, and R. Hanson, “Heralded entanglement between solid-state qubits separated by three metres.” Nature 497, 86 (2013).
- [26] R. Albrecht, A. Bommer, C. Deutsch, J. Reichel, and C. Becher, “Coupling of a single nitrogen-vacancy center in diamond to a fiber-based microcavity,” Physical Review Letters 110, 243602 (2013).
- [27] J. S. Pelc, C. Langrock, Q. Zhang, and M. M. Fejer, “Influence of domain disorder on parametric noise in quasi-phase-matched quantum frequency converters.” Optics letters 35, 2804 (2010).
- [28] T. Nishikawa, A. Ozawa, Y. Nishida, M. Asobe, F.-L. Hong, and T. W. Hänsch, “Efficient 494 mW sum-frequency generation of sodium resonance radiation at 589 nm by using a periodically poled Zn:LiNbO3 ridge waveguide.” Optics Express 17, 17792 (2009).
- [29] S. Miki, T. Yamashita, H. Terai, and Z. Wang, “High performance fiber-coupled NbTiN superconducting nanowire single photon detectors with Gifford-McMahon cryocooler,” Optics Express 21, 10208 (2013).
- [30] R. Hanbury Brown and R. Q. Twiss, “Correlation between Photons in two Coherent Beams of Light.” Nature 177, 27 (1956).
- [31] D. Englund, B. Shields, K. Rivoire, F. Hatami, J. Vu, H. Park, and M. D. Lukin, “Deterministic coupling of a single nitrogen vacancy center to a photonic crystal cavity.” Nano letters 10, 3922 (2010).
1 Introduction
Quantum repeaters for efficiently transmitting a quantum state through lossy and noisy quantum channels have been proposed [1] and actively studied for realizing long distance quantum communication[2]. In the quantum repeater protocols, photons entangled with quantum memories at remote parties are sent to relay points, and they are measured by the Bell measurement for establishing the entanglement between the quantum memories at the remote parties. The elementary part that creates entanglement between a quantum memory and a photon has been demonstrated in atomic systems [3, 4], trapped ion systems [5] and solid-state systems [6, 7]. In such systems, the wavelengths of the photons are strictly limited by the structure of their energy levels, which lie around visible range. On the other hand, when we look at optical-fiber networks, the photons at the telecommunication wavelengths are crucial for the efficient transmission of the photons. Thus a photonic quantum interface [8] for visible-to-telecommunication wavelength conversion is considered to be inevitable for a long distance quantum communication based on the quantum repeaters [9].
So far, in order to build such a quantum interface, the frequency down-conversion working at a single-photon level from visible to the telecommunication wavelengths has been actively studied by using nonlinear optical media [10, 11, 12, 13, 14, 15, 16, 17]. In the first experimental demonstration employing a light field with a non-classical property, the wavelength of 795 nm which corresponds to the D1 line of the rubidium atoms are converted to 1367 nm by using a third-order optical nonlinearity in a rubidium atomic cloud [10, 11]. In Ref. [11], preservation of the entanglement between two photons after the frequency down-conversion was also observed. For a wide-band and a compact wavelength conversion, the difference frequency generation (DFG) via a second-order optical nonlinearity in a periodically-poled lithium niobate (PPLN) has been used and the preservation of the quantum state through the wavelength conversion from 780 nm which corresponds to the D2 line of the rubidium atom to 1522 nm has been demonstrated [15, 17]. The non-classical property of a light converted to 1313 nm from a 711-nm light emitted by a quantum dot has also been demonstrated [16]. In Ref. [14], the feasibility of the frequency down-conversion of a light at a single-photon level from 738 nm to 1557 nm by using the 1403-nm pump light has been shown for single-photon sources based on silicon-vacancy centers in diamond [18].
Another important wavelength which should be converted to the telecommunication bands for quantum communications is 637 nm corresponding to the resonant wavelength of the nitrogen-vacancy (NV) center in diamond [19]. The NV center in diamond is one of the promising candidates for the quantum memories with the ability to create the entanglement with photons [6]. In spite of a variety of demonstrations related to the NV centers in diamond in recent years [20, 21, 22, 23, 24, 25, 26], to the best of our knowledge, none of the demonstration of the frequency down-conversion from 637 nm to the telecommunication bands with the preservation of the non-classical property and/or the quantum information of the input light has been performed. In the experiment in Ref. [27], while the conversion from 633 nm to 1.56-m has been observed with a 1.06-m pump light, the signal-to-noise ratio (SNR) was not sufficient for the observation of the above mentioned properties.
In this paper, we demonstrate a low-noise wavelength conversion of a 637-nm light at a single-photon level to the telecommunication band by using a PPLN waveguide for realizing the efficient optical-fiber quantum communication based on NV centers in diamond [9]. The converted wavelength in this experiment is 1587 nm which is determined by the wavelength of 1064 nm of the cw pump light. In the experiment, we evaluate the performance of the wavelength converter, namely we clarify the overall conversion efficiency of the signal light and the amount of background photons induced by the conversion process. From the experimental results, we derive the intensity correlation and the average photon number of a converted telecom light pulse which are decided by those of a 637-nm input light pulse and the intrinsic property of the converter. Then we discuss the feasibility of the observation of non-classical property of the telecom light after the frequency down-conversion from a 637-nm light pulse. We found that when the transform-limited light pulse from the NV centers in diamond with a lifetime of 13.7 ns reported in Refs. [22, 23] is prepared with a probability above , the intensity correlation of the converted telecom photon will be below which indicates the non-classical property of the converted light.
2 Experiment
2.1 Experimental setup
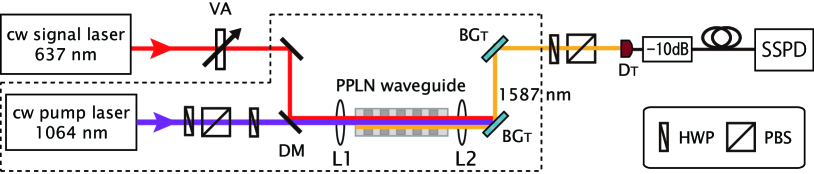
The experimental setup is shown in Fig. 1. The 637-nm signal light is taken from a vertical (V-) polarized cw external cavity laser diode with the linewidth of MHz and a maximum power of 9 mW. The power of the signal light input to the PPLN waveguide is adjusted by using a variable attenuator (VA) within the range from mW to a photon rate of MHz. We use a cw pump laser with the center wavelength of 1064 nm and the linewidth of MHz for the wavelength conversion. The power of the pump laser coupled to the PPLN waveguide is varied up to mW by a polarization beamsplitter (PBS) and a half-wave plate (HWP). The pump beam is set to the vertical polarization by a HWP and then it is combined with the signal beam by a dichroic mirror. The two beams are coupled to the PPLN waveguide by using an aspheric lens (L1) of mm with anti-reflective coating for both the signal light and the pump light.
The PPLN waveguide we used is a ridged-type waveguide, the cross section is square with 8-m wide, and the length of the waveguide is 23 mm. The period of periodically-poled structure is 11.5 m [28]. Due to the type-0 quasi-phase matching condition, the V-polarized signal photon at 637 nm is converted to the V-polarized telecom photon at 1587 nm with the V-polarized strong pump beam at 1064 nm. The temperature is controlled to be C. The acceptable bandwidth for 637-nm signal light of this waveguide is calculated to be 0.1 nm.
The output photons from the PPLN waveguide are collimated by an aspheric lens (L2) of mm with anti-reflective coating for the signal light, pump light and telecom light. Two Bragg gratings () with a bandwidth of 1 nm extract only the converted telecom light among them. The combined bandwidth of two is nm. The telecom light is coupled to the single-mode fiber (), and detected by a superconducting single-photon detector (SSPD) after passing through an attenuator of 10 dB for preventing the saturation of the detection counts. The SSPD has a cavity structure and its quantum efficiency denoted by is 60% [29].
2.2 Experimental results
In order to estimate an internal conversion efficiency of the frequency down-converter and an amount of background photons generated by the conversion process, we first estimate the transmittance of the overall optical circuit by measuring the power of the light before and after the optical components. The coupling efficiency of the signal light to the PPLN waveguide is . The diffraction efficiency of each of is . The telecom photons diffracted by the last pass through the HWP and PBS, and then enter . The efficiency of these processes is estimated to be . As a result, the transmittance of the optical circuit from the first to the front of the fiber attenuator is . The transmittance of the fiber attenuator is .
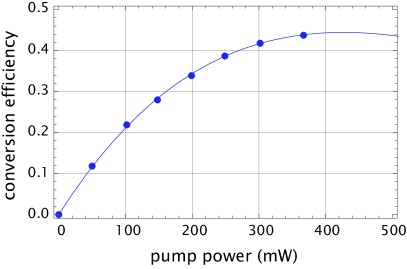
The internal conversion efficiency in the PPLN depending on the pump power is estimated by the observed output power of the converted light coupled to connected to a power meter instead of the fiber attenuator and the SSPD in Fig. 1. In this measurement, we set the power of the input light at 637 nm coupled to the PPLN waveguide to be W. From the observed values by the power meter and the estimated transmittance of the optical components, we estimate the internal conversion efficiencies of the photon number. The result is shown in Fig. 2. The conversion efficiency of the DFG process with a strong pump light is expected to be proportional to [8], where represents the pump power. The best fit to the observed conversion efficiency with gives and . The best conversion efficiency of 0.44 will be achieved at a pump power of mW.
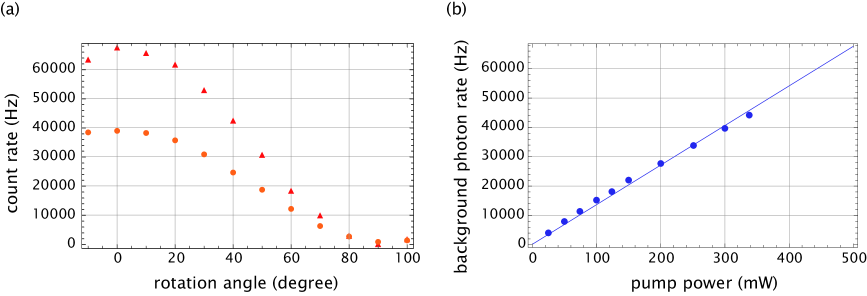
We evaluate the amount of background photons at the down-converted wavelength of 1587 nm. The background photons were measured when we turned off the signal light and input only the pump light to the PPLN waveguide. Before we investigate the dependency of the background photons on the pump power, we first see the polarization property of the background photons, which was performed by measuring the background photon counts with various rotation angles of the HWP in front of the last PBS. This measurement was performed at 300-mW pump power. The experimental result of the count rate of the background photons depending on the rotation angle is shown in Fig. 3 (a). The degree of polarization of the background photons was . The standard deviations of the observed values under the assumption of the Poisson statistics of the observed counts are less than . We note that when we measured the polarization property for the signal light, the degree of the polarization of the signal photons was over by subtracting the effect of the background photons from the observed counts. From the result, we see that while the polarization of the background photons are almost V polarized, a small number of the background photons are orthogonal to V polarization. In the following experiment, H polarization component of the background photons is reflected by the PBS in front of .
The dependency of the background photon rate on the pump power is shown in Fig. 3 (b). We see that the background photon rate linearly increase with the pump power. From this, we infer that the main cause of the noises is the Raman scattering of the strong pump light as reported in the previous experiments of the frequency down-conversion [14, 17]. In order to fit the data, we use the linear function of the photon count rate written as , where Hz is determined by an observed value of the dark count rate of the SSPD. The coefficient is estimated to be 135 Hz/mW. The internal background photon rate of the converter is Hz/mW. As a reference, we compare the intrinsic background photon generation rate due to the Raman scattering in this experiment with that in the demonstration for frequency down-conversion from 780 nm to 1522 nm in Refs. [15, 17] when these converters give the same internal conversion efficiency. The observed value of the Raman scattering in Ref. [17] was Hz/mW which was detected by a photon detector with the quantum efficiency of 0.125. In the report, the overall conversion efficiency just before the photon detector was 0.005 which includes the internal conversion efficiency of 0.07. From these values, the internal background photon rate is roughly estimated to be Hz/mW. The conversion efficiency for the cw signal light was with and [15, 17]. When the conversion efficiencies of the two converters are the same, the ratio of the background photon rate of the converter for the 637-nm light to that for the 780-nm light takes a maximum for . For the converter in Refs. [15, 17], is achieved at a pump power of mW, resulting in the background photon rate of Hz. For the converter in this paper, is given by the pump power of mW, resulting in the background photon rate of Hz. By using these values, the background photon rate introduced by the conversion process in this experiment is, at the most, twice as large as that in Refs. [15, 17].
3 Discussion
In this section, we discuss the performance of the demonstrated frequency down-converter for a pseudo single photon pulse emitted from the NV center in diamond based on our experimental results in the previous section. Here we estimate the well-known intensity correlation of the converted light pulse to see the ability of the frequency down-converter to preserve the non-classical property . We regard a part of the optical circuit including the PPLN and the two BGs as an essential part of the converter, which is the region surrounded by dashed lines in Fig. 1. In the following, we derive the intensity correlation and the average photon number of a converted telecom light pulse from the converter when those of a 637-nm signal light pulse are given.
Let us first derive the intensity correlation of a light pulse X which is a mixture of two statistically-independent light pulses A and B with the intensity correlation and and the average photon number and , where represents the photon number operator. The intensity correlation of each pulse is given by for . We also define the Fano factor , where . We then obtain . When the two light pulses A and B are statistically independent so that , the Fano factor of the light pulse X is calculated to be . As a result, the intensity correlation of the light pulse X is given by
| (1) | |||||
| (2) |
where is the ratio between the average photon numbers of the two light pulses. As we have seen in the previous section, the frequency down-converter adds the background photons in the output mode. Therefore the above relation (2) is useful for the estimation of the output light pulse.
Suppose that the intensity correlation of a 637-nm input light pulse is and the average photon number of the light is . For simplicity, we assume that the spectral width of the input light is much narrower than the acceptable bandwidth 0.1 nm of the frequency down-converter. We also assume that the background photons induced by the pump light follow the Poisson statistics, and are independent of the down-converted photons. It is convenient to replace these background photons by a noise source placed at the input of the down-converter. The average photon number of this equivalent input noise is then given by . Here is a measurement time window, and is a ratio of a filter bandwidth to the bandwidth of nm in the current experiment. Note that we assume that the bandwidth of the filter is much wider than the spectral width of the 637-nm signal light. The reason why the component of the background photons is proportional to and is that the background photons induced by the cw pump light for the wavelength conversion are temporally continuous and spectrally broad. From the observed values in the previous section as Hz/mW, , , , and with and , we calculate as . By substituting and in Eq. (2) by and , respectively, and by using , the intensity correlation of the output light pulse is given by
| (3) |
Because is the transmittance of the intrinsic part of the converter, we obtain the average photon number of the output light pulse to be
| (4) |
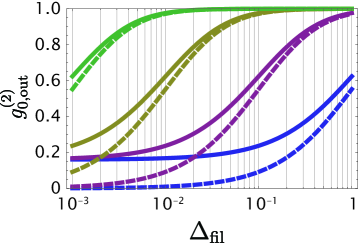
Below we borrow the observed value of and a lifetime of ns for the 637-nm light pulse from the NV center in the diamond nanocrystal reported in Ref. [22], and then we estimate the expected value of for the converted telecom light. We assume that the spectral width of the 637-nm light is close to the transform-limit so that it is much narrower than . We choose to collect the pulsed signal light over 99%, and use mW which achieves the maximum conversion efficiency in our experiment. From Eq. (3) and , we can calculate which is shown as a function of for in Fig. 4. As a reference, we also show for the converted telecom light when the 637-nm signal light has and the same lifetime.
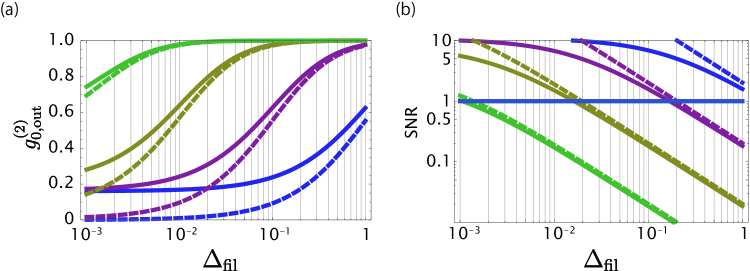
In practice, the apparent intensity correlation of the light measured by the Hanbury-Brown and Twiss setup [30] is affected by the dark count of the detectors. We assume that coupling efficiencies to the single-mode fibers and two photon detectors for the Hanbury-Brown and Twiss setup are the same as those used in our experiment, namely the transmittance of the optical circuit after the PPLN is , the quantum efficiency is , and the dark count rate is Hz. When a half BS is used for the measurement of , an expected observed value of for the converted telecom light as a function of is shown in Fig. 5 (a). From the figure, even for , we see a non-classical intensity correlation of the converted telecom light at which corresponds to about MHz. Using Eq. (2), we also calculate an expected SNR of the converted telecom light at the each detector under the assumption that the 637-nm light is a mixture of two statistically-independent light sources composed of an ideal single photon and background photons that follow the Poisson statistics, and show the results in Fig. 5 (b).
In the above estimation, we assumed the spectral bandwidth of the 637-nm signal light is much smaller than the acceptable bandwidth 0.1 nm of PPLN crystal and the filter bandwidth , where nm, while it was not satisfied in the experiment reported in Ref. [22] due to the inhomogeneous broadening at the room temperature. On the other hand, recently a transform-limited narrow bandwidth light pulse from the zero phonon line of a NV center in a bulk diamond at a low temperature has been reported in Ref. [20]. In addition, there are several studies for efficient collection of the light from NV center using a solid immersion lens [21] and a photonic crystal cavity [31]. When such experimental efforts will meet our requirements of the 637-nm signal light in the near future, the demonstrated low noise frequency down converter will achieve the conversion of the non-classical light from the NV centers to the telecom band.
4 Conclusion
In conclusion, we have demonstrated that the low noise frequency down-conversion of the photon at 637 nm which corresponds to a resonant wavelength of the NV center in diamond to the telecommunication band. The analysis based on our experimental results shows that if the transform-limited light pulse from the NV center in diamond is prepared even with a probability of , the intensity correlation of the telecom light after the frequency down-conversion with the proper frequency filtering will be well below 1. We believe that the result will lead to the efficient connection between solid-state devices composed of the NV center in diamond and telecom fiber networks.
Acknowledgements
This work was supported by the Funding Program for World-Leading Innovative R & D on Science and Technology (FIRST), MEXT Grant-in-Aid for Scientific Research on Innovative Areas 21102008, MEXT Grant-in-Aid for Young scientists(A) 23684035, JSPS Grant-in-Aid for Scientific Research(A) 25247068 and (B) 25286077.