Magnetic short and long range order in PbFe1/2Ta1/2O3
Abstract
PbFe1/2Ta1/2O3 belongs to the family of PbBBO3 which have inherent chemical disorder at the B-site. Due to this disorder, a complex magnetic phase diagram is expected in the material. In this paper, we report experimental results of magnetic properties of PFT through macroscopic characterization, neutron scattering and Mössbauer spectroscopy techniques. With these results we show for the first time that PbFe1/2Ta1/2O3 behaves very similar to PbFe1/2Nb1/2O3 , i.e, it undergoes AF transition at 153 K and has a spinglass transition at 10 K, below which the antiferromagnetism coexists with spinglass. We suggest that the mechanism which is responsible for such a non-trivial ground state can be explained by a speromagnet-like spin arrangement similar to the one proposed for PbFe1/2Nb1/2O3 .
pacs:
75.50.Ee Antiferromagnetic materials; 75.50.Lk Spin glasses; 76.80.+y Mössbauer spectroscopy of solids; 28.20.Cz Neutron scatteringI Introduction
Studies of disordered materials have gained interest due to novel phases and phase transitions they exhibit Dagotto (2005); Gabay and Toulouse (1981); Palmer et al. (1984); Viet and Kawamura (2009). ABBO3 are complex perovskites which have inherent disorder at the B-site resulting in unusual properties. In particular, magnetic ion dilution at the disordered B-site leads to rich magnetic phase diagram and magnetic ground states ranging from simple antiferromagnet to incommensurate structures Smolenskii and Chupis (1982). Furthermore, spinglass properties have also been reported in some of the complex disordered perovskites Falqui et al. (2005); Choudhury et al. (2012); Battle et al. (1989). More recently, our studies of the disordered antiferromagnet PbFe1/2Nb1/2O3 (PFN ) demonstrated that long range antiferromagnetic order can co-exist with a spinglass state on the microscopic scale Chillal et al. (2013). Below we refer to this ground state as AFSG.
Coexistence of long-range and spinglass orders have been studied in disordered ferromagnetic materials both theoretically and experimentally Gabay and Toulouse (1981); Lauer and Keune (1982); Ryan et al. (2003); Ren and Ryan (1995); Ryan et al. (2000); Mirebeau et al. (1997); Abd-Elmeguid et al. (1986); Campbell et al. (1983). For example, for reentrant spinglasses in amorphous metallic compounds Fe-Mn Lauer and Keune (1982); Ryan et al. (2003), Fe-Zr Ren and Ryan (1995); Ryan et al. (2000), Au-Fe Campbell et al. (1983); Abd-Elmeguid et al. (1986) a spin canting along with transverse spin freezing was considered as a mechanism of coexistence. Random transverse spin freezing scenario for occurrence of such a ground state is predicted by mean-field theory Gabay and Toulouse (1981).
On a similar footing we explained a novel AFSG phase in the crystalline disordered perovskite PFN through canting of magnetic moments of Fe3+ culminated in their freezing Chillal et al. (2013). What remained unclear is whether the essential ingredients for such spin arrangement is disorder and magnetic dilution themselves or the particular magnetic ion at the disordered site. An extensive study of influence of the non-magnetic ions on the phase diagram of PFN allows us to better understand magnetic ground states in ABBO3 type complex perovskites. To date, the role played by non-magnetic ions in formation of AFSG state in these perovskites remains unclear. Previous studies of PFN diluted by non-isovalent Ti4+ at the Fe/Nb site or by isovalent Ba2+ at the Pb site suggested that its magnetic properties are indeed strongly affected by the type of non-magnetic ion in the lattice Laguta et al. (2013). In the present work we make the next logical step and focus on the fully substituted stoichiometric lead iron tantalate, PbFe1/2Ta1/2O3 (PFT ), a close relative of PFN . In this case the Nb5+ ion is isovalently substituted by Ta5+. The chemical structures of both materials are essentially identical Lampis et al. (1999); Bonny et al. (1997). Despite the strong structural similarities, magnetic properties of PFT are not very well understood in contrast to the generally accepted antiferromagnetic (143 K) and spinglass (12 K) transitions in PFN Kumar et al. (2008); Rotaru et al. (2009); Kleemann et al. (2010); Chillal et al. (2013). One of the challenges with PFT is that indications of the magnetic transitions in dc magnetic susceptibility are strongly sample-dependent. For example, various sources reported AF transitions through anomalies in the dc magnetization in the range of 130-180 K Lampis et al. (2000); Shvorneva (1966); Nomura et al. (1968); Martinez et al. (2010). This transition was confirmed by the appearance of AF Bragg peak in neutron diffraction Ivanov et al. (2001) suggesting a simple G-type structure with 3 magnetic moment per Fe3+ ion at base temperature Ivanov et al. (2001). However, first principle calculations of the electronic structure of PFT suggested possibility of a second AF transition Lampis et al. (2004) at 48 K which was claimed to be observed experimentally at 55 K by Martinez et.al Martinez et al. (2010). In addition, the dc susceptibility results by Falqui et. al showed a maximum in ZFC data around 9 K which exhibits properties of a spinglass transition Falqui et al. (2005). Overall, there is uncertainty in the number and types of magnetic phases in PFT .
In the present work we seek to sort out the magnetic phase diagram of PbFe1/2Ta1/2O3 . We employ bulk magnetization, neutron scattering and Mössbauer spectroscopy to elucidate magnetic phase diagram. In order to eliminate metallurgical problems in identifying the temperatures of magnetic transitions, we studied ceramic and single crystal specimens. Both types of samples show similar transition temperatures. Our results prove that PFT undergoes two magnetic phase transitions: an AF transition below T153 K and, a SG transition below T10 K similar to the one observed by Falqui et al Falqui et al. (2005). Neutron scattering results suggest appearance of short-range magnetic correlations contributing to SG already below 50 K. Combining the AF Bragg peak observed by neutron scattering with Mössbauer spectroscopy we show that the magnetic state of PFT below TSG is a microscopically coexisting antiferromagnetic spinglass phase. These results, therefore, enable us to state that the magnetic phase diagram of PFT is identical to PFN despite having a different non-magnetic ion sharing Fe3+.
II Samples & Experimental Methods
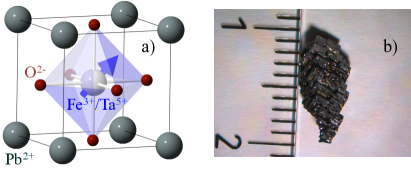
PFT crystallizes in a cubic perovskite structure with Pb2+ ions residing at corners of the unit cell, while oxygen octahedra surrounds Fe3+/Ta5+ ions as shown in Fig. 1a. The Fe3+ and Ta5+ ions are believed to be randomly distributed over the B-site of the lattice. Upon lowering the temperature PFT undergoes several structural phase transitions. However, the distortions involved are rather insignificant Lampis et al. (2000); Smolenskii (1984).
The PFT samples used in the present study were synthesized with the same procedure as employed for PFN Chillal et al. (2013); Kumar et al. (2008). The essential difference is that the sintering temperatures for PFT are 1100 ∘C, 1250 ∘C for ceramics and single crystals respectively.
Macroscopic measurements were made on ceramics and single crystals of PFT using a Physical Property Measurement System (PPMS). Conventional Mössbauer absorption spectroscopy experiments were conducted with the help of He-flow cryostat in transmission geometry on a powder of PFT with natural abundance of 57Fe. Neutron scattering experiments were performed at the cold 3-axis spectrometer TASP (SINQ, Switzerland). A high-quality single crystal of PFT (see Fig. 1b) was aligned in the scattering plane in cubic notation so that the AF Bragg peak at the Lampis et al. (2000) position is reachable. Most of the neutron data were collected using and a collimation of open-80′-sample-80′-80′. Higher resolution results were obtained with collimation of open-20′-sample-20′-20′. A liquid nitrogen cooled Be-filter was used to suppress higher order contaminations. For polarized neutron diffraction, the MuPAD setup Janoschek et al. (2007) was employed with a spectrometer configuration , leading to effective collimation open-80′-sample-80′-open. All the neutron data are analyzed by convoluting the respective scattering function with resolution of the spectrometer using ResLib package Zheludev (2007). The calculated resolution reproduces the measured Bragg peaks (110) and leading to effective sample mosaicity values of 12′ and 20′ respectively in 20′-collimation and 80′-collimation setups. The effective mosaicity that is obtained for polarized data is 27′.
III Results
III.1 Bulk Magnetization
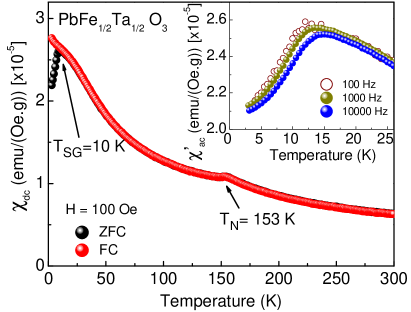
Two magnetic phase transitions of PFT are immediately detected in macroscopic experiments. Fig. 2 shows the dc magnetic susceptibility of PFT powder taken in field-cooled (FC) and zero-field-cooled (ZFC) protocols as a function of temperature. At T153 K, PFT undergoes paramagnetic (PM) to AF transition Lampis et al. (2000); Shvorneva (1966); Nomura et al. (1968); Martinez et al. (2010); Ivanov et al. (2001), while the low-temperature anomaly seen as a splitting of ZFC and FC data around 10 K suggests a second transition from AF into SG phase Falqui et al. (2005); Martinez et al. (2010). The SG nature of this transition is further verified by gradual frequency dependence of ac susceptibility. Inset of Fig. 2 shows a rounded peak around TSG whose maximum shifts to higher temperatures upon increasing the field frequency. Additional measurements performed on collections of small single crystals of PFT give essentially the same results with T158 K and T9 K. So we conclude that the PFT samples with very different metallurgy have similar macroscopic properties.
Macroscopic methods alone are insufficient to properly explore the magnetic phases of PFT . The development of short range magnetic correlations and the very presence of AF long-range order (LRO) in the SG state is best probed with neutron scattering.
III.2 Neutron Scattering
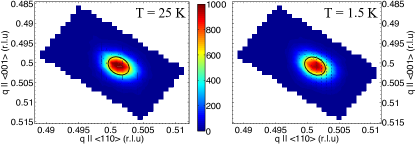
As mentioned earlier, PFT has G-type Ivanov et al. (2001) long-range AF order which produces a Bragg peak at position in neutron diffraction. Fig. 3 shows a color map of this Bragg peak measured in a high-resolution set up above and below TSG. As depicted in the figure, we observe a sharp resolution limited AF Bragg peak intensity that remains undisturbed while passing through SG transition. Meaning, the true LRO persists into the SG phase.
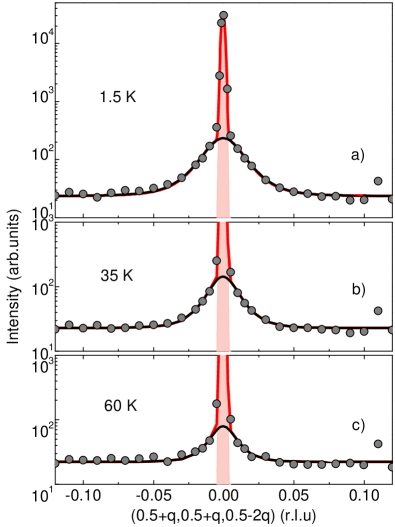
In addition to the LRO, short-range correlations can also be observed by neutron diffraction in the form of diffuse scattering (DS). In our material, these short-range correlations give rise to a broad peak under the sharp AF Bragg reflection as shown in Fig. 4. Relatively big single crystal of PFT had to be used for these measurements in order to investigate the weak neutron DS signal. As a result the intensities of nuclear and possibly magnetic Bragg peaks suffer from extinction effects. Hence, the temperature evolution of ordered magnetic moment could not be studied in our experiments.
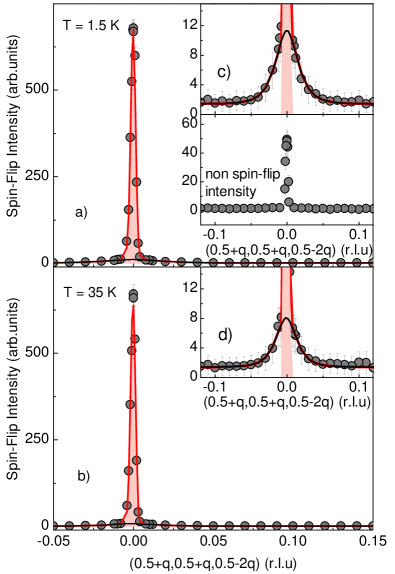
Having observed these short-range correlations, the first step is to verify their magnetic origin. For this, we make use of polarized neutron scattering with neutron polarization vector parallel to the scattering vector . In this geometry, scattering due to magnetic moments flips the direction of polarization whereas, the polarization state is retained if the scattering is of coherent nuclear origin. In PFT , the entire AF and DS intensity is observed in the spin-flip channel as shown in Fig. 5. There is nearly no scattering in non spin-flip channel as indicated in the the inset of Fig. 5a. Therefore, we conclude that these short-range correlations are of magnetic origin. To obtain the time scale of the short-range correlations we have measured several inelastic scans through magnetic DS around AF Bragg peak. We find that the fluctuations corresponding to these correlations occur on the timescale longer than 10-11 s and therefore refer to quasi-static nature. Having established that the short-range correlations are magnetic and essentially static, we further assumed that they decay exponentially () with distance with some characteristic correlation length . An exponential decay implies a lorentzian-squared form for the structure factor of the diffuse scattering. The total structure factor for quasielastic scattering is then written as:
| (1) | |||||
| (2) | |||||
| (3) |
where ) and are the Bragg and DS contributions, respectively. , are temperature dependent integrated intensities of the AF and DS contributions respectively and , inverse correlation length of DS such that .
The best fits of the data to the resolution convoluted scattering function defined above are shown by solid lines in Figs. 4, 5.
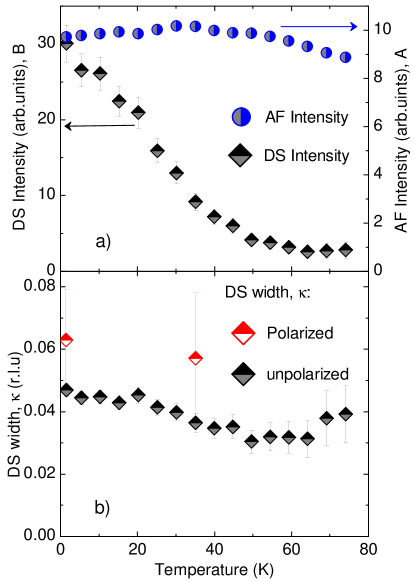
Performing this analysis at each temperature we get T-dependence of the inverse correlation length , as well as the intensities of the Bragg and diffuse components (Fig. 6). Intensity of the AF Bragg peak remains nearly unchanged in the covered temperature range as shown in Fig. 6a. The intensity of DS is weak and remains nearly constant for T K. However, it increases rapidly upon lowering the temperature below 50 K. The width of the DS remains almost constant as shown in Fig. 6b, and the corresponding average correlation length is 102 Å.
III.3 Mössbauer spectroscopy
While neutron scattering provides information on spatial correlations of magnetization, microscopic techniques give a more precise measurement of the distribution of local magnetization. Specifically, in our previous studies of PFN , a clear proof of coexisting AF and SG order parameters was obtained in Mössbauer spectroscopy experiments. In this work we used a similar approach for PFT .
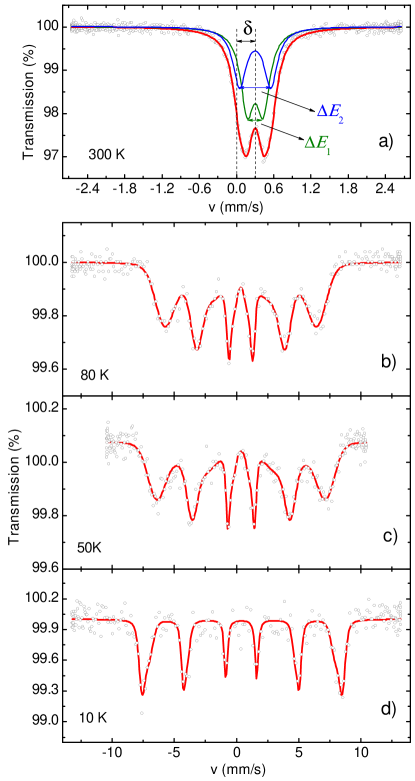
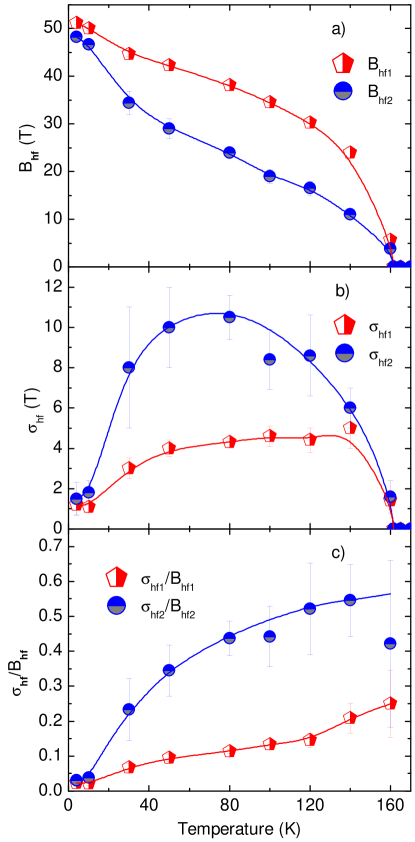
Fig. 7 shows representative Mössbauer spectra of PFT above and at several temperatures below TN. The spectrum taken above Néel temperature, at T = 300 K, is shown in Fig. 7a. It exhibits a doublet structure with its center of weight shifted to = 0.301(2) mm/s (with respect to energy of source kept at room temperature). This isomer shift is mainly determined by the chemical shift and clearly corresponds to trivalent state of Fe. The doublet shape in the spectrum arises due to quadrupolar splitting produced by a non-spherical charge distribution around Fe3+ ion. Attempts to fit the spectrum of Fig. 7a assuming one electric field gradient acting at Fe3+, lead to unsatisfactory description with high and an excessive line broadening. Instead, an adequate fit is achieved by assuming two contributions to the quadrupolar splittings , as shown in Fig. 7a. Having two quadrupolar splittings at a single iron site is not surprising, as PFT is already in the ferroelectric phase at T = 300 K and an additional deviation from the spherical approximation can be induced by different formal charges of disordered Fe3+ and Ta5+ ions. The ratio of areas of two components in the spectra is found to be 0.57(3):0.43(3).
Below the Néel temperature (Figs. 7b-d), the Mössbauer spectra of PFT exhibit a sextet pattern. This is to be interpreted as a direct evidence of Zeeman splitting of nuclear levels induced by the spontaneous magnetization of the material. No central (unsplit doublet) contribution similar to the spectrum shown in Fig. 7a could be detected. This rules out the existence of remaining paramagnetic clusters Nomura et al. (1968) below TN and clearly indicates that all Fe3+ in PFT are involved in creating AF long range order. The nuclear-quadrupole splitting which was the dominant effect of the spectra in the paramagnetic state is not detected below TN. This points to a wide distribution of the angles between the iron spins and the local axes of the electric field gradient tensor in the AF state. The sextet itself is noticeably broadened at higher temperatures. At base temperature this broadening nearly vanishes and sharp absorption lines are observed, indicating static and rather uniform local fields around Fe3+ sites.
To obtain more quantitative information from Mössbauer data, the spectra taken below TN were fitted with hyperfine fields having Gaussian distributions (see Fig. 7(b)-(d)). A consistent fit for all the spectra can be obtained with a single isomer shift for Fe3+ assuming two distributions of the hyperfine fields in the same ratio as was inferred from the data in paramagnetic phase. Fig. 8a shows the temperature dependences of the amplitudes of both hyperfine fields Bhf1, Bhf2. Bhf for the two contributions increases smoothly on cooling from TN down to 50 K. Below 50 K a faster increase of Bhf is observed, and both finally reach essentially the same value of 50 T at 4 K. This value is very close to the saturated hyperfine field in other Fe containing oxides Chillal et al. (2013),Shirane et al. (1962) and thus suggests that Fe3+ in PFT recovers a full moment at base temperature. The strong temperature dependence of widths , (see Fig. 8b) suggests that the origin of observed distributions of the hyperfine fields is due to dynamic fluctuations. This dynamic nature is seen even better through the temperature evolution of the ratio shown in Fig. 8c. These relative widths of Bhf1 and Bhf2 decrease monotonically as temperature is lowered. For both contributions it reaches the same and vanishingly small value at base temperature. This implies negligible contribution from static fluctuations to the broadening of the Mössbauer spectra.
The features of the Mössbauer spectra below TSG unambiguously confirm a homogeneous environment for all Fe3+ ions in the system, and a uniformity of the magnitude of the moments at saturation. Since neutron scattering demonstrated an increase of short-range correlations in this regime, we conclude that the disorder at low temperature is purely orientational. In addition, the slowing down of hyperfine field fluctuations results in a rapid increase of local Fe moment below 50 K. In contrast, the ordered magnetic moment seen by neutrons remains nearly unchanged (possibly reduces slightly) below this temperature. A clear difference in the behavior of local and staggered magnetic moments below K indicates canting of Fe moments. A similar behavior was observed in amorphous metallic glasses Fe-Mn, Fe-Zr, Au-Fe and was ascribed to the spin canting Ryan et al. (2003); Ren and Ryan (1995); Campbell and Senoussi (1992). This further validates our interpretation of the observations for PFT . Therefore, these results for PFT support the same scenario for the AFSG phase, that we previously suggested for PFN.
IV Summary
In summary, we have shown that the magnetic properties of PFT are essentially identical to those of PFN . PFT undergoes only two magnetic phase transitions: one of which is AF (T153 K) and the other is SG (T10 K) to the AFSG ground state, contrary to the previous claims of two Néel temperatures, namely T160 K and T48 K Lampis et al. (2004); Martinez et al. (2010). Our experiments allow us to associate the latter temperature with the enhancement of magnetic short-range correlations in the sample which are further developed as is approached. These correlations are revealed by an increase of the integrated intensity of DS scattering (Fig. 6a), a similar feature also observed in PFN . In PFT , the measured correlation length 10 corresponds to nearly two lattice constants which clearly suggests that magnetic interactions beyond first nearest-neighbor are important.111It should be noted that the correlation length calculated for PFN by Rotaru et. al Rotaru et al. (2009) would be 10 if a 4D convolution is performed and a squared Lorentzian is used to fit DS.
Through temperature evolution of Mössbauer spectra, we observe that the fluctuations in hyperfine field slow down as TSG is approached, in accordance with increasing intensity of short-range correlations.
To conclude, the nature of the magnetic phases and specifically the microscopic coexistence of long range AF and orientational SG order are a common feature of stoichiometric disordered PbFe1/2B1/2O3 perovskites. A non-isovalent dilution on the B-site affects the LRO as well as the ground state Laguta et al. (2013). We establish that as long as the dilution is isovalent, the non-magnetic ions do not produce a strong effect on the magnetic phase transitions in this family.
References
- Dagotto (2005) E. Dagotto, Science 309, 257 (2005).
- Gabay and Toulouse (1981) M. Gabay and G. Toulouse, Phys. Rev. Lett. 47, 201 (1981).
- Palmer et al. (1984) R. G. Palmer, D. L. Stein, E. Abrahams, and P. W. Anderson, Phys. Rev. Lett. 53, 958 (1984).
- Viet and Kawamura (2009) D. X. Viet and H. Kawamura, Phys. Rev. Lett. 102, 027202 (2009).
- Smolenskii and Chupis (1982) G. A. Smolenskii and I. E. Chupis, Sov. Phys. Usp. 25, 475 (1982).
- Falqui et al. (2005) A. Falqui, N. Lampis, A. G. Lehmann, and P. Gabriella, J. Phys. Chem. B 109, 22967 (2005).
- Choudhury et al. (2012) D. Choudhury, P. Mandal, R. Mathieu, A. Hazarika, S. Rajan, A. Sundaresan, U. V. Waghmare, R. Knut, O. Karis, P. Nordblad, and D. D. Sarma, Phys. Rev. Lett. 108, 127201 (2012).
- Battle et al. (1989) P. D. Battle, T. C. Gibb, C. W. Jones, and F. Studer, Journal of Solid State Chemistry 78, 281 (1989).
- Chillal et al. (2013) S. Chillal, M. Thede, F. J. Litterst, S. N. Gvasaliya, T. A. Shaplygina, S. G. Lushnikov, and A. Zheludev, Phys. Rev. B 87, 220403 (2013).
- Lauer and Keune (1982) J. Lauer and W. Keune, Phys. Rev. Lett. 48, 1850 (1982).
- Ryan et al. (2003) D. H. Ryan, A. D. Beath, E. McCalla, J. van Lierop, and J. M. Cadogan, Phys. Rev. B 67, 104404 (2003).
- Ren and Ryan (1995) H. Ren and D. H. Ryan, Phys. Rev. B 51, 15885 (1995).
- Ryan et al. (2000) D. H. Ryan, J. M. Cadogan, and J. van Lierop, Phys. Rev. B 61, 6816 (2000).
- Mirebeau et al. (1997) I. Mirebeau, M. Hennion, M. Gingras, A. Keren, K. Kojima, M. Larkin, G. Luke, B. Nachumi, W. Wu, Y. Uemura, I. Campbell, and G. Morris, Hyperfine Interactions 104, 343 (1997).
- Abd-Elmeguid et al. (1986) M. M. Abd-Elmeguid, H. Micklitz, R. A. Brand, and W. Keune, Phys. Rev. B 33, 7833 (1986).
- Campbell et al. (1983) I. A. Campbell, S. Senoussi, F. Varret, J. Teillet, and A. Hamzić, Phys. Rev. Lett. 50, 1615 (1983).
- Laguta et al. (2013) V. V. Laguta, M. D. Glinchuk, M. Maryško, R. O. Kuzian, S. A. Prosandeev, S. I. Raevskaya, V. G. Smotrakov, V. V. Eremkin, and I. P. Raevski, Phys. Rev. B 87, 064403 (2013).
- Lampis et al. (1999) N. Lampis, P. Sciau, and A. G. Lehmann, J. Phys.: Condens. Matter 11, 3489 (1999).
- Bonny et al. (1997) V. Bonny, M. Bonin, P. Sciau, K. J. Schenk, and G. Chapuis, Solid State Commun. 102, 347 (1997).
- Kumar et al. (2008) A. Kumar, R. S. Katiyar, C. Rinaldi, S. G. Lushnikov, and T. A. Shaplygina, Appl. Phys. Lett. 93, 232902 (2008).
- Rotaru et al. (2009) G. M. Rotaru, B. Roessli, A. Amato, S. N. Gvasaliya, C. Mudry, S. G. Lushnikov, and T. A. Shaplygina, Phys. Rev. B 79, 184430 (2009).
- Kleemann et al. (2010) W. Kleemann, V. V. Shvartsman, P. Borisov, and A. Kania, Phys. Rev. Lett. 105, 257202 (2010).
- Lampis et al. (2000) N. Lampis, P. Sciau, and A. G. Lehmann, Powder Diffr. 12, 2367 (2000).
- Shvorneva (1966) L. I. Shvorneva, Soviet Phys. JETP 22, 722 (1966).
- Nomura et al. (1968) S. Nomura, H. Takabayashi, and T. Nakagawa, Jpn. J. Appl. Phys. 7, 600 (1968).
- Martinez et al. (2010) R. Martinez, R. Palai, H. Huhtinen, J. Liu, J. F. Scott, and R. S. Katiyar, Phys. Rev. B 82, 134104 (2010).
- Ivanov et al. (2001) S. A. Ivanov, S. Eriksson, N. W. Thomas, R. Tellgren, and H. Rundolf, J. Phys.: Condens. Matter 13, 25 (2001).
- Lampis et al. (2004) N. Lampis, C. Franchini, G. Satta, A. Geddo-Lehmann, and S. Massidda, Phys. Rev. B 69, 064412 (2004).
- Smolenskii (1984) G. A. Smolenskii, Ferroelectrics and Related Materials (Gordon and Breach, New York, 1984).
- Janoschek et al. (2007) M. Janoschek, S. Klimko, R. Gähler, B. Roessli, and P. Böni, Physica B 397, 125 (2007).
- Zheludev (2007) A. Zheludev, “Reslib 4.2,” (2007), http://www.neutron.ethz.ch/research/resources/reslib.
- Shirane et al. (1962) G. Shirane, D. Cox, and S. L. Ruby, Phys. Rev. 125, 1158 (1962).
- Campbell and Senoussi (1992) I. A. Campbell and S. Senoussi, Philosophical Magazine Part B 65, 1267 (1992).
- Note (1) It should be noted that the correlation length calculated for PFN by Rotaru et. al Rotaru et al. (2009) would be 10 if a 4D convolution is performed and a squared Lorentzian is used to fit DS.