Pinpointing the Molecular Gas within a Ly Blob at 2.7
Abstract
We present IRAM Plateau de Bure Interferometer observations of the CO(3–2) and CO(5–4) line transitions from a Ly blob at 2.7 in order to investigate the gas kinematics, determine the location of the dominant energy source, and study the physical conditions of the molecular gas. CO line and dust continuum emission are detected at the location of a strong MIPS source that is offset by 1.5″ from the Ly peak. Neither of these emission components is resolved with the 1.7″ beam, showing that the gas and dust are confined to within 7 kpc from this galaxy. No millimeter source is found at the location of the Ly peak, ruling out a central compact source of star formation as the power source for the Ly emission. Combined with a spatially-resolved spectrum of Ly and He II, we constrain the kinematics of the extended gas using the CO emission as a tracer of the systemic redshift. Near the MIPS source, the Ly profile is symmetric and its line center agrees with that of CO line, implying that there are no significant bulk flows and that the photo-ionization from the MIPS source might be the dominant source of the Ly emission. In the region near the Ly peak, the gas is slowly receding (100 km s-1) with respect to the MIPS source, thus making the hyper-/superwind hypothesis unlikely. We find a sub-thermal line ratio between two CO transitions, / = 0.97 0.21. This line ratio is lower than the average values found in high- SMGs and QSOs, but consistent with the value found in the Galactic center, suggesting that there is a large reservoir of low-density molecular gas that is spread over the MIPS source and its vicinity.
Subject headings:
galaxies: formation — galaxies: high-redshift — intergalactic medium — radio lines: galaxies — submillimeter: galaxies1. Introduction
Giant Ly nebulae (also known as “Ly blobs”) are large (50–100 kpc) spatially extended regions emitting copious amounts of Ly emission [(Ly) 1043-44 erg s-1 ] (e.g., Keel et al., 1999; Steidel et al., 2000; Francis et al., 2001; Matsuda et al., 2004, 2011; Dey et al., 2005; Saito et al., 2006; Smith & Jarvis, 2007; Ouchi et al., 2009; Prescott et al., 2009, 2012a; Yang et al., 2009, 2010; Erb et al., 2011). They may represent sites of massive galaxy formation and their early interaction with the intergalactic medium. However, the questions of what powers these gigantic gas halos and whether the surrounding gas is outflowing from or infalling into the embedded galaxies are still debated. The proposed scenarios include photo-ionization by AGNs (Geach et al., 2009), shock-heated gas by galactic superwinds (Taniguchi & Shioya, 2000), cooling radiation from cold-mode accretion (Fardal et al., 2001; Haiman, Spaans, & Quataert, 2000; Dijkstra & Loeb, 2009; Goerdt et al., 2010), and resonant scattering of Ly from star-forming galaxies (Steidel et al., 2011; Hayes et al., 2011). However, observations of Ly blobs currently allow no firm conclusions about their nature. For example, less than 20% of blobs are found to contain X-ray luminous AGN (Geach et al., 2009) implying that a powerful AGN is not always required for producing the extended halo (see also Yang et al., 2009). Yet Overzier et al. (2013) argue strongly that most are powered by AGN. It has long been believed that Ly blobs undergo intense dusty starbursts like submillimeter galaxies (Ivison et al., 1998; Chapman et al., 2004; Geach et al., 2005), but recent studies show that most Ly blobs are not as luminous at rest-frame far-infrared (FIR) wavelengths as submillimeter galaxies (Yang et al., 2012; Tamura et al., 2013).
The molecular gas content in Ly blobs has to date remained unconstrained, despite numerous attempts to detect CO emission (Chapman et al., 2004; Yang et al., 2012; Wagg & Kanekar, 2012). Observations of the molecular gas component in these systems are key to determining the physical conditions in the star-forming gas, the star formation efficiency, and constraining various relevant timescales and the role of feedback. CO emission lines are also a useful tool as a tracer of the systemic redshift, without which it is difficult to constrain the gas kinematics within a given system. For example, previous studies of the same Ly blob using only Ly emission line have led to radically different conclusions about the gas kinematics, suggesting that gas is outflowing in stellar or AGN winds (Wilman et al., 2005), inflowing due to gas accretion (Dijkstra et al., 2006b), or even static (Verhamme et al., 2008). These discrepancies mainly arise because the systemic velocities of the galaxies within the Ly blob are not directly measured, but rather need to be assumed (see also Bower et al., 2004; Weijmans et al., 2009). While other nebular lines in the UV/optical such as [O III] and H have been used to constrain the systemic velocity within a small sample of Ly blobs (e.g., Yang et al., 2011; McLinden et al., 2013), they are strongly susceptible to extinction and are only detectable from the ground over a restricted redshift range due to atmosphere. In such cases, the far infrared emission lines such as CO and [C II] 158m are ideal probes to determine the systemic redshift of the system, should they harbor a cold molecular component.
In this paper, we discuss new Plateau de Bure Interferometer (PdBI) observations of the CO = 3 2 and = 5 4 line transitions from one of the most luminous Ly blobs (LABd05; Dey et al., 2005). Originally discovered due to its strong Spitzer MIPS 24m flux, LABd05 has been the subject of many multi-wavelength studies. Spitzer and high resolution HST optical/NIR observations show that this giant Ly nebula is composed of a strong MIPS source and 17 small compact galaxies (Prescott et al., 2012b). The peak of the Ly emission is substantially offset from all the galaxies (e.g., 1.5″ from the MIPS source), but is coincident with a detection in He II emission. Prescott et al. (2008) found that LABd05 inhabits an overdense environment, suggesting that it may be the progenitor of a rich galaxy group or low-mass galaxy cluster. The SED of the bright MIPS source within LABd05 can be explained by an AGN-dominated template with a FIR luminosity of (40–1000m) = 41012 (Dey et al., 2005; Bussmann et al., 2009; Yang et al., 2012), although it is not yet clear whether the far-IR luminosity is driven primarily by star-formation or AGN activity (Colbert et al., 2011). The MIPS source contributes the bulk of the bolometric luminosity from the region and has a very extreme rest-frame UV-to-mid-IR color that characterizes it as a heavily dust-obscured galaxy (DOG; Dey et al., 2008; Prescott et al., 2012b). On the other hand, the kinematics of Ly-emitting gas have not been fully constrained. While the Keck Low Resolution Imaging Spectrometer (LRIS) longslit spectroscopy shows that there is a monotonic (and approximately linear) velocity gradient across the Ly blob (maybe due to rotation, outflow or infall), the interpretation of this signature was ambiguous because of the lack of the systemic redshift of the embedded galaxies, possibly the center of the gravitational potential of the blob (Dey et al., 2005). Previous attempts to detect the CO emission in LABd05 using the IRAM-30m yielded only upper limits Yang et al. (2012). Here, we present new PdBI interferometric observations of LABd05 that reveal detections of the dust continuum emission and CO emission lines from the system.
This paper is organized as follows. In §2, we describe our PdBI observations. In §3.1, we present the detection of molecular gas from LABd05. In §3.2, we constrain the gas kinematics of the Ly-emitting gas using the systemic redshift derived from CO and He II lines. In §3.3, we use the CO line SED to study physical conditions in star-forming regions. In §3.4, we present the FIR SED and derive constraints on the dust properties of LABd05. In §4.1, we discuss some plausible physical models for LABd05. Section 5 summarizes our conclusions. Throughout this paper, we adopt the following cosmological parameters: = 70 , , and .
2. Observations and Data Analysis
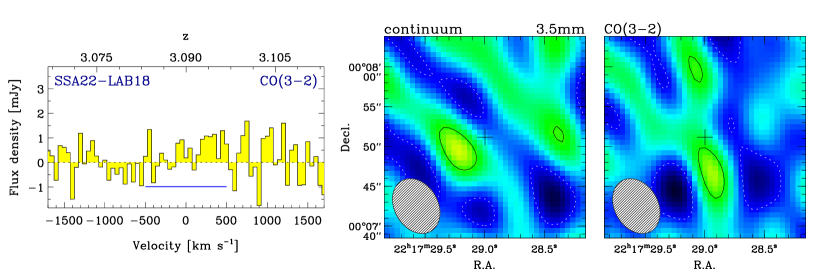
PdBI observations of the CO J = 3–2 transition for LABd05 were carried out using the WideX receiver (3 mm band) in June – August 2012 (project ID: W04E) over 9 observing sessions. At the same time, we targeted another Ly blob SSA22–LAB18 (R.A. = 22h 17m 28.99s, decl. = +00° 07′ 51.2″), a source originally discovered by Matsuda et al. (2004) and known to host an SMG with = 11 mJy (Geach et al., 2005). These two Ly blobs were selected mainly because they are the brightest in the (sub)mm among the sources accessible from PdBI.
Data were collected in the compact D configuration with four or five antennae and baselines ranging between 24 m and 112 m. The total bandwidth of the dual polarization mode was 3.6 GHz corresponding to 12000 km s-1. We tuned the receiver to = 94.58 GHz and 84.55 GHz, the redshifted CO(3–2) frequency at = 2.656 (LABd05) and 3.090 (SSA22-LAB18), respectively. The on-source integration times equivalent to the full six-antenna array were 4.7 and 5.5 hours for LABd05 and SSA22–LAB18, respectively. The water vapor ranged between 5 mm and 12 mm on different sessions. The data were calibrated through observations of bandpass (3C279, 2013+370, 2200+420) phase/amplitude (1308+326, 1417+385, 1504+377) and flux calibrators (MWC349) for LABd05. For SSA22–LAB18, we used bandpass (3C454.3, 2013+370, 2200+420), phase/amplitude (2230+114, 2145+067) and flux (MWC349, 2200+420) calibrators. Phase calibrators were observed every 22 minutes. The primary beam sizes are 53″ and 59″ with the synthesized beams of 6442 (P.A.=54°) and 6952 (PA=29°) for LABd05 and SSA22-LAB18, respectively.
The CO(3–2) line emission is detected with high significance (6) from LABd05 while the observations of SSA22-LAB18 resulted only in a 3 upper limit of 0.27 Jy km s-1 (assuming a line-width of 400 km s-1). We obtained additional PdBI WideX observations of the CO J = 5–4 transition from LABd05 on 2012 December 22 and 30 (project ID: W0AC). Data were collected in C configuration with six antennae and baselines ranging between 24 m and 176 m. The receiver was tuned to = 157.617 GHz (2 mm band) and the total bandwidth was 3.6 GHz, corresponding to 6800 km s-1. The on-source observing time was 5.2 hours. The water vapor ranged between 2 mm and 10 mm. The primary beam and the synthesized beam sizes were 32″ and 18 16, respectively. For calibration, we used bandpass (3C273, 3C279) phase/amplitude (1424+366, 1417+273), and flux (3C273, 3C279) calibrators.
The data were reduced with CLIC and MAPPING within the GILDAS software package.111http://www.iram.fr/IRAMFR/GILDAS The data processing program used water vapor monitoring receivers at 22 GHz on each antenna to correct the measured amplitudes and phases for short-term changes in atmospheric water vapor. The typical rms errors in phase calibration are 20°–45° and 10°–30° for the 2 mm and 3 mm band observations, respectively. Typical uncertainties in the flux scales and overall calibration are about 10%. We weighted visibilities according to the inverse square of the system temperature, and applied natural weights when creating maps. We achieved an rms sensitivity of 0.4 – 0.5 mJy beam-1 per 100 km s-1 channel for both targets and transitions.
3. Results
3.1. Detection of CO in a Ly Blob
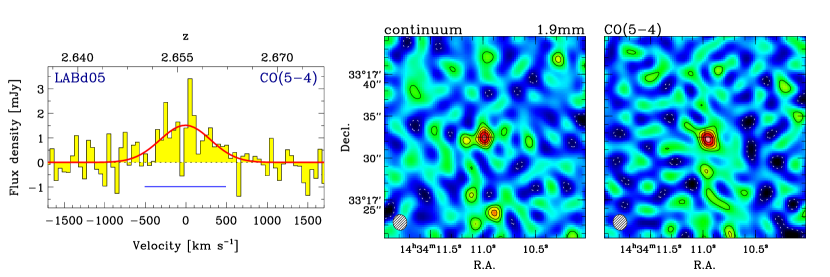
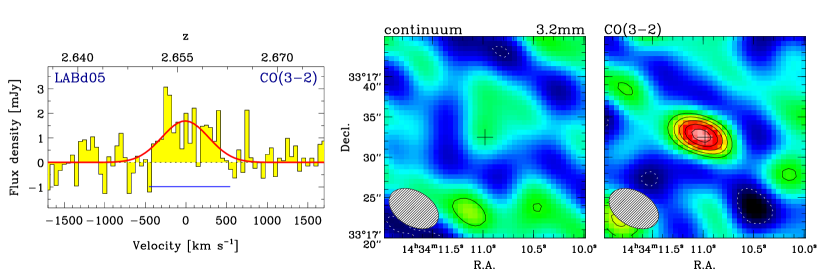
We detect the CO line emission from the molecular gas associated with LABd05. In Figure 1, we show the CO spectra, the cleaned dust continuum and the integrated CO line images for LABd05. Since neither dust continuum nor CO line emission is detected in SSA22-LAB18, we present the results for SSA22-LAB18 in the Appendix. We extract the spectra from the brightest pixel in the image cubes because the source is not resolved in the current data. For the CO(5–4) line observations where the underlying dust continuum is detected, we subtract the continuum in the space before extraction. We fit single Gaussian profiles to the spectra to measure the line fluxes and widths. We produce the CO line images by integrating the channels indicated with horizontal lines in the left panels of Figure 1, which are 1.3FWHM of the lines. The CO(3–2) and CO(5–4) lines are detected at 6 and 7 level for this velocity interval, respectively. The properties of the CO lines and dust continuum are listed in Table 1.
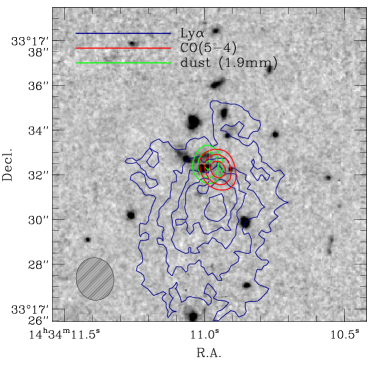
The PdBI high-resolution continuum observations pinpoint the location of the most energetic source within LABd05. In Figure 2, we show the 1.9mm continuum and CO(5–4) line contours on an HST VJH composite image. The dust continuum and CO lines are detected at the phase center, the position of the galaxy #36 (R.A. = 14h 34m 10981, decl. = 33° 17′ 3248), which was identified from the deep optical and near-infrared HST observations as the most likely counterpart to the strong MIPS source (Prescott et al., 2012b). The dust continuum and CO line images are unresolved down to our synthesized beam (1.7″; 13.5 kpc) and are coming from galaxy #36, or at least from the 7 kpc region around this position. The center of the CO emission is slightly offset from the phase center by 04 03, but this offset is not statistically significant.222The uncertainty on the position of the CO emission is derived from the UVFIT routine in GILDAS.
No millimeter source is detected at the location of the peak of the Ly emission, which is offset by 1.5″ (12 kpc in projected distance) from the MIPS source. We place a 3 upper limit of 0.15 mJy beam-1 corresponding to 1.61012 or SFR 260 yr-1, assuming the dust properties presented in Section 3.4. It is therefore unlikely that the nebula is powered by a luminous, dust-obscured galaxy located at the position of the Ly centroid.
The CO line spectra show that the MIPS source (galaxy #36) is indeed located at the same redshift as the extended Ly emission ( 2.66). Note that prior to this study, the redshift of this MIPS source had only been estimated from a weak detection of PAH emission in low S/N Spitzer InfraRed Spectrograph (IRS) spectra (Colbert et al., 2011). The redshifts and widths of the CO(5–4) and CO(3–2) lines agree to within the uncertainties. By averaging the two measurements, we determine the systemic redshift to be = 2.6560 0.0005, corresponding to a velocity uncertainty of 40 km s-1. We also fitted the two CO spectra simultaneously by forcing both profiles to have the same redshift and line-width, but different peak intensities, and found that the resulting redshift and uncertainties were consistent with the above. Therefore, we are confident with our redshift determination. We will discuss the Ly, C IV, He II and CO line profiles in detail in the next section.
Given the FIR luminosity of the source, the measured CO line-width (FWHM 700 km s-1) is relatively large, suggesting that the embedded galaxy (#36) is quite massive. Carilli & Walter (2013) compiled the and the FWHM of CO lines for high- SMGs and QSOs (their figure 5). While there is a large scatter and no clear correlation between and FWHM, the LABd05 is located in the upper part of the distribution of FWHMs for the sources with 12.5, suggesting that LABd05 contains a galaxy whose dynamical mass is comparable to that of QSOs and SMGs. The line-width of LABd05 is larger than that of more quiescent normal star-forming galaxies or color-selected star-forming galaxies. A model-dependent mass estimate for the galaxy #36 is = 3–7, where the range reflects the range of size estimates for the CO emitting region: the optical size of the galaxy #36 ( = 0.39″; Prescott et al., 2012b) and the beam size of CO(5–4) observations as an upper limit ( = 7 kpc). Higher resolution CO observations could yield a more accurate mass estimate by spatially resolving the velocity structure of the CO-emitting region and by determining the inclination of the galaxy.
3.2. Gas Kinematics from Ly–CO Velocity Offset
We next compare the CO and Ly line profiles to investigate the kinematics of the extended Ly emission. Previous studies of LBGs and compact Ly emitters have used velocity offsets between the optically thick Ly and the optically thin nebular emission lines (e.g., [O III]) as diagnostics for for the kinematics of the surrounding medium (Steidel et al., 2004, 2010; McLinden et al., 2011; Hashimoto et al., 2013). We refer the readers to Yang et al. (2011) for the detailed descriptions and caveats of this technique in the context of Ly blobs. In short, in an optically thick medium with no bulk flows, a double-peaked Ly profile with similar intensity emerges because of the resonant scattering. If the medium is outflowing, the blue peak of the Ly profile is depressed or diminished; thus the brighter peak of the Ly profile appears redshifted relative to the systemic velocity. In the case of inflowing gas, the brighter Ly peak appears blueshifted instead (e.g., Dijkstra et al., 2006a; Verhamme et al., 2006).
In this study, we use CO emission lines instead of nebular lines to determine the systemic velocity, because the CO, as a tracer of the cold molecular gas component, should be the best tracer of the systemic redshift of a galaxy (e.g., Greve et al., 2005). Here we assume that the observed CO emission is originating from the interstellar medium within galaxy #36. As will be discussed in §3.3, LABd05 might have a large reservoir of diffuse molecular gas, possibly due to outflows or galaxy interactions, which may affect the centroid of CO line. However, we find that the line profiles of the two CO transitions — which may trace different phases of the molecular gas — show almost identical line centers and no evidence for complex kinematics, suggesting that our assumption is valid.
To compare velocity centers between the CO lines and the rest-frame UV emission lines, we re-analyze the Keck LRIS longslit spectra that were first presented in Dey et al. (2005). This spectrum was obtained with a 1.5″-wide slit with PA = 19.4° centered on the MIPS source. In the following, we compare the CO, Ly, C IV and He II line profiles at two apertures along the slit: one line of sight (LOS) directly toward the galaxy #36 (aperture 1 in Fig. 2), and a sight line toward the He II-emitting gas near the Ly peak (aperture 2). For a proper comparison between radio and optical spectra, all the spectra are placed in a vacuum wavelength and the local standard of rest (LSR) velocity frame.333The difference between LSR and heliocentric frame is negligible in our application, but we adopt the LSR frame because most extragalactic radio/submm observations adopt the LSR frame as a default.
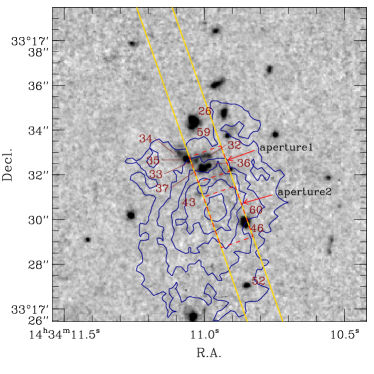
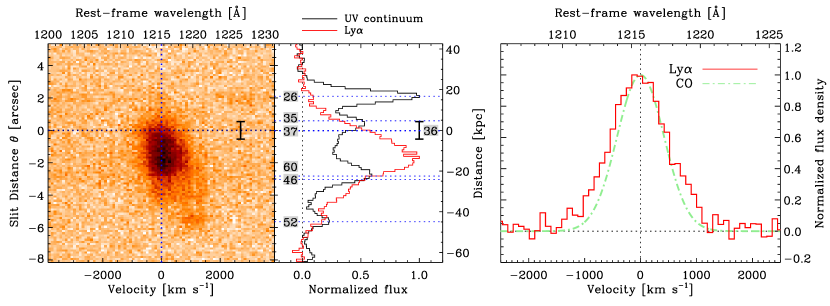
Figure 2 (right) shows the location of the longslit, the extraction apertures, and the sources identified in HST images (Dey et al., 2005; Prescott et al., 2012b). We label the sources which fall within the slit under 1″ seeing condition (adopting the naming convention of Prescott et al. 2012b). To determine the positions of the two apertures along the slit, we collapse the spectrum over a wavelength range of [1240Å – 1720Å]. Figure 3 (left) shows the 2–D spectrum and the spatial profile of rest-frame UV continuum. We bootstrap the location of the MIPS source (#36) using the several sources (#26, #35, #46, #52, #60) that are bright enough to be detected in the continuum profile ( 26.5). The blended galaxies (#26, #59) and (#46, #60) correspond to the galaxy A and B in Dey et al. (2005), respectively. While the membership of galaxy A was spectroscopically confirmed before, galaxy B is not a member, but a background source at 3.27.
Aperture 1 is centered on the MIPS source (#36). Prescott et al. (2012b) show that this source has a strong Balmer/4000Å break, and a very concentrated light profile, and that it is surrounded by numerous neighbouring galaxies and diffuse emission indicating that these galaxies might undergo merging events. Aperture 2 is centered on the He II-emitting region, 2.5″ away from galaxy #36 along the slit, and also includes the Ly peak which is located 1.6″ south of the MIPS source (#36). For this part of Ly blob, no galaxy is identified in the entire wavelength range from the rest-frame UV to FIR, thus the Ly and He II emission originate from the extended gas itself. This He II region is extended at least over 06. We refer readers to Dey et al. (2005) and Prescott et al. (2012b) for further details.
3.2.1 Kinematics around the MIPS Source
We compare the CO and Ly line profiles extracted at the position of galaxy #36 (aperture 1). Figure 3 shows the Ly profile from a 1.2″ (9 pixels) aperture centered on the galaxy #36. For comparison, we overlay the Gaussian fit to the CO profile after convolving it with the spectral resolution of LRIS optical spectra ( = 295 km s-1). While the Ly profile is broader (FWHM = 1040 km s-1) than the CO line (FWHM = 700 km s-1), the profile is symmetric and the line center agrees with that of the CO line within the uncertainty ( = km s-1).
A symmetric single-peaked Ly profile located exactly at the systemic velocity is not often observed in Ly-emitting galaxies, which typically show redshifted asymmetric profiles or double-peaked profiles (e.g., Steidel et al. 2010; Kulas et al. 2012; Yamada et al. 2012, but see Yang et al. 2011, for exceptions). Given the observed single Ly peak, the possibilities are (1) the Ly profile is intrinsically doubled-peaked with similar intensity but two peaks are blended because of low spectral resolution or (2) the Ly photons produced in the MIPS source (either due to star formation or AGN) are not seriously affected by the resonant scattering in the medium between the galaxy and the observer. We find that the first scenario is unlikely because another Keck LRIS spectrum taken with a higher resolution ( = 197 km s-1) also shows a symmetric Ly profile. This spectrum was also obtained by Dey et al. (2005) with PA = 0°, but we do not present it here because the slit does not cover the He II-emitting region. Though unlikely, this first scenario would imply that the gas around the MIPS source is roughly static or that there is no significant bulk motion. The second scenario implies that there is less neutral H I gas at the systemic velocity of the MIPS source, possibly due to photo-ionization by the ionizing source. If this is the case, the velocity shift of the Ly line would reflect gas motions. In either case, we conclude that the Ly profile along the LOS toward galaxy #36 is consistent with roughly static gas without any significant bulk flows. However, we note that we cannot rule out the possibility of gas motions tangential to our LOS, thus hiding any strong outflow signatures.
3.2.2 Kinematics of He II-emitting Gas
We compare the Ly, He II, C IV profiles with the CO profile for the He II region (aperture 2) to investigate how this He II-emitting gas is moving relative to the MIPS source. For this part of Ly blob, the extended optically thin He II emission must originate from the extended gas itself. For optically thick Ly lines, Ly photons could be produced in situ at the same region as He II, or they could be produced by other galaxies or within other parts of the gaseous halo, and subsequently resonantly scattered into this region.
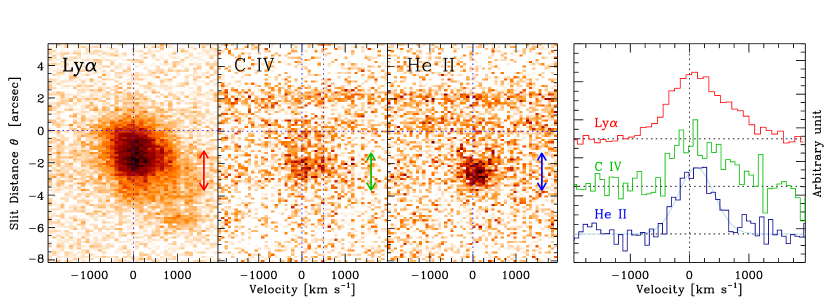
Figure 4 shows the 2–D spectra of Ly, C IV and He II and the 1–D spectra extracted from the He II-emitting region (aperture 2 centered at = 2.5″, where is the projected distance from the MIPS source along the slit). This extraction aperture is indicated as a vertical arrow in the left panel. At this aperture, the peak of the Ly profile still agrees with the systemic velocity of the MIPS source ( = 45 26 km s-1), but the Ly profile is asymmetric with a red wing that extends up to 1500 km s-1. We find that the velocity half-width at half-maximum (HWHM = 1350 km s-1) on the red side of the profile is roughly twice broader than the blue side (HWHM = 600 km s-1). The profile of the blended C IV doublet lines appears to be similar to the Ly profile, but the low S/N does not allow us to carry out a detailed analysis. On the other hand, the optically thin He II line is redshifted by a small amount ( = 110 25 km s-1) against the systemic velocity of the #36, indicating that the He II-emitting gas is moving relative to the MIPS source. In general, it would not be possible to determine whether the He II region is approaching or receding relative to the MIPS source because we do not know whether this gas is located in front of or behind the galaxy. Luckily, the Ly profile from the same region has an asymmetric red wing, indicating that there must be receding material by which the Ly photons are back-scattered. Therefore, we conclude that it is most likely that the He II-emitting gas near the Ly-peak is receding in the local velocity frame and located behind the MIPS source.
The symmetric Ly profile at the location of the MIPS source (i.e., in aperture 1) and the relatively small LOS velocity offset of the He II emitting region ( 100 km s-1) together suggest that LABd05 does not have extreme outflows as predicted by the hyper-/superwind hypothesis (Taniguchi & Shioya, 2000) and that shock-heating does not play a major role in powering Ly emission in this source. This extreme outflow model, which requires an outflow speed up to 1000 km s-1, has been proposed to explain the large extent of Ly blobs. Of course, we cannot completely rule out the possibility of strong outflows oriented tangential to the line-of-sight, but we note that Dey et al. (2005) showed that the C IV/He II line ratio is inconsistent with shock ionization. A large statistical study of Ly blob gas kinematics is required to better constrain the gas geometry. We note that no evidence for extreme outflows was found among a total of eight Ly blobs with a wide range of Ly luminosity (Y. Yang in preparation). We will further discuss the physical nature of LABd05 in detail in Section 4.1.
3.3. CO SED of LABd05
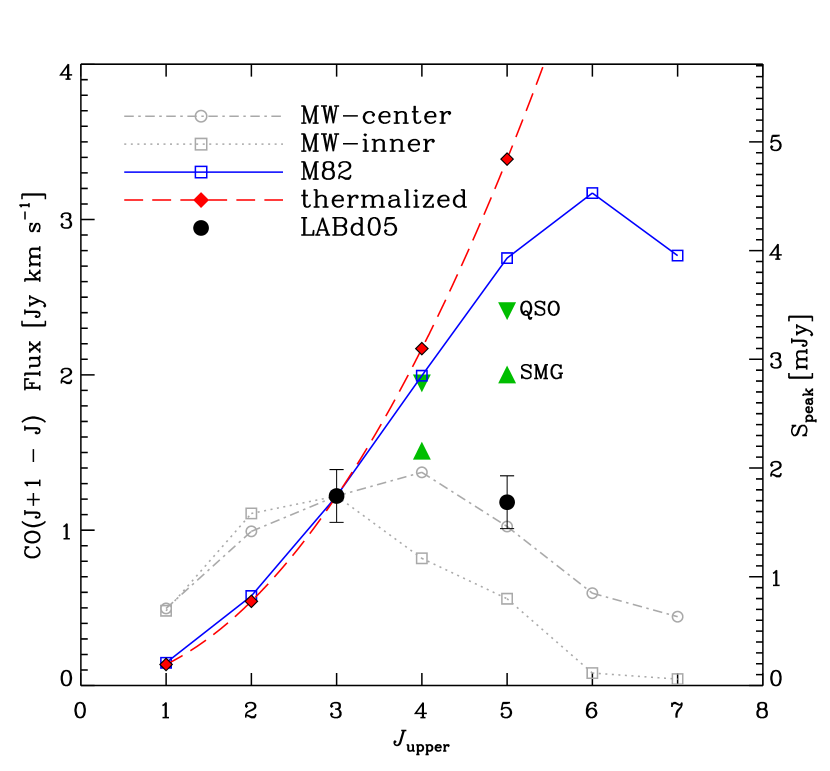
In combination with radiative transfer models such as the large velocity gradient (LVG) approximation or the photo-dissociation region (PDR) model, multiple CO transitions (CO SED) can be used to constrain the physical conditions of the molecular gas in the star-forming region (e.g., Weiß et al., 2007). As a first step to studying the properties of star-forming gas in the galaxy that dominates the bolometric luminosity of the Ly blob, we show the CO SED of LABd05 in Figure 5. For comparison, we show the CO SEDs for the Milky Way (Fixsen et al., 1999), the center of a local starburst galaxy M82 (Weiß et al., 2005), and an optically thick thermalized gas [ ]. The average values for high- QSOs and SMGs compiled by Carilli & Walter (2013) are also shown for = 4 and 5. All CO SEDs are normalized at the integrated line flux = 1.22 Jy km s-1 of LABd05.
The CO SED of LABd05 is unusual given its high FIR luminosity ( 41012). We find a sub-thermal line ratio between two transitions, / = 0.97 0.21 [/ = 0.35 0.08] which is smaller than the ratios for the center of M82 (2.24; Weiß et al., 2005) and for fully thermalized gas (2.78). This ratio is even lower than the average values of high- QSOs (1.97) and SMGs (1.64). The compilation of Carilli & Walter (2013) includes a total of 9 SMGs and QSOs that have both CO(3–2) and CO(5–4) line flux measurements with a range of / = 1.4 – 2.4, thus LABd05’s line ratio is lower than those of SMGs and QSOs.444These measurements are compiled from Barvainis et al. (1997); Frayer et al. (1999); Neri et al. (2003); Weiß et al. (2003, 2009); Hainline et al. (2004); Tacconi et al. (2006); Alloin et al. (2007); Swinbank et al. (2010); Riechers et al. (2011a); Danielson et al. (2011); Schumacher et al. (2012). The observed line ratio is higher than the value (0.500.1) for the inner part of the MW (), but consistent with the value found toward the Galactic center (0.840.06; Fixsen et al., 1999).
A caveat to our measurement of the line ratio is that the beam sizes for the two transitions are different: 5″ and 1.7″ for CO(3–2) and CO(5–4), respectively. Therefore, it is conceivable that our CO(5–4) line observations might have out-resolved any extended CO emission, leading to an underestimate of the total CO(5–4) flux and a lower line ratio. We tested whether any extended emission can be recovered from our C configuration data. Tapering visibilities with 50m width boosted the CO(5–4) line flux by only 20% with a new synthesized beam (4″): = 1.360.3, but still consistent with the original measurement. Note that in order for LABd05’s ratio to be consistent with that of SMGs, the CO(5–4) flux has to be boosted by 70%, i.e., more than 1/3 of the total flux has to lie outside the 17 beam. However, since the gas traced by CO(5–4) is likely to be more spatially compact, it is unlikely to be missed (or resolved-out) by the larger baselines and the 1.7″ beam used here. Future observations of additional CO transitions (e.g., = 10, 76) and/or re-observation of CO(5–4) line with a compact array configuration are required to further constrain the CO SEDs of LABd05.
With these caveats in mind, we consider two possible scenarios for the CO excitation in LABd05 and their implications. First, the LABd05’s CO emission could arise from a single gas phase, i.e., the CO SED of LABd05 can be approximated with a LVG model with a single gas density () and temperature (). In this case, one can show that the star-forming gas in this Ly blob has lower density and/or temperature than what has been observed in QSOs and SMGs with similar . Low CO excitation has been observed for high- galaxies, but only for a handful of near-IR-selected galaxies (the so-called BzK galaxies) at that have lower (1012) than SMGs and LABd05 (e.g., Dannerbauer et al., 2009).
Second, the CO SED of LABd05 could be composed of two components (a) a dense molecular gas reservoir typical of high- QSOs and (b) an additional diffuse gas component around this system. There is now increasing evidence that SMGs contain both low and high-excitation components of molecular gas (e.g., Weiß et al., 2005; Ivison et al., 2011; Danielson et al., 2011; Riechers et al., 2011b). For example, Riechers et al. (2011b) show that, in two SMGs (SMM J09431+4700 and SMM J13120+4242), a low-excitation component similar to the MW CO SED is required to explain the excess of low- emission. However, we find that even in these studies, the low-excitation component is not strong enough to yield a flat / line ratio. Instead, we find that the flat (5–4)/(3–2) line ratio of LABd05 is more similar to that of the local starburst galaxy M82. Weiß et al. (2005) show that while the central starburst disk of M82 follows an almost thermalized CO SED up to =4 or 5 (Fig. 5), the total integrated CO SED is less excited due to low- transitions dominated by the diffuse molecular gas located in the outflow and in tidal streamers. Their best-fit LVG model shows that if M82 were observed unresolved at high-, it would have / = 0.83 similar to the values observed in LABd05.
Without the complete CO SED, especially the =10 transition, it is not possible to distinguish these two scenarios discussed above. However, in either case, we conclude that there must be a significant reservoir of low density molecular gas associated with LABd05.
3.4. Dust Properties of LABd05
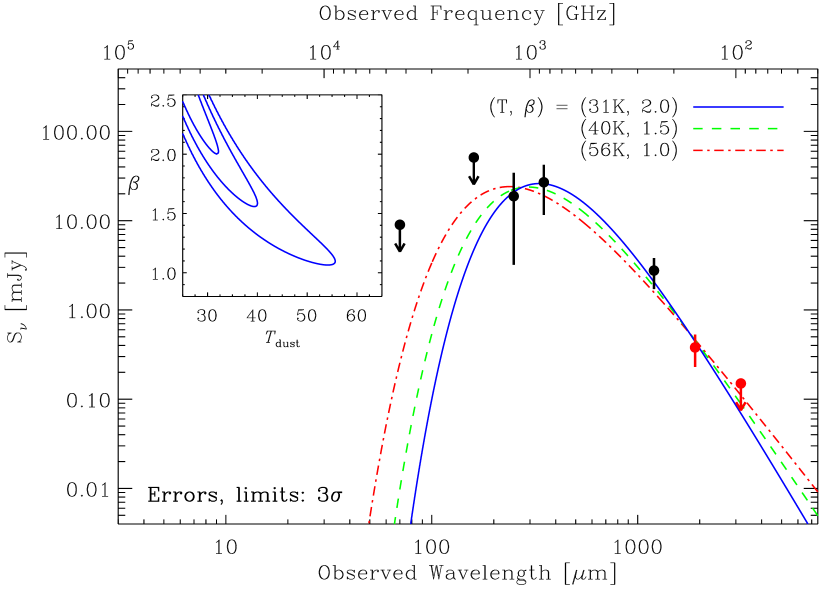
The dust properties of Ly blobs have been poorly constrained to date because most Ly blobs have not been detected at mm and submm wavelengths (Matsuda et al., 2007; Kohno et al., 2008; Yang et al., 2012; Tamura et al., 2013). Using new continuum measurements, we update the far–infrared SED of LABd05. In Figure 6, we show the 1.9 mm flux density and the upper limit on the 3.2 mm continuum together with the measurements presented in Yang et al. (2012). We fit the data with a modified blackbody SED with a dust temperature and an emissivity index . We find = 54, 39 and 31 K for the fixed emissivity index = 1, 1.5 and 2, respectively. While the best-fit and are still degenerate, the colder dust temperature ( 41 K) and large emissivity index ( 1.5) are favoured at the 2 (96%) confidence level. Our estimate remains almost unchanged from Yang et al. (2012): (40–1000m) = (3.90.5). The updated dust mass is = (1.50.6)109. Note that the derived dust mass is sensitive to the choice of : if we adopt = 1.5, will decrease by a factor of 4.
We find that the dust properties within the Ly blob are more consistent with those of SMGs [(, ) = (35 K, 1.6)] than with those of QSOs (47 K, 1.6; Beelen et al., 2006). Recently, using the Wide-Field Infrared Survey Explorer (WISE) and a MIR color selection technique, Bridge et al. (2013) selected hyper-luminous infra-red galaxies ( – ), some of which show extended Ly halos over 30–100 kpc. These WISE-selected Ly blobs have very warm dust temperatures, = 50–85 K (), much warmer than LABd05, typical SMGs and less luminous DOGs. This warm temperature indicates that the dust is being illuminated by an AGN, thus Bridge et al. (2013) suggest that these WISE-selected HyLIRGs are experiencing extremely powerful feedback from the AGNs and that they are in a very brief evolutionary stage between dusty starbursts and optical QSOs. Given that the colder dust temperature in LABd05 is preferred by our SED fit and that this dust temperature is consistent with those of DOGs and SMGs rather than AGNs, we conclude that the dust heating in the FIR is likely dominated by star formation in the MIPS source.
3.5. Molecular Gas Mass in LABd05
The unusual CO excitation in LABd05 adversely affects our ability to estimate the molecular gas mass. If we adopt the MW-like CO SED and extrapolate CO fluxes to = 1, LABd05 will have = 1.61011 K km s-1 pc2 and = 6.41011 (/4.0) (Fig. 5). Here we adopt the nominal MW-like CO–to–H2 conversion factor. On the other hand, if we assume that the gas is still fully thermalized up to = 3, we obtain = 3.51010 (/0.8) for = 4.41010 K km s-1 pc2 assuming a ULIRG-like conversion factor. The actual gas mass and values for LABd05 are expected to lie between these two extreme values. For these two estimates, we obtain the gas-to-dust mass ratios, / = 20 and 370, which span almost the entire observed range of Local Group galaxies (Leroy et al., 2011) and local ULIRGs (Solomon et al., 1997). Furthermore, the estimate derived from the MW-like CO SED is comparable to or even larger than the dynamical mass estimated from the CO line-width. We conclude that putting constraints on the CO(1–0) line luminosity of LABd05 and carrying out more detailed modeling of the CO SED will be critical for constraining the properties of star formation in this Ly blob.
4. Discussion
With new information on the gas kinematics in hand, we construct physical models for LABd05 in this section. In the following, we begin by summarizing the observational findings obtained from this work as well as previous studies (Dey et al., 2005; Prescott et al., 2012b), which a successful model must be able to explain:
-
1.
The Ly profile around the MIPS source (galaxy #36) is symmetric and peaks precisely at the systemic velocity of the galaxy as traced by CO emission.
-
2.
The He II-emitting gas (located 20 kpc away from the MIPS source) is receding with 100 km s-1 with respect to the MIPS source.
-
3.
The Ly profiles become broader, more asymmetric, and more redshifted with increasing distance from the MIPS source (Dey et al., 2005).
-
4.
There are no galaxies detected in the UV-to-FIR at the peak of the Ly emission, which is located at 12 kpc from the MIPS source (Prescott et al., 2012b).
The unknowns are (1) the mass distribution in LABd05 and (2) how to interpret the relative motion between the MIPS source and the He II-emitting gas. Depending on the answers to these two unknowns, we consider the following two models for LABd05.
4.1. Physical Models for LABd05
The first model assumes that the mass (gas and dark matter) is centered on the MIPS source and that the He II/Ly-emitting gas is outflowing from this galaxy. In this picture, photo-ionization by an obscured AGN (the MIPS source) is the dominant source for the extended Ly emission. The power-law MIR SED of the MIPS source and no obvious sign of AGN activity in the optical spectrum (e.g., broad emission lines and high ionization lines) indicates that the MIPS source might contain an obscured AGN (Dey et al., 2005). Note that star formation is likely to heat the dust within the MIPS source (confined within 7 kpc), but the radiation from the AGN provides energy for the Ly emission over 100 kpc scale. As the MIPS source, plausibly the most massive member of LABd05, is also located near the greatest concentration of galaxies, it likely lies at or near the center of the gravitational potential. A cone of radiation from the AGN photo-ionizes the surrounding gas toward the south–west part of the Ly blob. The presence of C IV and He II emission near the Ly peak suggests that this ionizing radiation should be hard. Since we do not observe any Ly or He II emission towards the northern side, in this model, the radiation from the AGN must be anisotropic. Note that this kind of anisotropic ionizing radiation is common among high-redshift QSOs (e.g. Hennawi & Prochaska, 2013; Farina et al., 2013). Around the AGN, the gas is highly ionized, leading to Ly being less affected by resonant scattering off of neutral gas. Therefore, the Ly profile is single-peaked and symmetric for this LOS. The surrounding gas is outflowing with a relatively low speed (100 km s-1 in projection) from the MIPS source due to either star-formation or AGN-driven winds. Further from the AGN, the gas becomes more neutral, thus the Ly profiles become broader and more asymmetric. The observed monotonic velocity shear across the Ly halo could be explained if the outflowing gas is accelerating (e.g., Steidel et al., 2010) or radiative transfer effects, as the Ly lines become more redshifted due to higher optical depths at larger radii. In this scenario, the diffuse molecular gas might represent gas entrained in an outflow from the MIPS source.
The major challenge to this model is the fact that the Ly and He II emission peaks are not located at the location of the MIPS source where illumination from the AGN and the gas density should be highest. Given that the Ly surface brightness depends on complicated radiative transfer effects, the anisotropic geometry of the radiation cone, and the varying ionization state of the gas, it is not clear whether the observed Ly surface brightness distribution can be reproduced by this model. Detailed Ly radiative transfer calculations are required.
An alternative scenario is that the gas in LABd05 is distributed symmetrically with a density profile that scales with the surface brightness profile of Ly. In other words, the potential is centered around the location of the Ly peak and the galaxies are somehow displaced from the center of the potential. Because there are no galaxies directly associated with this Ly peak, the baryonic component is largely in the gas phase. The kinematics of the gas are reflected in the observed Ly profiles. The galaxies are forming from this halo gas, therefore they closely follow the motions of the gas. In other words, the galaxies have only small peculiar velocities relative to the overall gas kinematics. The MIPS source is one of these galaxies forming within the nebula, thus explaining the lack of any significant velocity offset between Ly and CO. It is undergoing a starburst and possibly AGN formation, and is supplying ionizing photons to the gas. In this case, the ionization from the MIPS source could be isotropic and there could be also other ionizing sources. For example, Prescott et al. (2012b) found diffuse continuum emission near the He II region which, if powered by spatially extended star formation, could suggest an additional source of ionization. In this model, the Ly emission is observed only on one side of the AGN because the photo-ionization is bounded by the gas distribution. The low density molecular gas around the MIPS source may indicate that molecular gas is forming within the MIPS source and fueling the star formation activity. In other words, these observations show a massive galaxy in the process of forming from the gas with rapid dust and molecular gas formation.
The major challenge in this model is how to explain the observed Ly velocity structure, in particular, why the line-width of Ly varies across the halo rather than being broadest at the center of the nebula. Furthermore, it is not clear why the galaxies and gas in this system are spatially offset.
With the limited kinematic data, it is difficult to discriminate between these two models. Furthermore, it is still possible that there is an obscured source at the location of the Ly peak just below the detection limit of our mm observations (SFR 260 yr-1; 3). Alternately, a weak radio-jet from the MIPS source might be responsible for the offset morphology between Ly and member galaxies, similar to what has been observed in high-redshift radio galaxies. To reveal the nature of LABd05, deeper spectroscopic observations with high spectral resolution and deeper (sub)mm/radio continuum observations will be required to further constrain the kinematics of the Ly- and He II-emitting gas and to search for possible energy sources.
5. Summary and Conclusions
We have obtained IRAM PdBI observations of the CO = 3 2 and = 5 4 line transitions from a =2.7 Ly blob (LABd05) in order to investigate the molecular gas content and kinematics, to determine the location of the dominant energy source, and to study the physical conditions of star-forming regions within the Ly blob.
We detect CO line emission from the molecular gas associated with this Ly blob. The CO line emission and the dust continuum are detected at the location of a strong MIPS source, which is offset by 1.5″ (12 kpc in projection) from the peak of Ly surface brightness distribution. Neither the CO line nor the dust continuum emission is resolved with our 1.7″ beam, showing that the molecular gas and dust are confined to within a 7kpc region around the MIPS source. In addition, no millimeter continuum source is found at the location of the Ly peak, excluding the presence of a compact source of hidden star formation at SFR 260yr-1 which might be directly responsible for the Ly emission. The CO line spectra show that the MIPS source is indeed located at the same redshift as the extended Ly emission and that it is a massive galaxy ( = 3–71011) based on the broad CO line-width (FWHM = 700 km s-1).
Combined with Keck/LRIS longslit spectroscopy of Ly and He II, we constrain the kinematics of the extended gas using the CO emission as the best tracer of the systemic redshift. At the position of the MIPS source, the Ly profile is symmetric and its line center agrees with those of the CO lines. This implies that there are no significant bulk flows and the photo-ionization from the MIPS source might be the dominant source of the Ly emission. Near the peak of the Ly nebula, the gas is slowly receding (100 km s-1) with respect to the MIPS source, thus disfavoring the hyper-/superwind hypothesis where extreme galactic winds are responsible for the extended Ly emission. However, we note that we cannot rule out the possibility that gas flow within LABd05 is tangential to our LOS.
We find that a significantly sub-thermal line ratio between the two CO transitions, / = 0.97 0.21 [/ = 0.35 0.08]. This line ratio is lower than the average values found in high- SMGs and QSOs, but is consistent with the value found in the center of the Milky Way. This line ratio indicates that there is a large reservoir of low-density molecular gas that could be spread over the vicinity of the MIPS source. Observations of CO(7–6) and CO(1–0) lines with higher spatial resolution are required to further constrain the properties of the star-forming regions within this Ly blob.
Facilities: PdBI, Keck(LRIS)
References
- Alloin et al. (2007) Alloin, D., Kneib, J.-P., Guilloteau, S., & Bremer, M. 2007, A&A, 470, 53
- Barvainis et al. (1997) Barvainis, R., Maloney, P., Antonucci, R., & Alloin, D. 1997, ApJ, 484, 695
- Beelen et al. (2006) Beelen, A., Cox, P., Benford, D. J., et al. 2006, ApJ, 642, 694
- Bower et al. (2004) Bower, R. G., et al. 2004, MNRAS, 351, 63
- Bridge et al. (2013) Bridge, C. R., Blain, A., Borys, C. J. K., et al. 2013, ApJ, 769, 91
- Bussmann et al. (2009) Bussmann, R. S., et al. 2009, ApJ, 705, 184
- Carilli & Walter (2013) Carilli, C. L., & Walter, F. 2013, ARA&A, 51, 105
- Chapman et al. (2004) Chapman, S. C., Scott, D., Windhorst, R. A., Frayer, D. T., Borys, C., Lewis, G. F., & Ivison, R. J. 2004, ApJ, 606, 85
- Colbert et al. (2011) Colbert, J. W., Scarlata, C., Teplitz, H., Francis, P., Palunas, P., Williger, G. M., & Woodgate, B. 2011, ApJ, 728, 59
- Danielson et al. (2011) Danielson, A. L. R., Swinbank, A. M., Smail, I., et al. 2011, MNRAS, 410, 1687
- Dannerbauer et al. (2009) Dannerbauer, H., Daddi, E., Riechers, D. A., et al. 2009, ApJ, 698, L178
- Dey et al. (2005) Dey, A., et al. 2005, ApJ, 629, 654
- Dey et al. (2008) Dey, A., Soifer, B. T., Desai, V., et al. 2008, ApJ, 677, 943
- Dijkstra et al. (2006a) Dijkstra, M., Haiman, Z., & Spaans, M. 2006, ApJ, 649, 14
- Dijkstra et al. (2006b) Dijkstra, M., Haiman, Z., & Spaans, M. 2006, ApJ, 649, 37
- Dijkstra & Loeb (2009) Dijkstra, M., & Loeb, A. 2009, MNRAS, 400, 1109
- Erb et al. (2011) Erb, D. K., Bogosavljević, M., & Steidel, C. C. 2011, ApJ, 740, L31
- Fardal et al. (2001) Fardal, M. A., Katz, N., Gardner, J. P., Hernquist, L., Weinberg, D. H., & Davé, R. 2001, ApJ, 562, 605
- Farina et al. (2013) Farina, E. P., Falomo, R., Decarli, R., Treves, A., & Kotilainen, J. K. 2013, MNRAS, 429, 1267
- Fixsen et al. (1999) Fixsen, D. J., Bennett, C. L., & Mather, J. C. 1999, ApJ, 526, 207
- Francis et al. (2001) Francis, P. J., et al. 2001, ApJ, 554, 1001
- Frayer et al. (1999) Frayer, D. T., Ivison, R. J., Scoville, N. Z., et al. 1999, ApJ, 514, L13
- Geach et al. (2005) Geach, J. E., et al. 2005, MNRAS, 363, 1398
- Geach et al. (2009) Geach, J. E., et al. 2009, ApJ, 700, 1
- Goerdt et al. (2010) Goerdt, T., Dekel, A., Sternberg, A., Ceverino, D., Teyssier, R., & Primack, J. R. 2010, MNRAS, 407, 613
- Greve et al. (2005) Greve, T. R., et al. 2005, MNRAS, 359, 1165
- Hainline et al. (2004) Hainline, L. J., Scoville, N. Z., Yun, M. S., et al. 2004, ApJ, 609, 61
- Haiman, Spaans, & Quataert (2000) Haiman, Z., Spaans, M., & Quataert, E. 2000, ApJ, 537, L5
- Hashimoto et al. (2013) Hashimoto, T., Ouchi, M., Shimasaku, K., et al. 2013, ApJ, 765, 70
- Hayes et al. (2011) Hayes, M., Scarlata, C., & Siana, B. 2011, Nature, 476, 304
- Hennawi & Prochaska (2013) Hennawi, J. F., & Prochaska, J. X. 2013, ApJ, 766, 58
- Ivison et al. (1998) Ivison, R. J., Smail, I., Le Borgne, J.-F., et al. 1998, MNRAS, 298, 583
- Ivison et al. (2011) Ivison, R. J., Papadopoulos, P. P., Smail, I., et al. 2011, MNRAS, 412, 1913
- Keel et al. (1999) Keel, W. C., Cohen, S. H., Windhorst, R. A., & Waddington, I. 1999, AJ, 118, 2547
- Kohno et al. (2008) Kohno, K., et al. 2008, Panoramic Views of Galaxy Formation and Evolution, 399, 264
- Kulas et al. (2012) Kulas, K. R., Shapley, A. E., Kollmeier, J. A., et al. 2012, ApJ, 745, 33
- Leroy et al. (2011) Leroy, A. K., Bolatto, A., Gordon, K., et al. 2011, ApJ, 737, 12
- Neri et al. (2003) Neri, R., Genzel, R., Ivison, R. J., et al. 2003, ApJ, 597, L113
- Matsuda et al. (2004) Matsuda, Y., et al. 2004, AJ, 128, 569
- Matsuda et al. (2007) Matsuda, Y., Iono, D., Ohta, K., Yamada, T., Kawabe, R., Hayashino, T., Peck, A. B., & Petitpas, G. R. 2007, ApJ, 667, 667
- Matsuda et al. (2011) Matsuda, Y., et al. 2011, MNRAS, 410, L13
- McLinden et al. (2011) McLinden, E. M., Finkelstein, S. L., Rhoads, J. E., et al. 2011, ApJ, 730, 136
- McLinden et al. (2013) McLinden, E. M., Malhotra, S., Rhoads, J. E., et al. 2013, ApJ, 767, 48
- Melbourne et al. (2012) Melbourne, J., Soifer, B. T., Desai, V., et al. 2012, AJ, 143, 125
- Ouchi et al. (2009) Ouchi, M., et al. 2009, ApJ, 696, 1164
- Overzier et al. (2013) Overzier, R. A., Nesvadba, N. P. H., Dijkstra, M., et al. 2013, arXiv:1305.2926
- Prescott et al. (2008) Prescott, M. K. M., Kashikawa, N., Dey, A., & Matsuda, Y. 2008, ApJ, 678, L77
- Prescott et al. (2009) Prescott, M. K. M., Dey, A., & Jannuzi, B. T. 2009, ApJ, 702, 554
- Prescott et al. (2012a) Prescott, M. K. M., Dey, A., & Jannuzi, B. T. 2012, ApJ, 748, 125
- Prescott et al. (2012b) Prescott, M. K. M., Dey, A., Brodwin, M., et al. 2012, ApJ, 752, 86
- Riechers et al. (2011a) Riechers, D. A., Cooray, A., Omont, A., et al. 2011, ApJ, 733, L12
- Riechers et al. (2011b) Riechers, D. A., Hodge, J., Walter, F., Carilli, C. L., & Bertoldi, F. 2011, ApJ, 739, L31
- Saito et al. (2006) Saito, T., Shimasaku, K., Okamura, S., Ouchi, M., Akiyama, M., & Yoshida, M. 2006, ApJ, 648, 54
- Schumacher et al. (2012) Schumacher, H., Martínez-Sansigre, A., Lacy, M., Rawlings, S., & Schinnerer, E. 2012, MNRAS, 423, 2132
- Smith & Jarvis (2007) Smith, D. J. B., & Jarvis, M. J. 2007, MNRAS, 378, L49
- Solomon et al. (1997) Solomon, P. M., Downes, D., Radford, S. J. E., & Barrett, J. W. 1997, ApJ, 478, 144
- Steidel et al. (2000) Steidel, C. C., Adelberger, K. L., Shapley, A. E., Pettini, M., Dickinson, M., & Giavalisco, M. 2000, ApJ, 532, 170
- Steidel et al. (2004) Steidel, C. C., Shapley, A. E., Pettini, M., Adelberger, K. L., Erb, D. K., Reddy, N. A., & Hunt, M. P. 2004, ApJ, 604, 534
- Steidel et al. (2010) Steidel, C. C., Erb, D. K., Shapley, A. E., Pettini, M., Reddy, N., Bogosavljević, M., Rudie, G. C., & Rakic, O. 2010, ApJ, 717, 289
- Steidel et al. (2011) Steidel, C. C., Bogosavljević, M., Shapley, A. E., et al. 2011, ApJ, 736, 160
- Swinbank et al. (2010) Swinbank, A. M., Smail, I., Longmore, S., et al. 2010, Nature, 464, 733
- Tacconi et al. (2006) Tacconi, L. J., Neri, R., Chapman, S. C., et al. 2006, ApJ, 640, 228
- Tamura et al. (2013) Tamura, Y., Matsuda, Y., Ikarashi, S., et al. 2013, MNRAS, 722
- Taniguchi & Shioya (2000) Taniguchi, Y. & Shioya, Y. 2000, ApJ, 532, L13
- Verhamme et al. (2006) Verhamme, A., Schaerer, D., & Maselli, A. 2006, A&A, 460, 397
- Verhamme et al. (2008) Verhamme, A., Schaerer, D., Atek, H., & Tapken, C. 2008, A&A, 491, 89
- Wagg et al. (2012) Wagg, J., Pope, A., Alberts, S., et al. 2012, ApJ, 752, 91
- Wagg & Kanekar (2012) Wagg, J., & Kanekar, N. 2012, ApJ, 751, L24
- Weijmans et al. (2009) Weijmans, A.-M., Bower, R. G., Geach, J. E., Swinbank, A. M., Wilman, R. J., de Zeeuw, P. T., & Morris, S. L. 2009, MNRAS, 1911
- Weiß et al. (2003) Weiß, A., Henkel, C., Downes, D., & Walter, F. 2003, A&A, 409, L41
- Weiß et al. (2005) Weiß, A., Walter, F., & Scoville, N. Z. 2005, A&A, 438, 533
- Weiß et al. (2007) Weiß, A., Downes, D., Walter, F., & Henkel, C. 2007, From Z-Machines to ALMA: (Sub)Millimeter Spectroscopy of Galaxies, 375, 25
- Weiß et al. (2009) Weiß, A., Ivison, R. J., Downes, D., et al. 2009, ApJ, 705, L45
- Wilman et al. (2005) Wilman, R. J., Gerssen, J., Bower, R. G., Morris, S. L., Bacon, R., de Zeeuw, P. T., & Davies, R. L. 2005, Nature, 436, 227
- Yamada et al. (2012) Yamada, T., Matsuda, Y., Kousai, K., et al. 2012, arXiv:1203.3633
- Yang et al. (2009) Yang, Y., Zabludoff, A., Tremonti, C., Eisenstein, D., & Davé, R. 2009, ApJ, 693, 1579
- Yang et al. (2010) Yang, Y., Zabludoff, A., Eisenstein, D., & Davé, R. 2010, ApJ, 719, 1654
- Yang et al. (2011) Yang, Y., Zabludoff, A., Jahnke, K., Eisenstein, D., Davé, R., Shectman, S. A., & Kelson, D. D. 2011, ApJ, 735, 87
- Yang et al. (2012) Yang, Y., Decarli, R., Dannerbauer, H., et al. 2012, ApJ, 744, 178
| Source | Transition | FWHM | ||||||
|---|---|---|---|---|---|---|---|---|
| (GHz) | (mJy) | ( km s-1) | (Jy km s-1) | ( ) | (K km s-1 pc2) | |||
| LABd05 | 5–4 | 157.6215 | 0.38 0.05 | 2.6560 0.0006 | 734 124 | 1.18 0.17 | 9.37 | 1.53 |
| 3–2 | 94.5831 | 0.15 | 2.6560 0.0007 | 676 129 | 1.22 0.20 | 5.78 | 4.36 | |
| SSA22–LAB18aaUpper limits are 3. | 3–2 | 84.5500 | 0.13 | 0.27bbFWHM = 400 km s-1 assumed. | 1.67 | 1.26 |
Appendix A Observations of SSA22-LAB18
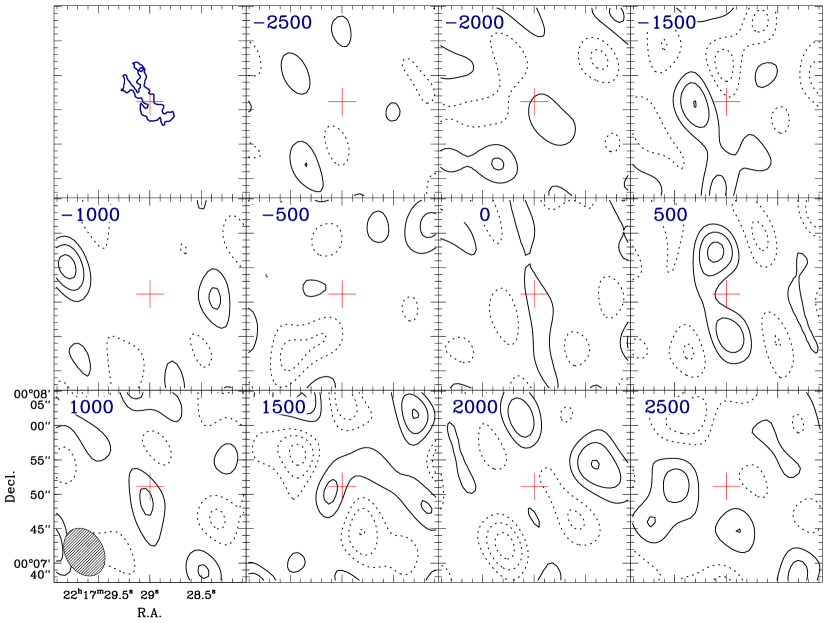
Here we summarize the results of the observations of SSA22-LAB18. This Ly blob was identified from a narrowband imaging survey at (Matsuda et al., 2004). At the time of our observation, this source was known to have the brightest FIR luminosity among Ly blobs (Geach et al., 2005; Yang et al., 2012). Figure 7 shows the PdBI CO line observations for SSA22–LAB18. For reference, we also display the entire dataset in Figure 8. Because the spectroscopic redshift of this Ly blob is not available, we searched for detections over the entire redshift range ( = 3.06 – 3.13) covered by the narrowband filter (NB497). Neither dust continuum or CO(3–2) line emission is detected within the Ly blob.
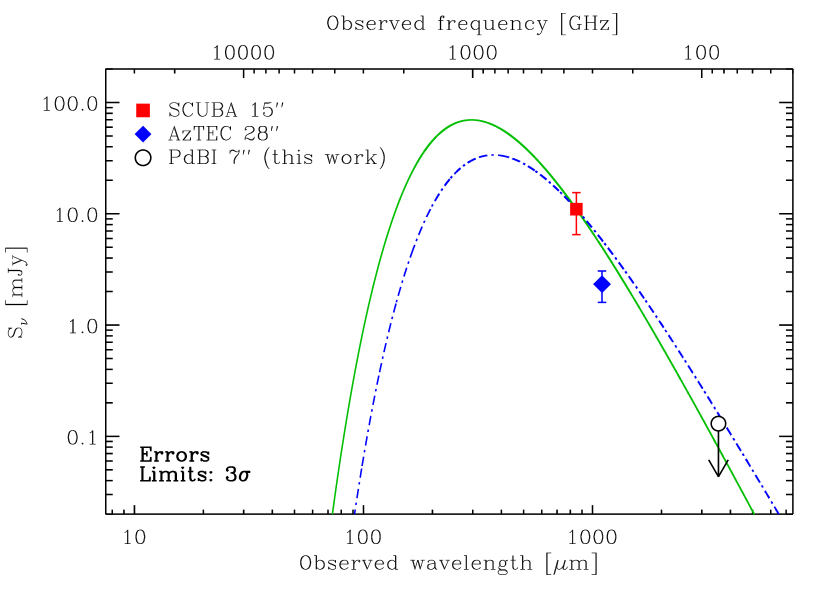
We compare the non-detection in 3.5mm continuum with the existing FIR flux measurements. Figure 9 show the FIR flux densities from SCUBA (Geach et al., 2005), AzTEC-ASTE (Tamura et al., 2013) and our measurements. Different symbols represent the (sub)mm observations with different instruments and beams sizes. For the AzTEC-ASTE measurement, we show the measurement extracted at the position of SSA22–LAB18–b, one of the two components in SSA22–LAB18 (Tamura et al., 2013). Note that SSA22–LAB18–ab are blended with a bright nearby source, thus the actual flux might be even lower than reported. For the illustration purposes, the solid and dot-dashed lines represent the modified blackbody SEDs normalized at the SCUBA photometry, = 11 mJy with (, ) = (40 K, 2) and (30 K, 1.5), respectively. Our upper limit at 3.5mm is not stringent enough to determine which of the previous continuum measurements is correct.