NuSTAR Observations of Heavily Obscured Quasars at
Abstract
We present NuSTAR hard X-ray observations of three Type 2 quasars at –, optically selected from the Sloan Digital Sky Survey (SDSS). Although the quasars show evidence for being heavily obscured Compton-thick systems on the basis of the – keV to [O III] luminosity ratio and multiwavelength diagnostics, their X-ray absorbing column densities () are poorly known. In this analysis: (1) we study X-ray emission at keV, where X-rays from the central black hole are relatively unabsorbed, in order to better constrain ; (2) we further characterize the physical properties of the sources through broad-band near-UV to mid-IR spectral energy distribution (SED) analyses. One of the quasars is detected with NuSTAR at keV with a no-source probability of , and its X-ray band ratio suggests near Compton-thick absorption with cm -2. The other two quasars are undetected, and have low X-ray to mid-IR luminosity ratios in both the low energy (– keV) and high energy (– keV) X-ray regimes that are consistent with extreme, Compton-thick absorption ( cm -2). We find that for quasars at , NuSTAR provides a significant improvement compared to lower energy ( keV) Chandra and XMM-Newton observations alone, as higher column densities can now be directly constrained.
Subject headings:
galaxies: active — X-rays1. Introduction
Quasars are the sites of the most rapid black hole growth in the universe (Salpeter, 1964; Soltan, 1982). They represent the luminous end of the active galactic nucleus (AGN) population, often outshining their host galaxies. The first unobscured (‘Type 1’) quasars were discovered over 50 years ago (Schmidt, 1963; Hazard et al., 1963), and more than one hundred thousand have now been spectroscopically identified (e.g., Véron-Cetty & Véron 2010; Pâris et al. 2012). For obscured (‘Type 2’) quasars111We define Type 2 quasars as AGN with erg s-1, X-ray absorbing column densities cm -2, and optical spectra that show narrow line emission without broad (H or H) components. This threshold is consistent with: (1) the classical optical quasar definition, , when the relation of Steffen et al. (2006) and the composite quasar spectrum of Vanden Berk et al. (2001) are assumed; (2) the value derived by Hasinger et al. (2005) for unobscured AGN. the situation is not as advanced. Similar to the early Type 1 quasars, Type 2 quasars were initially identified from radio selection (e.g., Minkowski 1960), and over the following decades several hundred powerful ‘radio galaxies’ (as such radio-selected Type 2 quasars are typically called) were identified (for reviews, see McCarthy 1993; Miley & De Breuck 2008). However, it is only in the past decade that radio-quiet Type 2 quasars have been found in large numbers. Such sources are generally identified on the basis of either their relatively hard X-ray spectral slopes (e.g., Norman et al. 2002; Stern et al. 2002), optical spectral features (e.g., Steidel et al. 2002; Zakamska et al. 2003), or mid-infrared (mid-IR) colors (e.g., Lacy et al. 2004; Stern et al. 2005). Importantly, mid-IR color selection of Type 2 quasars using the all-sky Wide-Field Infrared Survey Explorer (WISE; Wright et al. 2010) survey identifies several million Type 2 quasars, roughly down to the bolometric luminosity of the primary Sloan Digital Sky Survey (SDSS; York et al., 2000) Type 1 quasar spectroscopic survey (Stern et al., 2012; Assef et al., 2013; Donoso et al., 2013).
The exact nature of Type 2 quasars is still under debate. A simple extension of the orientation-driven unified model of AGN (Antonucci, 1993; Urry & Padovani, 1995) to high luminosities can account for their existence. However, there is also observational evidence for an evolutionary link to Type 1 quasars (e.g., Sanders et al., 1988; Hopkins et al., 2008). The importance of Type 2 quasars to the cosmic evolution of AGN is further demonstrated by their requirement in models of the cosmic X-ray background (CXB) (e.g., Treister & Urry, 2005; Gilli et al., 2007; Treister et al., 2009). However, the observed X-ray properties of Type 2 quasars are poorly constrained at present. Consequently, the column density () distribution222X-rays emitted from the immediate black hole environment are absorbed by circumnuclear gas, and thus provide constraints on . and Compton-thick333Compton-thick absorption is that with cm -2. fraction of quasars are poorly known, which has implications for both AGN and CXB models (e.g., Fabian et al., 2008; Draper & Ballantyne, 2010).
To date, the largest sample of spectroscopically confirmed (radio-quiet) Type 2 quasars at is that of Zakamska et al. (2003) and Reyes et al. (2008). Zakamska et al. (2003) selected 291 Type 2 quasars at redshift from the SDSS based on their optical properties: high [O III] line power and narrow emission lines. Reyes et al. (2008) used the same approach and more recent SDSS data to extend the sample to 887 objects. While X-ray selections of Type 2 quasars at keV are biased against the most heavily obscured sources (e.g., Maiolino et al., 1998), [O III] emission is mostly produced on pc scales and is thus relatively unaffected by nuclear obscuration, allowing larger numbers of the heavily obscured, X-ray faint objects to be found. Following up [O III] selected, rather than X-ray selected, objects with X-ray observations thus gives a less biased estimate of the distribution of AGN (e.g., Risaliti et al., 1999).
The X-ray properties of the Zakamska et al. (2003) and Reyes et al. (2008) Type 2 quasar sample have been studied using Chandra and XMM-Newton observations (Ptak et al., 2006; Vignali et al., 2006, 2010; Jia et al., 2013). Vignali et al. (2006, 2010) measured column densities for a handful of sources through ‘direct’ means (i.e., using X-ray spectroscopic analysis). The highest column densities measured in this manner were cm -2. However, distant obscured quasars are X-ray weak and in most cases direct constraints are not feasible. Instead, an ‘indirect’ approach to estimating column densities can be used where the observed X-ray emission is compared with a proxy for intrinsic AGN power (e.g., the mid-IR continuum emission from hot dust or high-excitation emission lines; Bassani et al., 1999; Lutz et al., 2004; Heckman et al., 2005; Alexander et al., 2005, 2008; Cappi et al., 2006; Panessa et al., 2006; Meléndez et al., 2008; Gandhi et al., 2009; LaMassa et al., 2009, 2011; Gilli et al., 2010; Goulding et al., 2011). Vignali et al. (2006, 2010) were limited to indirect absorption constraints for the majority of their Type 2 quasar sample, and found in every case that Compton-thick absorption (i.e., cm -2) is required to explain the X-ray suppression in these sources. To first order, there appears to be a bimodal distribution for optically selected Type 2 quasars, with having – cm -2 and being Compton-thick. This is interesting given that a continuous distribution is measured for Type 2 Seyferts (e.g., Bassani et al., 1999; Risaliti et al., 1999; LaMassa et al., 2009, 2011), although the differences may be reconciled by considering the different methods used to estimate (LaMassa et al., 2011). To better constrain the distribution of Type 2 quasars, more robust identifications of Compton-thick absorption must be obtained through either: (i) measurement of strong Fe K emission, with keV, which results from the Fe K line being viewed in reflection against a suppressed continuum (e.g., Ghisellini et al., 1994; Levenson et al., 2002); or (ii) measurement of high column densities through spectroscopic analysis at high energies above the photoelectric absorption cutoff (i.e., above observed-frame keV for and cm-2), where X-ray emission is relatively unabsorbed.
The recent launch of the Nuclear Spectroscopic Telescope Array (NuSTAR, Harrison et al., 2013) will see a breakthrough in our understanding of heavily obscured AGN and the CXB population in general. NuSTAR is the first orbiting observatory with the ability to focus high energy ( keV) X-rays using grazing incidence optics. It provides a two orders of magnitude improvement in sensitivity and over an order of magnitude improvement in angular resolution over previous hard X-ray observatories. The high energy range at which NuSTAR operates (– keV) means that the intrinsic, unabsorbed emission of AGN is observed for all but the most heavily obscured, Compton-thick objects. At , it is now possible to directly constrain column densities an order of magnitude higher than those achievable with Chandra and XMM-Newton alone (e.g., Luo et al., 2013).
In this paper, we present exploratory NuSTAR observations of three optically selected Type 2 quasars at –. All three have been identified as Compton-thick candidates in previous studies (Vignali et al., 2006, 2010; Jia et al., 2013). We use X-ray data from NuSTAR, Chandra and XMM-Newton, and near-UV to mid-IR data from other observatories to determine the physical properties of the quasars. In particular, we use a combination of direct and indirect methods to constrain the absorbing column densities. The paper is organized as follows: our sample selection is detailed in Section 2; we describe the observations, data reduction and data analysis in Section 3; our main results regarding X-ray absorption constraints are presented in Section 4; we summarize our main conclusions in Section 5. The cosmology adopted throughout this work is .
2. Sample Selection
First, we selected objects at – from the Chandra and XMM-Newton studies of SDSS selected Type 2 quasars by Vignali et al. (2006, 2010) and Jia et al. (2013). Although the objects have narrow H line emission, the H line lies outside the SDSS spectral range at these redshifts. Therefore, we cannot rule out that these quasars are luminous versions of the Type Seyferts that show evidence for a broad H component but no broad H component (Osterbrock, 1981). Second, we selected quasars with low observed X-ray to [O III] luminosity ratios, . This threshold corresponds to a two orders of magnitude suppression of the observed X-ray luminosity, assuming the Mulchaey et al. (1994) relation between [O III] and intrinsic – keV flux (taking into account the variance of the relation), which is consistent with Compton-thick absorption. This is a conservative selection, since the Mulchaey et al. (1994) relation was calibrated for Type 2 Seyferts, and Type 2 quasars typically have larger X-ray to [O III] luminosity ratios (Netzer et al., 2006). Third, we made sub-selections of three quasars which show evidence for extreme obscuration on the basis of different diagnostics:
-
•
SDSS J001111.97+005626.3 (, erg s-1, erg s-1; Reyes et al., 2008; Jia et al., 2013) has a flat X-ray spectral slope at observed-frame – keV (; Jia et al., 2013), which suggests that the X-ray emission is rising steeply towards high energies ( keV). Unlike the other two quasars, there is no mid-IR spectroscopy available.
-
•
SDSS J005621.72+003235.8 (, erg s-1, erg s-1; Reyes et al., 2008; Vignali et al., 2010) has the deepest m silicate (Si) absorption of the sample of Type 2 quasars observed with Spitzer-IRS in Zakamska et al. (2008). Such strong Si features are typically found in Compton-thick AGN (e.g., Shi et al., 2006; Georgantopoulos et al., 2011b; Goulding et al., 2012).
-
•
SDSS J115718.35+600345.6 (, erg s-1, erg s-1; Reyes et al., 2008; Vignali et al., 2010) is the most luminous quasar in the Vignali et al. (2010) sample at mid-IR wavelengths, but is undetected by Chandra (Vignali et al., 2006). The extremely low X-ray to mid-IR luminosity ratio is likely due to Compton-thick absorption (Vignali et al., 2010). The Spitzer-IRS spectrum for this source shows it to be quasar-dominated at mid-IR wavelengths, but that it also hosts ultraluminous star formation [, Zakamska et al. 2008]. There is no evidence for significant Si-absorption; however, of the best studied Compton-thick AGN do not have significant Si-absorption (e.g., Goulding et al., 2012).
3. NuSTAR and Multiwavelength Data
In our analysis of the three Type 2 quasars, we used NuSTAR observations in conjunction with lower energy X-ray observations from Chandra and XMM-Newton, and near-UV to mid-IR data primarily from large-area public surveys. Hereafter we refer to the quasars using abbreviated SDSS object names.
3.1. NuSTAR Observations
NuSTAR consists of two co-aligned X-ray telescopes (focal length m) which use grazing incidence optics to focus hard X-rays (– keV) onto two focal plane modules (FPMs A and B; Harrison et al., 2013). Each FPM provides a field of view at 10 keV, and a pixel size of ″. The NuSTAR PSF is characterized by a full-width half maximum (FWHM) of ″, and a half-power diameter of ″. The astrometric accuracy for bright X-ray sources is ″ ( confidence; Harrison et al., 2013).
The Type 2 quasars, SDSS J0011+0056, SDSS J0056+0032 and SDSS J1157+6003, were observed by NuSTAR with nominal exposure times of ks, ks and ks, respectively. Details of the observations, including net exposure times, are provided in Table 1.
| NuSTAR | Lower Energy X-ray Observations | |||||||
| Object Name | Observation ID | UT Date | Exposure | Observatory | Observation ID | UT Date | Exposure | |
| (1) | (2) | (3) | (4) | (5) | (6) | (7) | (8) | (9) |
| SDSS J001111.97+005626.3 | 0.409 | 60001065002 | 2013 Jan 27 | 18.3 ks | XMM-Newton | 0403760301 | 2006 Jul 10 | 25.7 ks |
| SDSS J005621.72+003235.8 | 0.484 | 60001061002 | 2013 Jan 27 | 21.9 ks | Chandra | 7746 | 2008 Feb 08 | 9.91 ks |
| SDSS J115718.35+600345.6 | 0.491 | 60001071002 | 2012 Oct 28 | 21.7 ks | Chandra | 5698 | 2005 Jun 03 | 6.97 ks |
NOTE. – (1): Full SDSS object name. (2): Redshift. (3) and (4): NuSTAR observation ID and start date. (5): Net on-axis NuSTAR exposure time. This value applies to both FPMA and FPMB. (6) Lower energy X-ray observatory data used (Chandra or XMM-Newton). (7), (8) and (9): Chandra or XMM-Newton observation ID, observation start date, and net on-axis exposure time, corrected for flaring and bad events.
We processed the data using the NuSTAR Data Analysis Software (NuSTARDAS) v. 1.3.0. Calibrated and cleaned event files were produced using the nupipeline script and the NuSTAR CALDB 20131007 release with the standard filter flags.
3.1.1 Photometry and Source Detection
To characterize the high energy X-ray emission and determine whether sources are detected, we performed photometry in the observed-frame – keV, – keV, and – keV bands for both of the NuSTAR FPMs following Alexander et al. (2013). We avoided using photons above keV, where the drop in effective area and the prominent background features (see Figure 2 and 10 of Harrison et al. 2013, respectively) hinder the analysis of faint X-ray sources such as Type 2 quasars. We split the NuSTAR event files into individual band images using dmcopy, part of the Chandra Interactive Analysis Observations software (CIAO, v4.4; Fruscione et al. 2006).444http://cxc.harvard.edu/ciao/index.html We extracted the gross source counts () from a ″ radius aperture centered on the SDSS position. For a source at the NuSTAR aim point, and for the energy range (– keV) and spectral slopes (–) used in this study, this aperture encloses of the full PSF energy. We extracted the background counts () from an annulus with an inner radius ″ from the source and an outer radius ″ from the source, which allowed the local background to be sampled while minimising contamination from the source. To obtain the background counts in the source extraction region (), we multiplied by the area scaling factor between the source and background regions (). Net source counts were calculated as , and corresponding confidence level uncertainties were taken as . For non detections, we calculated confidence level upper limits using the Bayesian method of Kraft et al. (1991). The NuSTAR photometry is given in Table 2.
| Object Name | Net Counts (FPMA) | Net Counts (FPMB) | Flux (NuSTAR) | Flux (other) | ||||||
|---|---|---|---|---|---|---|---|---|---|---|
| (1) | (2) | (3) | (4) | (5) | ||||||
| – | – | – | – | – | – | – | – | – | – | |
| 0011+0056 | ||||||||||
| 0056+0032 | ||||||||||
| 1157+6003 | ||||||||||
NOTE. – (1): Abbreviated SDSS object name. The ‘SDSS J’ prefix and all RA and Dec digits after the first four have been truncated. (2) and (3): Net source counts in the observed-frame –, – and – keV bands for FPMA and FPMB, respectively. confidence level uncertainties, and confidence level upper limits are given. (4): Aperture-corrected NuSTAR flux in units of erg s-1 cm-2 (for a power-law model with ), in the observed-frame –, – and – keV bands. For SDSS J0011+0056 the fluxes are for FPMA only, while for SDSS J0056+0032 and SDSS J1157+6003 the fluxes are averaged over FPMA and FPMB. (5): Aperture-corrected observed-frame – keV flux in units of erg s-1 cm-2 (for a power-law model with ), as measured using lower-energy X-ray data. XMM-Newton data have been used for SDSS J0011+0056, and Chandra data have been used for SDSS J0056+0032 and SDSS J1157+6003. confidence level upper limits are given.
To test whether the quasars are detected in the individual NuSTAR band images, we looked for significant source signals at their SDSS positions. We assumed binomial statistics and calculated false probabilities, or ‘no-source’ probabilities (), using the following equation:
| (1) |
where and . is the probability that, assuming there is no source at the SDSS position, the measured gross counts in the source aperture () are purely due to a background fluctuation (Weisskopf et al., 2007).
Given that the three Type 2 quasars are faint at – keV (see Table 2 for Chandra and XMM-Newton fluxes and upper limits), and likely have flat X-ray spectra with emission rising steeply to higher energies, NuSTAR is most likely to detect the sources above keV (observed-frame). At these energies Chandra and XMM-Newton have little to no sensitivity. In Figure 1, we show the and values measured with NuSTAR for the – keV band (filled symbols), and the no-source probabilities to which they correspond (dashed lines).555We avoid overplotting the errors for individual and measurements, since these are not used in the calculation of no-source probabilities.
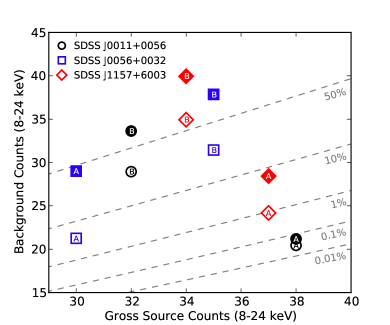
For the purposes of this figure, Poisson statistics have been assumed; for our sources, is large and the Poisson integral thus provides a good approximation of Equation 1 (Weisskopf et al., 2007). Taking binomial no-source probabilities greater than to indicate non detections, neither SDSS J0056+0032 nor SDSS J1157+6003 are detected in either FPM. SDSS J0011+0056, on the other hand, is detected in FPMA with a binomial no-source probability of .666We note that, in this case, using a ″ (as opposed to ″) source aperture results in a lower no-source probability of . The NuSTAR image corresponding to this detection is shown in Figure 2.
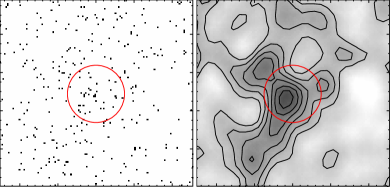
The source is not detected in FPMB, which has higher background noise relative to FPMA for this observation; indeed the net source counts for FPMA are consistent with the upper limit for FPMB (see Table 2). SDSS J0011+0056 is also weakly detected in the – keV band for FPMA, with a binomial no-source probability of . Aside from this, none of the quasars are detected in the – keV and – keV bands.
The no-source probability is sensitive to the background region sampled. To partially address this we also measured the background from model background maps produced using nuskybgd (Wik et al., in prep.), summing counts within the ″ radius source aperture. These measurements are shown as empty symbols in Figure 1. SDSS J0011+0056 is still detected in FPMA using this approach, with a no-source probability of at – keV.
3.1.2 Flux Calculation
For each NuSTAR energy band we determined the conversion factor between net count rate and source flux using XSPEC v12.8.1j (Arnaud, 1996), taking into account the Response Matrix File (RMF) and Ancillary Response File (ARF) for each FPM. We assumed a power-law model with , consistent with that found for AGN at observed-frame – keV (Alexander et al., 2013). We corrected fluxes to the encircled-energy fraction of the PSF. The NuSTAR fluxes are given in Table 2.
For the NuSTAR-detected quasar, SDSS J0011+0056, we measure an observed-frame – keV flux of erg s-1 cm-2. This value is consistent with extrapolations from the XMM-Newton – keV count rate given the photon index constraints of Jia et al. (2013), , and assuming a simple unabsorbed power-law model. Additionally, as we later show in Section 4.2, our X-ray flux measurement for SDSS J0011+0056 is consistent with that expected from its m luminosity, which is assumed to result from the reprocessing of AGN emission by obscuring dust.
3.2. Lower Energy X-ray Data
For SDSS J0011+0056 we used the archival XMM-Newton EPIC observation, first published in Jia et al. (2013). We analyzed the Pipeline Processing System (PPS) data products for this observation using the Science Analysis Software777http://xmm.esa.int/sas/ (SAS v.12.0.1). The MOS1 and MOS2 data were coadded with the SAS task epicspeccombine. The PN data were excluded, since SDSS J0011+0056 is close to a chip gap. The source counts were extracted from a ″ radius aperture and the background counts were extracted using an ″ radius source-free aperture, selected to sample the local background while avoiding chip gaps and nearby serendipitous sources. We used XSPEC to convert from count rate to flux, assuming a power-law model with and using the XMM-Newton RMF and ARF. Throughout this work, we neglect the cross-calibration constants between MOS and NuSTAR as the current best estimates are (Madsen et al., in prep.), and a change on this scale does not affect our results.
For SDSS J0056+0032 and SDSS J1157+6003 we used the archival Chandra observations, first published in Vignali et al. (2006, 2010). We reprocessed the data using chandra_repro,888http://cxc.harvard.edu/ciao/ahelp/chandra_repro.html a CIAO pipeline, to create event files. The source counts were extracted from a ″ radius aperture, and the background counts were extracted from an annulus with an inner radius ″ from the source and an outer radius ″ from the source. As SDSS J0056+0032 and SDSS J1157+6003 are non detections at observed-frame – keV, we calculated confidence level upper limits for the source counts using the Bayesian method of Kraft et al. (1991). To calculate fluxes, we converted from Chandra count rates with the HEASARC tool WebPIMMs999http://heasarc.gsfc.nasa.gov/Tools/w3pimms.html (v4.6b) assuming a power-law model with , and corrected to the encircled-energy fraction of the PSF.
As the Type 2 quasars are faint at X-ray wavelengths, we are unable to fit the spectra accurately. For instance, SDSS J0011+0056 is detected with XMM-Newton, but using the combined MOS1+MOS2 data we only extract and net source counts in the observed-frame – keV and – keV bands, respectively. We list the Chandra and XMM-Newton – keV fluxes and upper limits in Table 2.
3.3. Near-UV to Mid-IR Data and SED Decomposition
To investigate the multiwavelength properties of the three Type 2 quasars, in particular the mid-IR emission from the AGN, we collected photometric data at – m (i.e., at near-UV through mid-IR wavelengths). We used imaging data from public large-area surveys, primarily the Sloan Digital Sky Survey (SDSS; York et al., 2000), the UKIRT Infrared Deep Sky Survey (UKIDSS; Lawrence et al., 2007), and the WISE all-sky survey (Wright et al., 2010). Additionally, for SDSS J0056+0032 and SDSS J1157+6003, we used Spitzer photometry from the Spitzer Enhanced Imaging Products Source List.101010http://irsa.ipac.caltech.edu/data/SPITZER/Enhanced/Imaging/ The photometric dataset, not corrected for Galactic extinction, is provided in Table 3. We note that since the observations are not contemporaneous, AGN variability may affect the SED analysis at longer wavelengths, where the AGN is bright with respect to the host galaxy.
| Object Namea | 0011+0056 | 0056+0032 | 1157+6003 |
|---|---|---|---|
| (0.355 m)b | |||
| (0.468 m)b | |||
| (0.616 m)b | |||
| (0.748 m)b | |||
| (0.892 m)b | |||
| (1.03 m)c | |||
| (1.25 m)c | |||
| (1.63 m)c | |||
| (2.20 m)c | |||
| WISE (3.4 m)d | |||
| WISE (4.6 m)d | |||
| WISE (12 m)d | |||
| WISE (22 m)d | |||
| Spitzer (3.6 m)e | |||
| Spitzer (4.5 m)e | |||
| Spitzer (5.8 m)e | |||
| Spitzer (8.0 m)e | |||
| Spitzer (24 m)f | |||
| IRAS (60 m)g | |||
| h | |||
| h |
NOTE. – a Abbreviated SDSS object name; b SDSS DR7 Fiber magnitudes in the AB sinh system; c UKIDSS DR9 2.8″ diameter aperture magnitudes in the Vega system; d WISE profile-fit magnitudes in the Vega system; e Spitzer 3.8″ diameter aperture flux densities in units of mJy; f Spitzer PSF-fit flux densities in units of mJy; g IRAS flux density in units of mJy (Zakamska et al., 2004). This data point was not used in the SED modeling; h best-fit parameters (corrected for dust reddening) from the SED decomposition described in Section 3.3: is the fractional contribution of the AGN to the – m emission; is the rest-frame m luminosity () of the AGN in units of erg s-1. The uncertainties are standard deviations, derived from the Monte Carlo re-sampling of the photometric data.
We used the near-UV through mid-IR photometric data to produce broad-band spectral energy distributions (SEDs) for our sample. We modeled the SEDs using the Assef et al. (2010) 0.03–30 m empirical low-resolution AGN and galaxy templates. Each SED was modeled as a best-fit combination of an elliptical, a spiral and an irregular galaxy component, plus an AGN. We refer the reader to Assef et al. (2008, 2010, 2013) for further details. In Fig. 3 we present the SEDs and best-fitting model solutions.
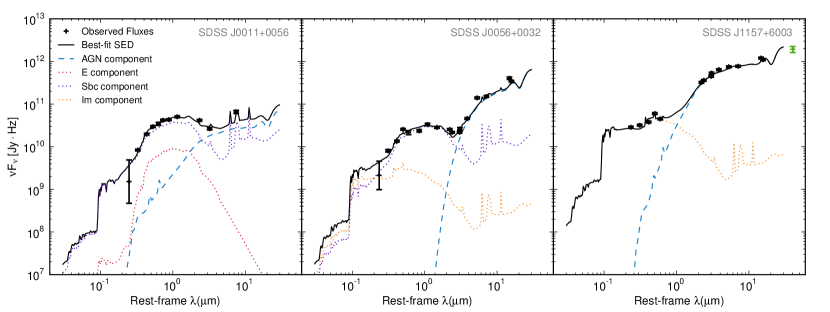
For SDSS J1157+6003 we also show the IRAS 60 m flux measured by Zakamska et al. (2004, green data point in Fig. 3), which lies beyond the wavelength range of the galaxy templates and was therefore excluded from the SED modeling. The data point is consistent with a simple extrapolation of the best-fitting model from shorter wavelengths. Zakamska et al. (2004) also detect SDSS J0056+0032 at 60 m, but at a low significance level ( confidence). In Table 3 we provide the best-fitting parameters (the fractional contribution from the AGN component to the – m emission after correction for dust reddening; Assef et al. 2010) and (the luminosity of the AGN component at rest-frame m after correction for dust reddening; ). The uncertainties on and are standard deviations, derived from the Monte Carlo re-sampling of the data according to the photometric uncertainties. Both parameters are well constrained.111111Constraining and is the primary purpose of our SED analysis. We do not read deeply into the host-galaxy properties of the best fitting solutions. Since our SED modeling uses a single AGN template, it does not account for the fact that AGN show a range of heated dust emission relative to the bolometric emission of the accretion disk. For instance, assuming the distribution of quasar covering factors found by Roseboom et al. (2013) would introduce an additional uncertainty to the m luminosities of . Our three Type 2 quasars have high values, which indicates that they are AGN-dominated at – m. For SDSS J0056+0032 and SDSS J1157+6003 this is in agreement with the Spitzer-IRS spectroscopy of Zakamska et al. (2008), which shows the sources to be AGN-dominated at mid-IR wavelengths (for SDSS J0011+0056 there is no mid-IR spectroscopy available).
4. Results
The three Type 2 quasars in this work bear the signatures of heavily obscured, Compton-thick AGN based on multi-wavelength diagnostics (see Section 2 of this work; Zakamska et al., 2008; Vignali et al., 2010; Jia et al., 2013). Here we present the results of our analysis, which is aimed at assessing the prevalence of extreme absorption in these systems.
X-rays provide a direct measure of AGN emission that has been subject to circumnuclear absorption. As such, the characterisation of X-ray spectra is necessary to obtain reliable estimates of absorbing column densities ().121212All values in this Section are line-of-sight column densities unless otherwise stated. In the MYTorus model, is related to the equatorial column density ( via Equation 1 in Murphy & Yaqoob (2009). For SDSS J0011+0056 we detect X-rays over the observed-frame – keV energy range, and for SDSS J0056+0032 and SDSS J1157+6003 we place upper limits on the – keV emission (see Table 2). As the quasars are at best weak detections at – keV, detailed modeling of their X-ray spectra is unfeasible. For SDSS J0011+0056 we characterize the observed-frame – keV X-ray spectrum using the ratio of hard (– keV) to soft (– keV) emission, which provides a direct absorption constraint (see Section 4.1). For the remaining two quasars we are limited to indirect absorption constraints from the comparison of the observed X-ray emission with the intrinsic X-ray emission implied by infrared measurements (see Section 4.2).
4.1. Direct (X-ray) Absorption Constraints
SDSS J0011+0056 is detected with NuSTAR in the – keV band, but not in the – keV band. We measure a confidence level lower limit for the NuSTAR X-ray band ratio (i.e., the ratio of – keV counts to – keV counts), of . In Figure 4 we show the NuSTAR band ratio against redshift for SDSS J0011+0056 and the first sources detected in the NuSTAR extragalactic survey (Alexander et al., 2013); the SDSS J0011+0056 band ratio is amongst the most extreme.

We compare the band ratio with predictions from a simple absorbed power-law (zwabspow) model and the MYTorus model (Murphy & Yaqoob, 2009), both of which are implemented in XSPEC. MYTorus is a self-consistent physical model that is valid for the energy range – keV, and for column densities of – cm-2. It is more suitable than the zwabspow model for column densities of cm -2, where a careful treatment of scattering and reflection is needed (for instance, see Figure 5). In the MYTorus model, an obscuring torus reprocesses X-rays from a central source, and the resulting X-ray spectrum has both transmitted and scattered components. In the current implementation of MYTorus, the half-opening angle of the obscuring medium is fixed to (i.e., a covering factor of ), a value inferred from the obscured AGN fraction of Seyfert galaxies. We note that a larger half-opening angle could be more appropriate in this study of Type 2 quasars, since the obscured AGN fraction is observed to decrease with luminosity (e.g., Ueda et al., 2003; Lusso et al., 2013). We assume a specific MYTorus model with an intrinsic photon index of (typical value for AGN at observed-frame – keV; Alexander et al. 2013) and an inclination angle of , referred to as Model A hereafter. Varying between and , where corresponds to an edge-on view through the equatorial plane of the torus, makes a negligible difference to the MYTorus band ratio tracks in Figure 4. We avoid using values close to , below which the line-of-sight X-ray emission does not intercept the torus and the MYTorus model therefore describes an unobscured AGN. As shown in Figure 4, the NuSTAR band ratio lower limit for SDSS J0011+0056 corresponds to an absorbing column density of cm-2. This implies heavy, but not necessarily Compton-thick, absorption.
Since XMM-Newton is more sensitive than NuSTAR at keV, we also measure an X-ray band ratio for SDSS J0011+0056 using the XMM-Newton – keV data and NuSTAR – keV data, which gives a NuSTAR/XMM-Newton band ratio of ( confidence level). One limitation of the measurement is that we are unable to assess whether the X-ray emission of SDSS J0011+0056 has varied significantly in the years between the XMM-Newton and NuSTAR observations; if the XMM-Newton count rate is relatively low, we overestimate the band ratio, and vice versa. In Figure 5, we compare the measured NuSTAR/XMM-Newton band ratio with predictions from the MYTorus and zwabspow models as a function of column density.
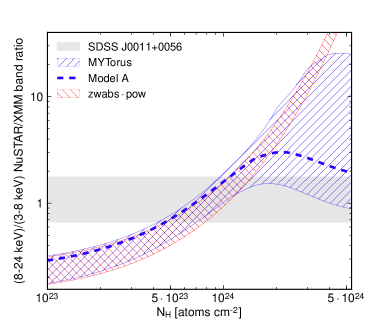
We fixed the model redshifts to that of SDSS J0011+0056 (), used a range of intrinsic photon indices corresponding to those observed for unobscured AGN (; e.g., Mateos et al., 2010; Scott et al., 2011), and used a range of inclination angles in the MYTorus model (). The resulting tracks in Figure 5 suggest that SDSS J0011+0056 is absorbed by cm -2, which is consistent with the NuSTAR band ratio analysis (Figure 4). Assuming Model A ( and ), the observed NuSTAR/XMM-Newton band ratio for SDSS J0011+0056 implies a column density of cm -2 (i.e. heavy, but not clearly Compton-thick, absorption is required to produce the observed – keV X-ray spectrum). This result is consistent with column density estimates from indirect methods, as shown in Section 4.2. For comparison, the highest column densities directly constrained by Vignali et al. (2006, 2010) in their keV analysis of SDSS-selected Type 2 quasars are cm -2.
The above constraint for SDSS J0011+0056 must be treated with a degree of caution, since it depends on the assumed X-ray spectral model. Here we assess the impact on our result of two spectral complexities, both of which are important in the case of Type 2 quasars. First, a soft ‘scattered’ power law component is commonly observed for obscured AGN which may be either nuclear emission scattered by hot gas (e.g., Turner et al., 1997), or ‘leakage’ of nuclear emission due to partial covering (e.g., Vignali et al., 1998; Corral et al., 2011). Adding a scattered component which is of the primary transmitted power law (a typical X-ray scattering fraction for Type 2 Seyferts; e.g., Turner et al., 1997) to Model A, we obtain a consistent result: cm -2 ( confidence level lower limit). Second, the absorbing medium may have a complex geometry (e.g., a clumpy torus) that requires the equatorial and line-of-sight column densities of the MYTorus model ( and , respectively) to be treated independently. Decoupling these two parameters in Model A and setting to the maximum possible value of cm -2 yields a consistent result: cm -2. Last, we emphasize that although MYTorus is a relatively complex model, the constraints do not differ significantly from those using a simple zwabspow model in the Compton-thin regime (see Figure 5). We conclude that the inferred for SDSS J0011+0056 does not change significantly with the assumed spectral model.
4.2. Indirect Absorption Constraints
The X-ray emission in heavily obscured AGN is subject to significant absorption along the line of sight. The mid-IR emission, on the other hand, has been reprocessed by the dust obscuring the AGN and is less sensitive to extinction. The mid-IR luminosity therefore provides an estimate of the intrinsic AGN power. As such, the presence of absorption in an AGN can be inferred from the observed X-ray to mid-IR luminosity ratio (e.g., Lutz et al., 2004; Alexander et al., 2008; LaMassa et al., 2009; Goulding et al., 2011; LaMassa et al., 2011). We note that the mid-IR emission is also significantly absorbed for of Compton-thick AGN (e.g., Bauer et al., 2010; Goulding et al., 2012). Indeed, SDSS J0056+0032 has significant Si-absorption at m, in contrast to SDSS J1157+6003 (see Section 2). To account for this, we have corrected our mid-IR luminosities for dust reddening (see Section 3.3). In Figure 6 we compare the rest-frame X-ray luminosities () of our three Type 2 quasars with the rest-frame m luminosities (), exploring both the low energy (– keV) and high energy (– keV) X-ray regimes.
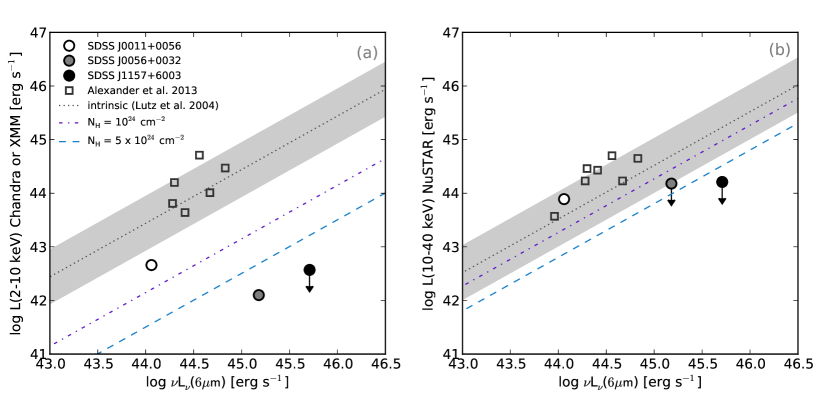
For SDSS J0011+0056, was obtained through photometry in the rest-frame – keV band using XMM-Newton data (see Section 3.2). For SDSS J0056+0032 and SDSS J1157+6003, was obtained through photometry in the observed-frame – keV band using Chandra data (see Section 3.2), and an extrapolation to the rest-frame – keV band assuming a power-law model with . The values were obtained through a photometric analysis in the rest-frame – keV band using NuSTAR data (see Section 3.1). The m luminosities are from SED fitting (Section 3.3) and relate specifically to the emission from the AGN.
In the rest-frame – keV band, the Type 2 quasars fall below the intrinsic X-ray–mid-IR luminosity relation found for AGN in the local universe (Lutz et al., 2004); see Figure 6a. For comparison, we also show the non-beamed sources detected in the NuSTAR extragalactic survey (Alexander et al., 2013), which lie within the scatter of the Lutz et al. (2004) relation. The – keV luminosity suppression of the three Type 2 quasars is expected given our selection and has previously been demonstrated for SDSS J0056+0032 and SDSS J1157+6003 (Vignali et al., 2006, 2010). Assuming the suppression of the X-ray emission is due to absorption, as opposed to intrinsic X-ray weakness, we estimate the column densities of these systems by comparing with the X-ray to mid-IR luminosity ratios for AGN absorbed by cm-2 and cm-2 (dash-dotted and dashed lines in Figure 6a, respectively). On the basis of this analysis, the – keV luminosities of SDSS J0056+0032 and SDSS J1157+6003 are consistent with being absorbed by a factor of , and therefore lie well within the Compton-thick region with cm -2. The X-ray emission from SDSS J0011+0056, on the other hand, is suppressed by a factor of , but is still consistent with being Compton-thick or near Compton-thick ( cm -2). Since our – keV luminosities were calculated assuming a power-law, which is probably not consistent with heavy absorption at , we repeated the flux calculations in Section 3.2 assuming (the spectral slope of SDSS J0011+0056 as measured by Jia et al. (2013); see Section 2). This results in values which are higher by a factor of ; not enough to significantly change the conclusions drawn from Figure 6a.
In the rest-frame – keV band, the X-ray emission is only strongly suppressed for column densities of cm-2, and therefore NuSTAR observes the intrinsic X-ray emission for all but the most heavily obscured AGN; see Figure 6b. For comparison, Matsuta et al. (2012) studied Swift/BAT-detected AGN and found that for – keV, only of Compton-thick objects have significant X-ray suppression with respect to the intrinsic X-ray to mid-IR luminosity ratio. The results in Figure 6b suggest that the X-ray emission from SDSS J0011+0056 is not significantly suppressed at – keV, and is absorbed by cm -2. This is consistent with the X-ray band ratio analysis in Section 4.1. SDSS J0056+0032 is consistent with being Compton-thick, with cm -2. SDSS J1157+6003 is the strongest candidate for being Compton-thick based on this analysis. Its – keV luminosity is consistent with being absorbed by a factor of , despite the high X-ray energies being probed, which again suggests an extreme column density of cm -2. Assuming , rather than , for the NuSTAR count rate to flux conversion (Section 3.1.2) results in values which are a higher by a factor of ; again, not enough to significantly change the conclusions drawn from Figure 6b. As an independent test, we repeated our indirect analyses using [O III] luminosity as a measure of intrinsic AGN power (i.e., using ). This yielded very similar results; NuSTAR observes the intrinsic X-ray emission of SDSS J0011+0056, while SDSS J0056+0032 and SDSS J1157+6003 are consistent with being heavily Compton-thick ( cm -2). However, since our sample was originally selected on the basis of high [O III] luminosity (Zakamska et al., 2003; Reyes et al., 2008), we consider the results to be more reliable. Nevertheless, the ratio alone is not a robust indicator of Compton-thick absorption, even if the m emission accurately reflects the intrinsic power of the AGN. First, some quasars can be intrinsically X-ray weak (e.g., Gallagher et al. 2001; Wu et al. 2011; Luo et al. 2013; Teng et al. 2013, ApJ, submitted). Second, inferred column densities depend on the assumed X-ray spectral model (e.g., Yaqoob & Murphy, 2011; Georgantopoulos et al., 2011a). For instance, adding an additional soft scattered component, with a scattering fraction of , to the MYTorus model predicts a ratio for cm -2 which is a factor of three higher than that shown in Figure 6b. However, this is not enough to change our broad conclusions regarding the column densities of SDSS J0056+0032 and SDSS J1157+6003. Ultimately, deeper X-ray observations, with simultaneous coverage at low and high energies, are required to directly constrain and provide more robust evidence for or against the presence of Compton-thick absorption in these Type 2 quasars.
5. Summary and Future Work
We have presented the first sensitive high energy ( keV) analysis of optically selected Type 2 quasars. The sample consists of three objects that show evidence for Compton-thick absorption ( cm -2) on the basis of different diagnostics (see Section 2). To summarize our main results:
-
•
One of the Type 2 quasars, SDSS J0011+0056, is detected by NuSTAR with counts in the – keV band. The remaining two, SDSS J0056+0032 and SDSS J1157+6003, are not detected by NuSTAR; see Section 3.1.1.
-
•
For SDSS J0011+0056, we characterize the – keV spectrum using the X-ray band ratio and find evidence for near Compton-thick absorption with cm -2; see Section 4.1. This is consistent with the column densities inferred from the – keV to mid-IR ratio, the – keV to mid-IR ratio, and the X-ray to [O III] ratios; see Section 4.2.
-
•
For SDSS J0056+0032 and SDSS J1157+6003, we find evidence for a significant suppression of the rest-frame – keV luminosity with respect to the mid-IR luminosity. If due to absorption, this result implies that these Type 2 quasars are extreme, Compton-thick systems with cm -2; see Section 4.2.
The characterisation of distant heavily obscured AGN is clearly an extremely challenging pursuit. Nevertheless, as we have demonstrated, the sensitive high energy observations of NuSTAR provide a significant improvement compared to Chandra or XMM-Newton observations alone; for quasars at , high column densities of cm -2 can now be directly constrained. Based on the results obtained in this exploratory study, we are now extending the analysis of optically selected Type 2 quasars to a larger sample which is currently being observed by NuSTAR. Furthermore, NuSTAR is undertaking deep surveys in the ECDFS (Mullaney et al., in prep.) and COSMOS (Civano et al., in prep.) fields, along with a large-area serendipitous survey (Alexander et al., 2013), that are likely to uncover a number of heavily obscured quasars. These upcoming studies will provide a leap forward in our understanding of the column density distribution of distant luminous AGN.
Acknowledgements
We acknowledge financial support from the Science and Technology Facilities Council (STFC) grants ST/K501979/1 (G.B.L.), ST/I001573/1 (D.M.A. and A.D.M.) and ST/J003697/1 (P.G.), the Leverhulme Trust (D.M.A. and J.R.M.), Gemini-CONICYT grant 32120009 (R.J.A.), NSF AST award 1008067 (D.R.B.), the International Fulbright Science and Technology Award (M.B.), Basal-CATA PFB-06/2007 (F.E.B.), CONICYT-Chile grant FONDECYT 1101024 (F.E.B.), CONICYT-Chile grant Anillo ACT1101 (F.E.B.), Caltech NuSTAR subcontract 44A-1092750 (W.N.B. and B.L.), NASA ADP grant NNX10AC99G (W.N.B. and B.L.), NASA ADAP award NNX12AE38G (R.C.H.), National Science Foundation grant 1211096 (R.C.H.), and Swiss National Science Foundation grant PP00P2_138979/1 (M.K.). We thank the referee for the constructive comments, which helped improve our study. This work was supported under NASA Contract No. NNG08FD60C, and made use of data from the NuSTAR mission, a project led by the California Institute of Technology, managed by the Jet Propulsion Laboratory, and funded by the National Aeronautics and Space Administration. We thank the NuSTAR Operations, Software and Calibration teams for support with the execution and analysis of these observations. This research has made use of the NuSTAR Data Analysis Software (NuSTARDAS) jointly developed by the ASI Science Data Center (ASDC, Italy) and the California Institute of Technology (USA).
References
- Alexander et al. (2005) Alexander, D. M., Chartas, G., Bauer, F. E., et al. 2005, MNRAS, 357, L16
- Alexander et al. (2008) Alexander, D. M., Chary, R.-R., Pope, A., et al. 2008, ApJ, 687, 835
- Alexander et al. (2013) Alexander, D. M., Stern, D., Del Moro, A., et al. 2013, ApJ, 773, 125
- Antonucci (1993) Antonucci, R. 1993, ARA&A, 31, 473
- Arnaud (1996) Arnaud, K. A. 1996, in Astronomical Society of the Pacific Conference Series, Vol. 101, Astronomical Data Analysis Software and Systems V, ed. G. H. Jacoby & J. Barnes, 17
- Assef et al. (2008) Assef, R. J., Kochanek, C. S., Brodwin, M., et al. 2008, ApJ, 676, 286
- Assef et al. (2010) —. 2010, ApJ, 713, 970
- Assef et al. (2013) Assef, R. J., Stern, D., Kochanek, C. S., et al. 2013, ApJ, 772, 26
- Bassani et al. (1999) Bassani, L., Dadina, M., Maiolino, R., et al. 1999, ApJS, 121, 473
- Bauer et al. (2010) Bauer, F. E., Yan, L., Sajina, A., & Alexander, D. M. 2010, ApJ, 710, 212
- Cappi et al. (2006) Cappi, M., Panessa, F., Bassani, L., et al. 2006, A&A, 446, 459
- Corral et al. (2011) Corral, A., Della Ceca, R., Caccianiga, A., et al. 2011, A&A, 530, A42
- Donoso et al. (2013) Donoso, E., Yan, L., Stern, D., & Assef, R. J. 2013, ArXiv e-prints, arXiv:1309.2277
- Draper & Ballantyne (2010) Draper, A. R., & Ballantyne, D. R. 2010, ApJ, 715, L99
- Fabian et al. (2008) Fabian, A. C., Vasudevan, R. V., & Gandhi, P. 2008, MNRAS, 385, L43
- Fruscione et al. (2006) Fruscione, A., McDowell, J. C., Allen, G. E., et al. 2006, in Society of Photo-Optical Instrumentation Engineers (SPIE) Conference Series, Vol. 6270, Society of Photo-Optical Instrumentation Engineers (SPIE) Conference Series
- Gallagher et al. (2001) Gallagher, S. C., Brandt, W. N., Laor, A., et al. 2001, ApJ, 546, 795
- Gandhi et al. (2009) Gandhi, P., Horst, H., Smette, A., et al. 2009, A&A, 502, 457
- Georgantopoulos et al. (2011a) Georgantopoulos, I., Rovilos, E., Akylas, A., et al. 2011a, A&A, 534, A23
- Georgantopoulos et al. (2011b) Georgantopoulos, I., Dasyra, K. M., Rovilos, E., et al. 2011b, A&A, 531, A116
- Ghisellini et al. (1994) Ghisellini, G., Haardt, F., & Matt, G. 1994, MNRAS, 267, 743
- Gilli et al. (2007) Gilli, R., Comastri, A., & Hasinger, G. 2007, A&A, 463, 79
- Gilli et al. (2010) Gilli, R., Vignali, C., Mignoli, M., et al. 2010, A&A, 519, A92
- Goulding et al. (2012) Goulding, A. D., Alexander, D. M., Bauer, F. E., et al. 2012, ApJ, 755, 5
- Goulding et al. (2011) Goulding, A. D., Alexander, D. M., Mullaney, J. R., et al. 2011, MNRAS, 411, 1231
- Harrison et al. (2013) Harrison, F. A., Craig, W. W., Christensen, F. E., et al. 2013, ApJ, 770, 103
- Hasinger et al. (2005) Hasinger, G., Miyaji, T., & Schmidt, M. 2005, A&A, 441, 417
- Hazard et al. (1963) Hazard, C., Mackey, M. B., & Shimmins, A. J. 1963, Nature, 197, 1037
- Heckman et al. (2005) Heckman, T. M., Ptak, A., Hornschemeier, A., & Kauffmann, G. 2005, ApJ, 634, 161
- Hopkins et al. (2008) Hopkins, P. F., Hernquist, L., Cox, T. J., & Kereš, D. 2008, ApJS, 175, 356
- Jia et al. (2013) Jia, J., Ptak, A., Heckman, T., & Zakamska, N. L. 2013, ApJ, 777, 27
- Kraft et al. (1991) Kraft, R. P., Burrows, D. N., & Nousek, J. A. 1991, ApJ, 374, 344
- Lacy et al. (2004) Lacy, M., Storrie-Lombardi, L. J., Sajina, A., et al. 2004, ApJS, 154, 166
- LaMassa et al. (2009) LaMassa, S. M., Heckman, T. M., Ptak, A., et al. 2009, ApJ, 705, 568
- LaMassa et al. (2011) —. 2011, ApJ, 729, 52
- Lawrence et al. (2007) Lawrence, A., Warren, S. J., Almaini, O., et al. 2007, MNRAS, 379, 1599
- Levenson et al. (2002) Levenson, N. A., Krolik, J. H., Życki, P. T., et al. 2002, ApJ, 573, L81
- Luo et al. (2013) Luo, B., Brandt, W. N., Alexander, D. M., et al. 2013, ApJ, 772, 153
- Lusso et al. (2013) Lusso, E., Hennawi, J. F., Comastri, A., et al. 2013, ArXiv e-prints, arXiv:1309.0814
- Lutz et al. (2004) Lutz, D., Maiolino, R., Spoon, H. W. W., & Moorwood, A. F. M. 2004, A&A, 418, 465
- Maiolino et al. (1998) Maiolino, R., Salvati, M., Bassani, L., et al. 1998, A&A, 338, 781
- Mateos et al. (2010) Mateos, S., Carrera, F. J., Page, M. J., et al. 2010, A&A, 510, A35
- Matsuta et al. (2012) Matsuta, K., Gandhi, P., Dotani, T., et al. 2012, ApJ, 753, 104
- McCarthy (1993) McCarthy, P. J. 1993, ARA&A, 31, 639
- Meléndez et al. (2008) Meléndez, M., Kraemer, S. B., Armentrout, B. K., et al. 2008, ApJ, 682, 94
- Miley & De Breuck (2008) Miley, G., & De Breuck, C. 2008, A&A Rev., 15, 67
- Minkowski (1960) Minkowski, R. 1960, ApJ, 132, 908
- Mulchaey et al. (1994) Mulchaey, J. S., Koratkar, A., Ward, M. J., et al. 1994, ApJ, 436, 586
- Murphy & Yaqoob (2009) Murphy, K. D., & Yaqoob, T. 2009, MNRAS, 397, 1549
- Netzer et al. (2006) Netzer, H., Mainieri, V., Rosati, P., & Trakhtenbrot, B. 2006, A&A, 453, 525
- Norman et al. (2002) Norman, C., Hasinger, G., Giacconi, R., et al. 2002, ApJ, 571, 218
- Osterbrock (1981) Osterbrock, D. E. 1981, ApJ, 249, 462
- Panessa et al. (2006) Panessa, F., Bassani, L., Cappi, M., et al. 2006, A&A, 455, 173
- Pâris et al. (2012) Pâris, I., Petitjean, P., Aubourg, É., et al. 2012, A&A, 548, A66
- Ptak et al. (2006) Ptak, A., Zakamska, N. L., Strauss, M. A., et al. 2006, ApJ, 637, 147
- Reyes et al. (2008) Reyes, R., Zakamska, N. L., Strauss, M. A., et al. 2008, AJ, 136, 2373
- Risaliti et al. (1999) Risaliti, G., Maiolino, R., & Salvati, M. 1999, ApJ, 522, 157
- Roseboom et al. (2013) Roseboom, I. G., Lawrence, A., Elvis, M., et al. 2013, MNRAS, 429, 1494
- Salpeter (1964) Salpeter, E. E. 1964, ApJ, 140, 796
- Sanders et al. (1988) Sanders, D. B., Soifer, B. T., Elias, J. H., et al. 1988, ApJ, 325, 74
- Schmidt (1963) Schmidt, M. 1963, Nature, 197, 1040
- Scott et al. (2011) Scott, A. E., Stewart, G. C., Mateos, S., et al. 2011, MNRAS, 417, 992
- Shi et al. (2006) Shi, Y., Rieke, G. H., Hines, D. C., et al. 2006, ApJ, 653, 127
- Soltan (1982) Soltan, A. 1982, MNRAS, 200, 115
- Steffen et al. (2006) Steffen, A. T., Strateva, I., Brandt, W. N., et al. 2006, AJ, 131, 2826
- Steidel et al. (2002) Steidel, C. C., Hunt, M. P., Shapley, A. E., et al. 2002, ApJ, 576, 653
- Stern et al. (2002) Stern, D., Moran, E. C., Coil, A. L., et al. 2002, ApJ, 568, 71
- Stern et al. (2005) Stern, D., Eisenhardt, P., Gorjian, V., et al. 2005, ApJ, 631, 163
- Stern et al. (2012) Stern, D., Assef, R. J., Benford, D. J., et al. 2012, ApJ, 753, 30
- Treister & Urry (2005) Treister, E., & Urry, C. M. 2005, ApJ, 630, 115
- Treister et al. (2009) Treister, E., Urry, C. M., & Virani, S. 2009, ApJ, 696, 110
- Turner et al. (1997) Turner, T. J., George, I. M., Nandra, K., & Mushotzky, R. F. 1997, ApJ, 488, 164
- Ueda et al. (2003) Ueda, Y., Akiyama, M., Ohta, K., & Miyaji, T. 2003, ApJ, 598, 886
- Urry & Padovani (1995) Urry, C. M., & Padovani, P. 1995, PASP, 107, 803
- Vanden Berk et al. (2001) Vanden Berk, D. E., Richards, G. T., Bauer, A., et al. 2001, AJ, 122, 549
- Véron-Cetty & Véron (2010) Véron-Cetty, M.-P., & Véron, P. 2010, A&A, 518, A10
- Vignali et al. (2006) Vignali, C., Alexander, D. M., & Comastri, A. 2006, MNRAS, 373, 321
- Vignali et al. (2010) Vignali, C., Alexander, D. M., Gilli, R., & Pozzi, F. 2010, MNRAS, 404, 48
- Vignali et al. (1998) Vignali, C., Comastri, A., Stirpe, G. M., et al. 1998, A&A, 333, 411
- Weisskopf et al. (2007) Weisskopf, M. C., Wu, K., Trimble, V., et al. 2007, ApJ, 657, 1026
- Wright et al. (2010) Wright, E. L., Eisenhardt, P. R. M., Mainzer, A. K., et al. 2010, AJ, 140, 1868
- Wu et al. (2011) Wu, J., Brandt, W. N., Hall, P. B., et al. 2011, ApJ, 736, 28
- Yaqoob & Murphy (2011) Yaqoob, T., & Murphy, K. D. 2011, MNRAS, 412, 835
- York et al. (2000) York, D. G., Adelman, J., Anderson, Jr., J. E., et al. 2000, AJ, 120, 1579
- Zakamska et al. (2008) Zakamska, N. L., Gómez, L., Strauss, M. A., & Krolik, J. H. 2008, AJ, 136, 1607
- Zakamska et al. (2004) Zakamska, N. L., Strauss, M. A., Heckman, T. M., Ivezić, Ž., & Krolik, J. H. 2004, AJ, 128, 1002
- Zakamska et al. (2003) Zakamska, N. L., Strauss, M. A., Krolik, J. H., et al. 2003, AJ, 126, 2125