Pair-dominated GeV-optical flash in GRB 130427A
Abstract
We show that the light curve of the double GeV+optical flash in GRB 130427A is consistent with radiation from the blast wave in a wind-type medium with density parameter g cm-1. The peak of the flash is emitted by copious pairs created and heated in the blast wave; our first-principle calculation determines the pair-loading factor and temperature of the shocked plasma. Using detailed radiative transfer simulations we reconstruct the observed double flash. The optical flash is dominated by synchrotron emission from the thermal plasma behind the forward shock, and the GeV flash is produced via inverse Compton (IC) scattering by the same plasma. The seed photons for IC scattering are dominated by the prompt MeV radiation during the first tens of seconds, and by the optical to X-ray afterglow thereafter. IC cooling of the thermal plasma behind the forward shock reproduces all GeV data from a few seconds to day. We find that the blast wave Lorentz factor at the peak of the flash is , and the forward shock magnetization is . An additional source is required by the data in the optical and X-ray bands at times s; we speculate that this additional source may be a long-lived reverse shock in the explosion ejecta.
Subject headings:
plasmas — radiation mechanisms: non-thermal — radiative transfer — scattering — gamma-ray burst: general1. Introduction
GRB 130427A was an exceptionally bright gamma-ray burst due to its relative proximity (cosmological redshift , Levan et al. 2013) and high luminosity reaching in the MeV band (Ackermann et al. 2014, hereafter A14; Golenetskii et al. 2013). The burst was accompanied by a GeV flash with peak luminosity (A14) and an optical flash with peak luminosity (Vestrand et al., 2014). It is the first gamma-ray burst (GRB) observed at early times s by both optical and GeV telescopes.
Remarkably, the optical and GeV flashes peaked at approximately the same time s, and both showed a smooth decay after the peak; the optical flux decay was steeper than that in the GeV band. Such double (optical+GeV) flashes were predicted to result from copious pair creation in the blast wave of the GRB explosion (Beloborodov et al. 2013, hereafter B13). In this Letter, we apply this model to GRB 130427A.
In our model, the GeV emission is produced by inverse Compton (IC) cooling of the blast wave (see also Beloborodov, 2005; Fan et al., 2005). The observed spectrum extends to at least GeV, with a 95 GeV photon detected at s and a photon at 34 ks. Such high-energy photons cannot be produced by synchrotron emission (de Jager & Harding 1992; Piran & Nakar 2010; A14; Fan et al. 2013), which makes a strong case for their IC origin.
We calculate the synchrotron and IC cooling of the plasma heated in the forward shock of the explosion using the Monte Carlo radiative transfer code developed in B13. The code self-consistently solves the coupled problem of radiative transfer, pair creation, and blast wave dynamics. The original version of the code included only the prompt radiation as a source of target photons for IC scatterings; here we also include the optical to X-ray afterglow radiation, which dominates seed photons for IC scattering at late times. The prompt and afterglow radiation densities used in our calculations are taken from observations.
2. GeV flash
2.1. Pair-dominated peak
The external medium ahead of the blast wave is exposed to the prompt GRB radiation, which pre-accelerates the medium and loads it with copious pairs (Thompson & Madau, 2000; Beloborodov, 2002). Bright bursts -enrich the external medium by a factor at radii cm. B13 showed that this effect leads to a bright GeV+optical flash. The forward shock heats the pair-enriched medium to the thermal Lorentz factor given by
| (1) |
where is the blast wave Lorentz factor, is the pre-acceleration Lorentz factor of the -loaded medium ahead of the blast wave, , is the ion mass per proton in units of ( for hydrogen and for heavier elements), and is the fraction of shocked ion energy transferred to leptons; B13 showed that at early times . In our numerical model presented below we assume as long as ; at later times we take , as suggested by plasma shock simulations (Sironi & Spitkovsky, 2011).
The pair-loading factor steeply decreases at cm and hence grows (Figure 1). This implies a steep rise in the energy of the IC photons, , where are the energies of the seed/target photons. As long as the blast wave overlaps with the prompt radiation, the seed radiation is dominated by the prompt photons with MeV. The onset (and peak) of the GeV flash marks the moment when reaches the GeV band. This occurs when exceeds .
The condition together with the observed peak time determines the radius and Lorentz factor of the blast wave (B13). For GRB 130427A we find,
| (2) |
| (3) |
Here is normalized to the energy of the main prompt MeV episode (Golenetskii et al., 2013) and we have used (Levan et al., 2013).
Assuming that the external medium is a wind from the massive progenitor of the burst, the expected number of GeV photons in the peak of the flash is (B13),
| (4) |
where is the wind density parameter, and is the multiplicity of photons emitted above MeV by a single fast-cooling electron. The pair-loading factor steeply drops from to at (Figure 1). Comparing Equation (4) with the observed (A14, Fan et al. 2013), we conclude that g cm-1 is required. Our detailed transfer simulations show that g cm-1 gives a GeV flash that is close to the observed one.
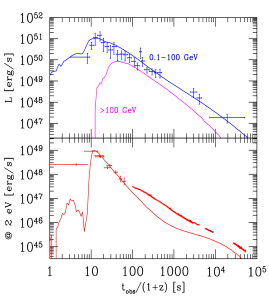
The simulated GeV light curve is shown in the upper panel of Figure 2; the corresponding high-energy spectra at five time intervals are plotted in Figure 3. The emission above MeV is initially soft, but quickly hardens as exceeds 30 and then the spectrum remains roughly flat in . The maximal photon energy, , evolves to the TeV range within a few dynamical times as drops.
2.2. Blast wave deceleration
Our model for the GeV flash gives the parameters , , and , and implies the explosion energy
| (5) |
It is consistent with a high radiative efficiency of the prompt emission, . If the prompt emission is considered as a proxy for the ejecta power, one infers that most of the ejecta kinetic energy is contained in a shell of material about 15 light-seconds thick. The (formal) deceleration radius of the blast wave is
| (6) |
The corresponding timescale is shorter than the duration of the prompt emission. Therefore the reverse shock in this explosion must be relativistic; it crosses the shell in approximately the same time as it takes the main prompt episode to completely overtake the forward shock. The reverse shock crossing marks the time when the bulk of the jet kinetic energy has been transferred to the blast wave. At this point the blast wave is still radiatively efficient (as the pair loading factor is still high); the explosion loses a substantial fraction of its initial energy during the first - s. This results in the steep decline of at cm (Figure 1). At s the blast wave approaches the adiabatic self-similar regime with and .

2.3. Transition to synchrotron-self-Compton cooling
The prompt radiation decouples from the forward shock at s and does not contribute to IC cooling at later times. Then the blast wave is mainly cooled by IC scattering of the afterglow radiation, which is produced by the blast wave itself via synchrotron emission (see also Liu et al., 2013; Tam et al., 2013). Remarkably, the transition to the “synchrotron-self-Compton” (SSC) phase is smooth, with no easily recognizable feature in the GeV light curve (Figure 2). The main reason for this is that the electrons at this stage are still in the fast-cooling regime, which renders their IC emission insensitive to the target photon luminosity.
At the beginning of the SSC phase, is already high and the IC scattering is dominated by low-energy photons, below the Klein-Nishina energy,
| (7) |
where we have used Equation (1) with and , as pair creation is weak at late times. Equation (7) along with implies that the energies of target photons upscattered to the LAT band range from optical to soft X-rays. We approximate the spectral luminosity of the target (afterglow) radiation as
| (8) |
where . We use , for the optical to X-ray spectral index, and for the temporal index (e.g. Perley et al., 2014).
The IC cooling time of the thermal plasma behind the forward shock becomes longer than the dynamical time at s. Our numerical calculations show that the transition to the slow-cooling regime is very gradual with no easily identifiable spectral or temporal signature in the GeV emission (Figure 2).
The decay slope of the high-energy light curve cannot be described by a simple analytical model. Naively, in the fast-cooling stage one would expect , where is the total luminosity dissipated at the shock, yielding . Similarly, in the slow-cooling phase . The simulated light curve is inconsistent with either regime and decays approximately as up to .
This behavior results from a few effects. In the fast-cooling phase the temporal decay is steeper than the naive prediction due to the contribution from secondary pairs produced by the partial absorption of the GeV flash; this effect declines with time and becomes negligible at a few . The decreasing pair loading (up to s) also somewhat steepens the light-curve. Furthermore, the large-angle GeV radiation from the main peak affects the observed light curve after the peak. The gradual transition to the slow cooling regime around results in a broad bump in the light curve as electrons start accumulating at ; the asymptotic slow cooling regime is only approached at d.
The maximum energy of IC photons produced by the thermal electron population, , can accommodate the observed multi-GeV photons at late times, in particular the photon observed at 34 ks.
2.4. TeV emission
The relative proximity and high luminosity of GRB 130427A makes it an interesting target for very high energy (VHE) observations. Our model predicts emission of photons of energies TeV. The simulated VHE light curve above 100 GeV is shown in the top panel of Figure 2 (magenta line). The luminosity above GeV reaches the peak of during the first minute, and most of the VHE fluence should be received in s. Such flashes are detectable with current Cerenkov telescopes. To our knowledge no rapid VHE follow-up was performed for GRB 130427A by presently operating observatories. VERITAS obtained an upper limit at d, which indicates a (temporal or spectral) break when compared with the extrapolation of the earlier LAT observation below 100 GeV (J. McEnery, private communication). This is consistent with our model, as the predicted VHE emission from the thermal electrons behind the shock cuts off at about ks, when the characteristic IC photon energy falls below 100 GeV.
3. Optical flash
The optical flash is produced by synchrotron emission from the same thermal electrons injected at the forward shock that give rise to the GeV emission (B13). The mechanism of the delayed onset, peak and early decay is also analogous. The bright optical flash occurs when the synchrotron emission reaches the optical band as the electron injection Lorentz factor increases, i.e. when , where
| (9) |
and is the cyclotron frequency.
The energetic pairs behind the shock are in the fast-cooling regime at the peak of the flash. As the electron/positron cools, most of the optical radiation is emitted when its Lorentz factor . The approximate optical luminosity is given by (B13)
| (10) |
where the factor accounts for the fraction of energy radiated as synchrotron emission. The observed optical luminosity near the peak, erg/s, requires .
The theoretical optical light curve at is plotted in the lower panel of Figure 2. Compared to the GeV flash, the onset is slightly delayed, because the threshold for producing synchrotron optical radiation is somewhat higher than that for producing IC GeV radiation. The decay of the optical flash is controlled by the declining pair loading factor and is consistent with the observed light curve up to s. At later times synchrotron emission from nonthermal electrons must take over, which is not included in the model shown in Figure 2.
4. Discussion
The observed GeV flash in GRB 130427A can be explained as IC emission from the thermal plasma behind the blast wave in a wind medium, once the pair loading of the blast wave is correctly taken into account. The same model reproduced the GeV flash in GRB 080916C (B13). The exceptional LAT data for GRB 130427A, which extends to d, made it possible to test the model at longer times, when the seed photons for IC scattering change from the prompt radiation to the afterglow. We found that this transition leaves no sharp features and is consistent with the entire observed light curve of GeV emission.
The hot plasma in the blast wave must also emit synchrotron radiation, in particular in the optical band. The predicted optical light curve is very close to the optical flash observed during the first 100 s (Figure 2). This provides further support to the proposed model.
Figure 2, the main result of this paper, shows only emission from the thermal plasma behind the forward shock, which is a robust consequence of shock heating and is straightforward to model from first principles. We also performed a simulation including a nonthermal population of leptons in the forward shock, with an injection spectrum (with ) carrying a fraction of the shock energy. We found that the additional synchrotron and IC radiation produced by this nonthermal component weakly affects the predicted GeV+optical flash. We conclude that the thermal postshock plasma dominates the flash, at least in the region of parameter space explored by our simulations. A higher and a flat electron spectrum would make the contribution from nonthermal particles more significant, especially before the peak of the flash, making the rise toward the peak less sharp. Detailed models with thermal+nonthermal shocked plasma are deferred to a future paper.
After the peak, the synchrotron frequency of the thermal electrons heated by the forward shock remains above the optical band until s. In this situation, the addition of nonthermal electrons with does not significantly increase the optical emission from the forward shock. The additional (nonthermal) contribution to the optical afterglow observed at - s should be produced by a different source, most likely a long-lived reverse shock (Uhm & Beloborodov, 2007; Genet et al., 2007). This agrees with the suggestion of previous works on GRB 130427A (Panaitescu et al., 2013; Laskar et al., 2013; Perley et al., 2014).
Our flash model requires the wind density parameter g cm-1. It is much higher (and more typical of Wolf-Rayet stars) than previously inferred from nonthermal afterglow modeling at min (Panaitescu et al., 2013; Laskar et al., 2013; Perley et al., 2014). A constraint on from the late afterglow comes from the following consideration. When the characteristic synchrotron frequency of the forward shock crosses the optical band (which happens at s in our model) its predicted optical flux is mJy. It should not exceed the observed flux of 2 mJy, a condition satisfied by our model. Models assuming (hydrogen) and require smaller , in agreement with Panaitescu et al. (2013). One should also keep in mind that the wind density profile may deviate from , i.e. the effective may change in the late afterglow. Yet we find no conflict between g cm-1 and radio data at d; the blast wave can produce radio emission without significant self-absorption in the forward or reverse shock.
Our model implies a high radiative efficiency of the blast wave at early times, when pair loading is strong. During the first few s the blast wave energy drops from erg to erg. We expect that in a more detailed model a long-lived reverse shock will add energy to the blast wave and keep from falling to such low values. A few lines of evidence suggest this energy injection. First, this would help to explain the high X-ray luminosity. Without additional energy the power dissipated in the forward shock is low,
| (11) |
It is only a factor of 9 higher than the observed - keV luminosity at s, which would require a very high efficiency of X-ray emission. Secondly, the observed X-ray spectral index indicates that the (nonthermal) electrons are radiating X-rays in the slow cooling regime already at s. At these early times, electrons are mainly cooled by IC scattering (not synchrotron) and the cooling frequency is very sensitive to the blast wave energy, , where , , and , are the afterglow spectral and temporal indices defined in Equation (8). Energy injection via the reverse shock would help to keep above the X-ray band. We find that supplying erg by s may be sufficient to explain the slow-cooling regime in the X-ray band. This can be accomplished by a tail of the GRB jet with carrying energy comparable to the jet head.
The increased will boost the optical luminosity, which can overshoot the observed afterglow, in particular when crosses the optical band at s. This problem could be resolved if is reduced by a factor of by that time. It is not unreasonable to assume that evolves, as physical conditions change in the expanding blast wave; e.g., the pair loading is quickly decreasing. Another factor that can reduce is the increasing cooling length of the shock-heated plasma. Note that describes the average value of the magnetic field in the emission region and depends on how quickly the field decays downstream of the shock (e.g. Lemoine et al., 2013).
The reduction of in the late afterglow phase is also suggested by the high value of the cooling frequency, , inferred from observations by NuSTAR at d. NuSTAR identified a break at keV in the afterglow spectrum, which was interpreted as a cooling break (Kouveliotou et al., 2013). With no evolution of , our model would predict the break at a few keV while a reduction of by a factor of between and s would move the cooling break to keV (note that cooling at 1 d is dominated by synchrotron emission, not by IC scattering, and therefore ).
Detailed modeling of the nonthermal optical and X-ray emission from the forward and long-lived reverse shocks is an involved problem, which we defer to a future work. It should not, however, change the results of the present paper. We emphasize that both the optical flash and the entire GeV light curve are insensitive to the details of energy injection and the evolution of . The same is true for our estimate of the wind density parameter .
References
- Ackermann et al. (2014) Ackermann, M., Ajello, M., Asano, K., et al. 2014, Science, 343, 42
- Beloborodov (2002) Beloborodov, A. M. 2002, ApJ, 565, 808
- Beloborodov (2005) —. 2005, ApJ, 618, L13
- Beloborodov et al. (2013) Beloborodov, A. M., Hascoet, R., & Vurm, I. 2013, arXiv:1307.2663
- de Jager & Harding (1992) de Jager, O. C., & Harding, A. K. 1992, ApJ, 396, 161
- Fan et al. (2005) Fan, Y. Z., Zhang, B., & Wei, D. M. 2005, ApJ, 629, 334
- Fan et al. (2013) Fan, Y.-Z., Tam, P. H. T., Zhang, F.-W., et al. 2013, ApJ, 776, 95
- Genet et al. (2007) Genet, F., Daigne, F., & Mochkovitch, R. 2007, MNRAS, 381, 732
- Golenetskii et al. (2013) Golenetskii, S., Aptekar, R., Frederiks, D., et al. 2013, GRB Coordinates Network, 14487, 1
- Kouveliotou et al. (2013) Kouveliotou, C., Granot, J., Racusin, J. L., et al. 2013, ApJ, 779, L1
- Laskar et al. (2013) Laskar, T., Berger, E., Zauderer, B. A., et al. 2013, ApJ, 776, 119
- Lemoine et al. (2013) Lemoine, M., Li, Z., & Wang, X.-Y. 2013, MNRAS, 435, 3009
- Levan et al. (2013) Levan, A. J., Cenko, S. B., Perley, D. A., & Tanvir, N. R. 2013, GRB Coordinates Network, 14455, 1
- Liu et al. (2013) Liu, R.-Y., Wang, X.-Y., & Wu, X.-F. 2013, ApJ, 773, L20
- Panaitescu et al. (2013) Panaitescu, A., Vestrand, W. T., & Woźniak, P. 2013, MNRAS, 436, 3106
- Perley et al. (2014) Perley, D. A., Cenko, S. B., Corsi, A., et al. 2014, ApJ, 781, 37
- Piran & Nakar (2010) Piran, T., & Nakar, E. 2010, ApJ, 718, L63
- Sironi & Spitkovsky (2011) Sironi, L., & Spitkovsky, A. 2011, ApJ, 726, 75
- Tam et al. (2013) Tam, P.-H. T., Tang, Q.-W., Hou, S.-J., Liu, R.-Y., & Wang, X.-Y. 2013, ApJ, 771, L13
- Thompson & Madau (2000) Thompson, C., & Madau, P. 2000, ApJ, 538, 105
- Uhm & Beloborodov (2007) Uhm, Z. L., & Beloborodov, A. M. 2007, ApJ, 665, L93
- Vestrand et al. (2014) Vestrand, W. T., Wren, J. A., Panaitescu, A., et al. 2014, Science, 343, 38