Spectroscopy of the -transition of cesium by dressed-state resonance fluorescence from a single (In,Ga)As/GaAs quantum dot
Abstract
We use a laser-driven single (In,Ga)As quantum dot (QD) in the dressed state regime of resonance fluorescence ( K) to observe the four -transition lines of alkali atomic cesium () vapor at room temperature. We tune the frequency of the dressing continuous-wave laser in the vicinity of the bare QD resonance THz ( nm) at constant excitation power and thereby controllably tune the center and side channel frequencies of the probe light, i.e. the Mollow triplet. Resonances between individual QD Mollow triplet lines and the atomic hyperfine-split transitions are clearly identified in the absorption spectrum. Our results show that narrow-band (In,Ga)As QD resonance fluorescence (RF) is suitable to optically address individual transitions of the quadruplet without applying magnetic field or electric field tuning.
- PACS numbers
-
78.55.Cr, 78.67.Hc, 78.90.+t, 32.10.Fn, 32.80.Xx, 32.90.+a
pacs:
Valid PACS appear hereHybrid quantum systems, particularly combining the characteristic strengths of semiconductor quantum dots (QDs) and alkali atomic vapors, have recently attracted tremendous technological interest in view of sophisticated applications and future quantum logic devices in the field of quantum information processing. For example, very recent studies have demonstrated a first hybrid interface between a semiconductor ”artificial atom” (GaAs QD) and alkali atomic rubidium () vapor, where the 6.8 GHz (eV) split double resonance of served as a strongly dispersive medium for QD luminescence photons. In these studies, spectral QD- resonance between both systems was achieved by either electrical Akopian et al. (2010) or magnetic field tuning Akopian et al. (2011), enabling slow light propagation. In the latter case, photon storage by up to 15 times the temporal width of the wave packets could be achieved. Furthermore, an energy stabilization scheme based on the absorption of QD photons in the vapor in combination with an active feed-back loop for compensation of local carrier-induced spectral QD emission fluctuations was implemented by the same group Akopian et al. (2010, 2013). Though, all of these previous studies were based on conventional, non-resonant schemes of optical excitation into the barrier matrix, which results in inhomogeneously broadened QD emission lines (FWHM ), i.e. much larger than the corresponding atomic transition band widths and/or hyperfine structure splitting. The latter aspect represents a strongly limiting factor of the principally achievable spectral resolution on one hand, but especially will also strongly restrict or even hinder the desired level of high efficiency in hybrid functionality between semiconductor QDs and atoms in future applications on the other hand.
Here we demonstrate an alternative hybrid approach to achieve controlled interaction between a single semiconductor (In,Ga)As/GaAs QD and the transitions of alkali atomic cesium vapor () with high spectral resolution. In our scheme, we use ”dressed state” resonance fluorescence (RF) from a single (In,Ga)As QD under continuous-wave s-shell excitation Muller et al. (2007); Flagg et al. (2009); Ates et al. (2009) to prepare a quantum light source of narrow-band photon emission Ates et al. (2009); Ulrich et al. (2011) approaching the Fourier transform limit, provided by the individual components of the characteristic ”Mollow triplet” Mollow (1969). The use of such a ”dressed” quantum light source is of particular interest, as it allows to spectrally tune, i.e. control the photon emission frequencies over a wide range of typically a few GHz Vamivakas et al. (2009); Ulhaq et al. (2012, 2013). As will be shown in the following, the use of well-separated individual components of the Mollow triplet provides high spectral resolution of GHz. This is comparable to the Doppler width ( GHz) of the atomic transitions Siddons et al. (2008) and allows to resolve the hyperfine-split quadruplet of the transitions in absorption.
The investigated sample structure was grown by metal-organic vapor-phase epitaxy. It is based on a single layer of self-assembled (In,Ga)As/GaAs QDs emitting at 885-900 nm which are embedded in a planar waveguide structure, consisting of a GaAs -cavity between 29 (4) periods of -thick AlAs/GaAs layers as bottom (top) distributed Bragg reflectors (DBRs). The sample was kept at a temperature of K and excited by a narrow-band (FWHM kHz) tunable continuous-wave (cw) Ti:Sapphire laser. Filtering and detection of the QD emission was performed by a grating monochromator (1200 l/mm) equipped with a CCD camera, or alternatively, by a sensitive avalanche photo diode (APD). Combined with a 50:50 beam splitter in the detection path, two of such APDs served also as the ”start/stop” triggers to determine the emission statistics by -type photon correlation measurements (temporal resolution: ps). Efficient suppression of parasitic laser stray light was achieved by using an orthogonal geometry between lateral waveguide excitation into the cleaved sample side facet and detection perpendicular to the DBR surface, combined with spatial filtering (pin-hole) and polarization suppression within the detection path. To examine the dressed emission spectra of individual, resonantly excited QDs, high-resolution photoluminescence spectroscopy (HRPL) based on a scanning Fabry-Pérot interferometer with a resolution better than 240 MHz (eV) (FWHM) has been applied Ates et al. (2009); Ulrich et al. (2011); Ulhaq et al. (2012).
By micro-photoluminescence measurements, we have pre-selected appropriate QDs with excitonic ground state (s-shell) emission detuned by max. GHz (eV) relative to the cesium absorption resonance at THz/1.385928 eV (excluding hyper-fine structure). For absorption measurements by using narrow-band RF of a single dot, this restriction on the bare s-shell detuning from Cs- is of importance for the achievable resolution, as dressed QD RF is affected by spectral broadening (with the bare Rabi frequency ) with increasing resonant excitation power Ulrich et al. (2011); Roy and Hughes (2011). In addition, the QD dressed state emission line width depends on laser detuning itself and is explicitly ruled by the ratio of pure and radiative dephasing Ulhaq et al. (2013).
Figure 1(a) depicts the near-resonantly excited spectrum of a dot () which reveals excitonic emission at 335.12609 THz (1.38597 eV). While the laser is slightly blue-shifted from the s-shell by GHz (eV) and not in resonance with any of its excited electronic states, selective pumping of (accompanied by another nearby dot with similar s-shell resonance) is the result of incoherent excitation via carrier scattering with the bath of acoustic phonons in the barrier Weiler et al. (2012). All measurements described in the following have been based on .
To investigate the quality of single-photon emission from , a continuous-wave second-order auto-correlation has been performed on the spectrally filtered emission in (a). Figure 1(b) shows the Poisson-normalized trace of the data, together with an analytic fit for the ideal correlation (: effective emitter re-pump rate), convolved with the measured temporal response of our detection system, approximated by a Gaussian distribution of ps FWHM (red bold trace). Correcting for this temporal resolution , we find a value of , representing a small contribution of uncorrelated background of only (mainly by overlap with ).
The conditions of strictly resonant s-shell excitation of (W; ) are shown in Fig. 1(c), where the onset of resonance fluorescence reflects in an overall signal increase ( + laser) by factor with respect to near-resonant pumping in (a). In order to prove and investigate the onset of dressed state emission (unresolved in Fig. 1(c)), a series of power-dependent HRPL measurements have been performed. Figure 1(d) depicts an example, revealing the characteristic Mollow triplet Mollow (1969) consisting of the central Rayleigh peak () and two symmetric side peaks denoted as the fluorescence line () and three-photon line (), respectively. At zero laser-QD detuning (), the measured line splitting represents the bare Rabi frequency ( GHz in this case), whereas is replaced by an effective Rabi frequency under additional laser detuning (see discussion of Fig. 2 below). The inset graph of Fig. 1(d) summarizes the evolution of the sideband splitting and confirms the theoretically expected linear dependence on the square root of excitation power Mollow (1969). From a Lorentzian fit to the Mollow triplet in Fig. 1(d), we have derived very narrow line widths (FWHM) of GHz for the lines. Compared with the theoretical expectation of Fourier transform-limited inelastic emission bandwidth from each triplet sideband of GHz (for a typical radiative emitter lifetime of ps), the observed line widths are found to be slightly broadened as a result of pure and predominantly excitation-induced dephasing Ulhaq et al. (2013). In contrast, the central Rayleigh line reveals a very narrow (resolution-limited) line width of GHz. In principal, the pure line in the Mollow triplet dressed state regime should arise mainly from incoherently (but negligible contribution of coherently) scattered RF signal. Though, reflected in an increased peak area ratio between and the side peaks of (theory: 2) in the experiment, the Rayleigh peak appears to be superimposed by residual laser stray light as the shape-dominating contribution.
The applied scheme of spectral resonance tuning between the pre-characterized and the atomic vapor is depicted in Fig. 2, where the hyperfine structure of the relevant atomic transitions are shown in detail in (a), together with a sketch of the theoretical dependence of RF dressed state emission on laser detuning from the QD s-shell.
As is shown in Fig. 2(a), the absorption forms a quadruplet of dipole-allowed optical transitions, where the upper state reveals a HFS of GHz between and 4. In addition, the ground state HFS is GHz Steck (1998). At this point it is worth emphasizing first that both HFS values are of comparable magnitude to or even significantly larger than the observed emission line widths of the Mollow triplet components of (see Fig. 1(d)), as an important precondition for spectral line separation in absorption. Moreover, the calculated transmission profile of vapor at K () and 7.5 cm optical absorption length reveals Doppler-broadened line widths of GHz (with transition index ) which are similar or only somewhat smaller than the , , and probe light FWHM values discussed above.
Figure 2(b) sketches the principle of resonance tuning between RF from a single QD and the HFS of cesium. Whereas the quadruplet is used as a fixed reference frame of absorption channels, we apply instantaneous spectral tuning of all three Mollow triplet components by precise detuning of the laser frequency against the bare QD s-shell resonance. According to the theory of dressed state emission Vamivakas et al. (2009); Ulhaq et al. (2013), the frequencies of the triplet components and have significantly different dependence on the explicit value of laser-QD detuning . Whereas the center Rayleigh line () reveals a linear shift with the laser frequency, i.e. , the RF side bands obey non-linear tuning as and with the -dependent effective Rabi frequency and . Worth to emphasize, the optical transitions via the or decay channels of the Mollow triplet represent sources of background-free single-photons as was demonstrated in recent experiments Weiler et al. (2013).
Using the full RF Mollow triplet emission of as a source of narrow-band and tunable probe light, we have performed absorption series on atomic . A quartz cell with vapor (length: 7.5 cm; K) was inserted into the detection path between the monochromator ( GHz bandpass for the RF) and an avalanche photo-diode (APD), connected to a digital rate meter for monitoring the transmission signal in dependence on laser detuning . For the scan, the laser power was stabilized to W, equivalent to a constant bare Rabi frequency/splitting GHz at as the starting conditions. The cw Ti:Sapphire pump laser on was manually frequency-scanned in steps of GHz (resolution-limited by the monitoring wave meter), and the according averaged APD count rate was synchronously recorded. Figure 3(a) shows an excerpt of the full scan series taken between THz ( GHz) and THz ( GHz). As can be clearly seen from the transmission trace (black dots), we observe a series of distinct, narrow transmission minima in the detuning range of GHz to GHz, with contrast well above the signal noise level ( cts/s, equivalent to ) and slight residual oscillations of the laser power apparent far-off resonance.
In order to analyze and interpret the absorption spectrum Fig. 3(a) with respect to distinct resonances between QD RF and the quadruplet, the individual -dependent scalings of lines , , and have been calculated, as shown in Fig. 3(c). As stated earlier, the bare Rabi frequency GHz was fixed in the experiment, in accordance with the power series in Fig. 1(d) (inset). The frequencies () denoting the transitions between , , , and quantum states are represented as horizontal reference lines in the graph.
For a full theoretical analysis, we have calculated the expected transmission spectra of lines , , and through the atomic vapor cell ( K), depicted in Fig. 3(b). In this evaluation, starting with each single transmission profile (plotted as thin black (dashed/dotted) traces), the RF line widths and frequency scaling with have been taken into account, together with the Doppler broadening of the atomic transitions, resulting in Voigt-type profiles after convolution Siddons et al. (2008). The full transmission spectrum is shown as the bold-red trace in Fig. 3(b) and represents the superposition of all contributions, weighted by the respective relative strengths of the Mollow triplet components derived from our HRPL spectra (see Fig. 1(d)). The only free fit parameter to the experimental data is the average detector count rate of the transmitted light level (here: kcts/s) for detunings far-off resonance. With this we directly find very good agreement between theory and experiment, as can be seen from the superposition of the scaled theory spectrum (red-bold) and the experimental trace in (a).
As becomes obvious from a direct comparison between Figs. 3(a)-(c), we can identify the
absorption dips in (a) as resonances between the Rayleigh () line and the (orange) and (red) transitions, as well as
resonances of the lower energetic fluorescence line with (green) and (blue) of the atomic system, respectively. For the line though,
no such absorption resonances are expected within the experimental range of detuning . As a consequence of the selected fixed bare Rabi frequency
GHz being very close to the overall splitting of 9.1926 GHz between the upper and lower doublet
of and , all four resonance dips appear within a narrow window of . The resonance is well separated
by GHz and reveals distinct absorption contrast of . On the other hand, the remaining three resonances fall within a GHz
narrow band for the laser detuning. In accordance with theory (Fig. 3(b)), we can interpret the shape of this
absorption dip around GHz as a superposition, dominated by the signature. As a direct consequence of the relative weight of
spectral contributions by the strong line in comparison to the weaker line (ratio , see above discussion and Fig. 1(d))
in combination with Doppler broadening, the two nearby transmission minima of and provide only small contributions
to the overall signal and remain unresolved. Worth to note, this close coincidence of absorption minima is not general, but only a consequence of our explicit
experimental starting conditions of initial QD s-shell detuning from the quadruplet in combination with the bare Rabi splitting chosen here.
Full separation of QD-atom resonances should be feasible by setting the dressing laser power such that GHz, i.e. distinctly different
from the HFS of the ground state.
As an important remark already at this stage, we like to emphasize that single (In,Ga)As QD dressed-state resonance fluorescence (RF) is shown to provide highly flexible tuning capability in conjunction with very narrow ( GHz/eV range) emission line widths similar to the transitions of atomic vapor. Therefore, this combined system represents a promising platform for sophisticated hybrid functionality between semiconductor QDs and atoms in future applications. Among others one might anticipate, e.g. the filtering and/or stabilization of single photon emission Akopian et al. (2013) with respect to the frequency standard of -based atomic clocks, enhanced efficiency generation of slow light and storage/retrieval operations of single photons in quantum networks (repeaters) Reim et al. (2011); Choi et al. (2008), or the non-linear controlled interaction of single photons with Rydberg atomic vapor Peyronel et al. (2012); Li et al. (2013). In all the latter examples, the similarity between the QD emission profile and the absorption/transition spectra of the interacting thermal atomic vapor will play a crucial role, enabling to severely enhance any non-linear optical response of the atoms.
In conclusion, we have demonstrated controllable hybrid resonance tuning and coupling between a semiconductor quantum emitter and alkali-atomic gas. In our scheme, the precisely tunable dressed state resonance fluorescence (RF) from a single (In,Ga)As/GaAs quantum dot served as narrow band probe light to optically map the hyperfine structure of cesium () vapor around THz ( nm). Distinct resonances between individual QD Mollow triplet lines and the atomic transitions were clearly identified from absorption spectra. Our findings and interpretations could be fully verified by theoretical calculations on the expected transmission spectra under consideration of the given experimental conditions. These results show that narrow-band, optically dressed QD emission is a highly promising and versatile alternative to competing hybrid tuning schemes by application of magnetic or electric fields.
The authors gratefully acknowledge financial support by the Deutsche Forschungs-Gesellschaft (DFG) through project DFG MI 500/23-1. S. W. acknowledges funding by the Carl-Zeiss-Stiftung.
References
- Akopian et al. (2010) N. Akopian, U. Perinetti, L. Wang, A. Rastelli, O. G. Schmidt, and V. Zwiller, Appl. Phys. Lett. 97, 082103 (2010).
- Akopian et al. (2011) N. Akopian, L. Wang, A. Rastelli, O. G. Schmidt, and V. Zwiller, Nat. Phot. 5, 230 (2011).
- Akopian et al. (2013) N. Akopian, R. Trotta, E. Zallo, S. Kumar, P. Atkinson, A. Rastelli, O. G. Schmidt, and V. Zwiller, arXiv.org:[cond-mat]1302.2005v1 (2013).
- Muller et al. (2007) A. Muller, E. B. Flagg, P. Bianucci, X. Y. Wang, D. G. Deppe, W. Ma, J. Zhang, G. J. Salamo, M. Xiao, and C. K. Shih, Phys. Rev. Lett. 99, 187402 (2007).
- Flagg et al. (2009) E. B. Flagg, A. Muller, J. W. Robertson, S. Founta, D. G. Deppe, M. Xiao, W. Ma, G. J. Salamo, and C. K. Shih, Nat. Phys. 5, 203 (2009).
- Ates et al. (2009) S. Ates, S. M. Ulrich, S. Reitzenstein, A. Löffler, A. Forchel, and P. Michler, Phys. Rev. Lett. 103, 167402 (2009).
- Ulrich et al. (2011) S. M. Ulrich, S. Ates, S. Reitzenstein, A. Löffler, A. Forchel, and P. Michler, Phys. Rev. Lett. 106, 247402 (2011).
- Mollow (1969) B. R. Mollow, Phys. Rev. 188, 1969 (1969).
- Vamivakas et al. (2009) A. N. Vamivakas, Y. Zhao, C.-Y. Lu, and M. Atature, Nat. Phys. 5, 198 (2009).
- Ulhaq et al. (2012) A. Ulhaq, S. Weiler, S. M., Ulrich, R. Rossbach, M. Jetter, and P. Michler, Nat. Photon. 6, 238 (2012).
- Ulhaq et al. (2013) A. Ulhaq, S. Weiler, C. Roy, S. M. Ulrich, M. Jetter, S. Hughes, and P. Michler, Opt. Express 21, 4382 (2013).
- Siddons et al. (2008) P. Siddons, C. S. Adams, C. Ge, and I. G. Hughes, J. Phys. B 41, 155004 (2008).
- Roy and Hughes (2011) C. Roy and S. Hughes, Phys. Rev. Lett. 106, 247403 (2011).
- Weiler et al. (2012) S. Weiler, A. Ulhaq, S. M. Ulrich, D. Richter, M. Jetter, P. Michler, C. Roy, and S. Hughes, Phys. Rev. B 86, 241304(R) (2012).
- Steck (1998) D. A. Steck, http://steck.us/alkalidata (1998).
- Weiler et al. (2013) S. Weiler, D. Stojanovic, S. M. Ulrich, M. Jetter, and P. Michler, Phys. Rev. B 87, 241302(R) (2013).
- Reim et al. (2011) K. F. Reim, P. Michelberger, K. C. Lee, J. Nunn, N. K. Langford, and I. A. Walmsley, Phys. Rev. Lett. 107, 053603 (2011).
- Choi et al. (2008) K. S. Choi, H. Deng, J. Laurat, and H. J. Kimble, Nature 452, 67 (2008).
- Peyronel et al. (2012) T. Peyronel, O. Firstenberg, Q.-Y. Liang, S. Hofferberth, A. V. Gorshkov, T. Pohl, M. D. Lukin, and V. Vuletic, Nature 488, 57 (2012).
- Li et al. (2013) L. Li, Y. O. Dudin, and A. Kuzmich, Nature 498, 466 (2013).

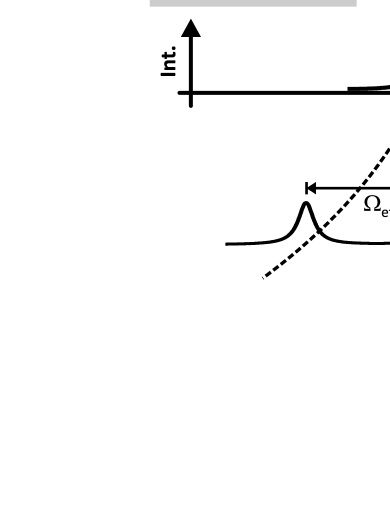
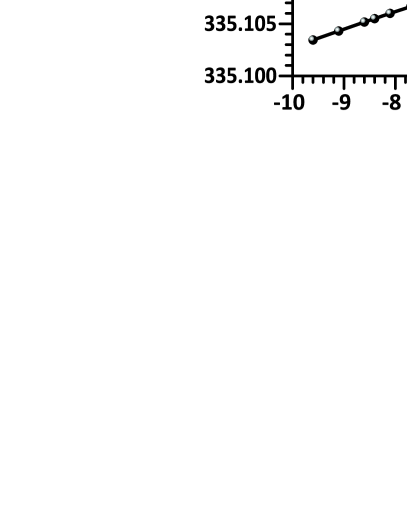
FIGURE 1 - Caption
Fig. 1 (a) Low-temperature ( K) emission spectra of two (In,Ga)As/GaAs quantum dots selectively excited under near-resonant optical pumping (Laser-QD1 detuning GHz; W). (b) Second-order correlation of the spectrally filtered QD1 excitonic emission line in (a). The bold (dotted) line corresponds to a fit to the raw data convoluted (deconvoluted) with the temporal detector response ( ps). The -corrected value of corresponds to only uncorrelated background by overlap with QD2. (c) Strictly resonant emission spectrum (; W) of QD1, revealing the onset of RF from a signal increase by factor in comparison with near-resonant excitation (a). (d) Corresponding high-resolution (HRPL) measurement of the dressed state RF of QD1, revealing the characteristic Mollow triplet and a bare Rabi splitting of GHz in this case. Inset: Linear dependence of the Rabi splitting with square root of power in accordance with theory Mollow (1969).
FIGURE 2 - Caption
Fig. 2 (a) Diagram of the cesium- transition between states and . A quadruplet of dipole-allowed transitions is the result of electron-nucleus spin hyperfine interaction, denoted by states with total atomic angular momenta and Steck (1998). The upper and lower states are split by GHz and GHz, respectively. (b) Detuning dependence of dressed state (Mollow triplet) emission on laser detuning between the excitation laser and the bare resonance (QD: s-shell transition) of the involved two-level emitter system. The position and Rabi splitting of lines and can be tuned by the value of to achieve resonance with the quadruplet, as discussed in the text. Inset: Level diagram of the dressed two-level emitter state at . Mollow (1969)
FIGURE 3 - Caption
Fig. 3 (a) Resonance scan between the RF (Mollow triplet) of , showing the photon signal after passing a quartz cell with vapor. In the experiment, the laser power was stabilized to W, equivalent to a bare Rabi frequency/splitting GHz. The clear dips in the absorption spectrum (black dots) can be identified as resonances between the and resonance fluorescence lines and the quadruplet. (b) Calculated Doppler-broadened absorption spectra of QD RF after passing a 7.5 cm long cell with atomic vapor at K. Normalized absorption spectra of the individual , , and bands are depicted in black, together with the full signal (bold red line), representing their weighted sum. (c) Analysis of the absorption resonances between and . Black symbols represent the spectral positions of the center () and side bands () of the RF (Mollow triplet) in dependence on laser detuning from the QD s-shell. Resonances between the QD RF ( and line) and the transitions , indicated by horizontal lines, can be clearly identified and assigned to corresponding dips in the transmission signal (Fig. 3(a)).