Age Determination of Fifteen Old to Intermediate-Age Small Magellanic Cloud Star Clusters
Abstract
We present CMDs in the and bands for fifteen star clusters in the Small Magellanic Cloud (SMC) based on data taken with the Very Large Telescope (VLT, Chile). We selected these clusters from our previous work (Parisi et al., 2009), wherein we derived cluster radial velocities and metallicities from Calcium II infrared triplet (CaT) spectra also taken with the VLT. We discovered that the ages of six of our clusters have been appreciably underestimated by previous studies, which used comparatively small telescopes, graphically illustrating the need for large apertures to obtain reliable ages of old and intermediate-age SMC star clusters. In particular, three of these clusters, L 4, L 6 and L 110, turn out to be amongst the oldest SMC clusters known, with ages of 7.9 1.1, 8.7 1.2 and 7.6 1.0 Gyr, respectively, helping to fill a possible “SMC cluster age gap” (Glatt et al., 2008a). Using the present ages and metallicities from (Parisi et al., 2009), we analyze the age distribution, age gradient and age metallicity relation (AMR) of a sample of SMC clusters measured homogeneously. There is a suggestion of bimodality in the age distribution but it does not show a constant slope for the first 4 Gyr (Piatti et al., 2011b), and we find no evidence for an age gradient. Due to the improved ages of our cluster sample, we find that our AMR is now better represented in the intermediate/old period than that we derived in Parisi et al. 2009, where we simply took ages available in the literature. Additionally, clusters younger than 4 Gyr now show better agreement with the bursting model of Pagel & Tautvaišienė (1998), but we confirm that this model is not a good representation of the AMR during the intermediate-age/old period. A more complicated model is needed to explain the SMC chemical evolution in that period.
1 Introduction
As it is widely known, the Small Magellanic Cloud (SMC) is the closest dwarf irregular galaxy to the Milky Way. For this reason, it is the ideal local analog to this type of primeval distant galaxies. Due to its low metallicity, the SMC constitutes an excellent field of study to explore the role played by metallicity in these galaxies. Star clusters of the Magellanic Clouds (MCs), particularly those of the SMC, are important to trace their chemical evolution and star formation history. Because of the richness and variety of the SMC star clusters, they are also important testbeds for theoretical models of stellar evolution at intermediate age and moderately low metallicity (e.g., Ferraro et al. 1995). Besides, the SMC clusters have been used as empirical templates to interpret the unresolved spectra and colors of distant galaxies (e.g., Beasley et al. 2002).
In order to study the early star formation history of a galaxy, it is crucial to characterize well the oldest
stellar populations. Globular Clusters (GCs) are ideal objects as tracers of the oldest
populations. In addition, although the GC system of a galaxy exhibits an age range, the oldest GCs clearly
belong to the oldest stellar systems that were formed in the early Universe and still survive. In those
galaxies where the age of the oldest field populations can be determined and compared with the age of the
Galactic GCs, it was found that, in general, the age difference between these two populations is not
significant within the errors and that the oldest GCs in different galaxies in the Local
Group are coeval. This indicates a common epoch of initial
star formation in the Milky Way (MW) and its companions in the Local Group. However, the SMC is the only Local Group
galaxy with a significant cluster population which seems not to share this common epoch of early cluster formation. In fact, although this
galaxy has a large number of young and intermediate-age clusters, it contains only one
cluster, NGC 121, confirmed to be older than 10 Gyr and considered the only known SMC GC, in the
sense that its age is comparable to those of the bulk of the Galactic GCs. This has given rise to a
series of speculations and controversies regarding the chemical evolution of the SMC and that of its companion,
the Large Magellanic Cloud (LMC). NGC 121, however, is clearly not as old as the oldest GCs of the LMC or
of the MW (Glatt et al., 2008a). In fact, NGC 121 has an estimated age of only 10.5 Gyr (Glatt et al., 2008a) instead of
12-12.5 Gyr found for the oldest clusters of the LMC and MW (e.g Dotter et al. 2010). Even though recent efforts have uncovered
at least one other SMC cluster approaching the age of NGC 121 (HW42, with an age of 9.3 Gyr - Piatti 2011a),
it is now clear that the SMC lacks the very oldest GCs that are found in other massive Local Group galaxies.
The reason for this is presently unknown.
The next oldest cluster in the SMC currently known after NGC 121 and HW 42, L 1, has an age of only 7.5 Gyr, based on deep HST
data (Glatt et al., 2008a).
Interestingly, the LMC has a well-known large cluster age gap between 3 and 12 Gyr within which only one cluster exists.
We also know, however, that the LMC contains 15 or 16 clusters older
than 10 Gyr (see, e.g., Dutra et al. 1999). The SMC indeed also has a potential cluster age gap (as suggested by Glatt et al. 2008a),
with only two clusters presently known between 7.5 and 13.7 Gyr, a gap covering almost half the age of the galaxy since the Big Bang.
At present, there is no clear explanation for the lack of clusters in the so-called age gap in the LMC.
Likewise, no scenario has been proposed for why there are no truly ancient clusters in the SMC or for its possible cluster
age gap, although this latter has not been well studied and the sample size is quite small. The fact that
NGC 121 is the only known relatively old SMC cluster means that all conclusions related to the early
evolution of this galaxy’s cluster system are based only on this single object. It is evident, in this context, that the
discovery of other old cluster in the SMC would have important implications related to its early
formation and chemical evolution, even clusters inhabiting the possible age gap between NGC 121 and L1.
Our group began investigating MC clusters using the powerful technique of CaII triplet spectroscopy (CaT)
with FORS2 on the VLT several years ago. As shown by Cole et al. (2004), CaT is a very efficient and accurate
metallicity indicator, with minimal age effects. Our first study (Grocholski et al., 2006) yielded excellent data for
28 LMC clusters. We found a very tight metallicity distribution for intermediate age clusters, no metallicity
gradient and confirmed that the clusters rotate with the disk. We followed this up with an initial study
of SMC clusters (Parisi et al., 2009) (hereafter Paper 1). We used FORS2 + VLT to obtain CaT spectra of more than
100 stars in 15 populous SMC clusters, spanning a wide range of ages and metallicities. We derived velocities
to a few km s-1 per star and mean cluster metallicity (from 7 high probability members) to 0.05 dex. We
examined the metallicity distribution, metallicity gradient, the age-metallicity relation (AMR) and kinematics
for the cluster sample. We found a suggestion of bimodality in the metallicity distribution, no
evidence for a gradient and a hint of rotation in our cluster sample, but the kinematics are dominated by
the velocity dispersion.
While the cluster metallicities constituted a reliable as well as homogeneous source of information, since
they were determined by applying the same well-proven technique, based on excellent data, cluster ages unfortunately are on a
heterogeneous and relatively poorly-determined scale. This results from the fact that we took the ages
available from the literature, which were derived by applying several different methods. These clusters
were selected mainly from CMDs in the Washington system published by Piatti et al. (2005, 2007b, 2007c) which
were based on data obtained on the Cerro Tololo Inter-American Observatory 0.9m telescope. Unfortunately, such data are not optimum
for deriving accurate ages for old and intermediate-age SMC clusters, given the small aperture and large
pixel scale. The lack of accuracy and homogeneity in the cluster ages limits our confidence in the study of the chemical evolution of the SMC, despite the excellent metallicities in hand.
In order to improve that situation, we decided to redetermine the ages of the 15 SMC clusters studied in
Paper I on a homogeneous scale. As explained there, before obtaining the CaT spectroscopic observations, the VLT staff obtained
images of the selected clusters in the and bands. These images, usually called pre-images,
were necessary to build the instrumental color-magnitude diagrams (CMDs) which allowed us to select the cluster red giants that were observed spectroscopically and to perform the requisite astrometry for these targets in order to ensure good slit positioning. Pre-images are not generally used for purposes other than this and thus are usually taken
with the minimum exposure times necessary, in this case to obtain reasonable photometry for the upper red
giant branch of each cluster. This unfortunately prohibits using them for something as demanding as determining accurate ages,
which requires good data to well below the MS. However, we realized that for a minimum additional cost in overhead
we could lengthen the preimages from the usual few second exposures to several minutes. Given the 8-m
aperture and generally good to excellent seeing available, this ensured that these data would go much deeper
than any available and would yield excellent material from which to derive ages. Thus, we put these preimages
to very good astrophysical use! However, in Paper 1 we only used the literature ages as time did not permit
us to obtain the required photometry. Also, Paranal Observatory does not provide standard star images in order to determine the
transformation of magnitudes and colors to the standard system. Thus, standardizing the preimages was
problematic and we waited until we could find an appropriate solution. We have subsequently solved
this either by obtaining independent calibration photometry and/or obtaining the ages differentially,
without the need for standardization. Hence, the time was ripe for investigating the cluster ages.
In this Paper, we report on the ages we derive for our cluster sample from the preimages and related results. In Section 2, we detail the procedure used to obtain the uncalibrated photometry. Section 3 describes our initial age determination procedure. Next we present the CMDs of each cluster and investigate two existing age calibrations. Here we find that several of our clusters are substantially older than indicated by previous studies and indeed turn out to be amongst the oldest star clusters known in the SMC. Section 5 describes the importance of such clusters for examining the early chemical and dynamical evolution of the SMC. In addition, we derive a new age calibration appropriate for old to intermediate-age SMC clusters, which yields ages for our oldest clusters supporting their extreme age. In order to further strengthen these results, we also present isochrone ages based on calibrated photometry we derive for the three most interesting old cluster candidates. In Section 6 we discuss our results, while Section 7 summarizes our findings.
2 Observations and Reductions
Paper I gives all relevant details about the cluster sample.
Basic information is given in Table 1, wherein we list the different
cluster designations followed by their right ascension and declination, and the metallicity and semi-major
axis reported in Paper I (see section 6.2 for details about calculation of ). The metallicities of
the 15 clusters presented in Paper I were derived from the equivalent widths of the CaT
lines, measured on the spectra of a number of cluster member red giants.
As we will see in the next section, there exist age calibrations that permit one to derive the age of a cluster
from the difference between the magnitude of the red clump (RC) and the main sequence turn-off (MSTO). Since
this involves a difference in magnitudes, we do not need calibrated photometry in order to
derive cluster ages through this procedure. When we programmed the spectroscopic observations, we deliberately
had in mind the need to rederive cluster ages in a homogeneous way, so we requested VLT staff to extend the
pre-image exposure times. We used exposure times of 200 sec and 100 sec in the and bands,
respectively, in addition to the usual short exposures required to not saturate the brightest giants.
FORS2 has two 2k 4k CCDs. Pixels were binned 22, providing a plate scale of 0.25” pixel-1. Target clusters were centered on the master CCD (upper) while the secondary CCD (lower) was used to observe field stars. The observations were performed with a typical seeing less than 1” The pre-images were corrected for bias and flat-field following the usual procedure using IRAF 111Image Reduction and Analysis Facility, distributed by the National Optical Astronomy Observatories, which is operated by the Association of Universities for Research in Astronomy, Inc., under contract with the National Science Foundation., while the Point Spread Function (PSF) photometry was performed using the DAOPHOT/ALLSTAR packages, independent from IRAF (Stetson, 1987).
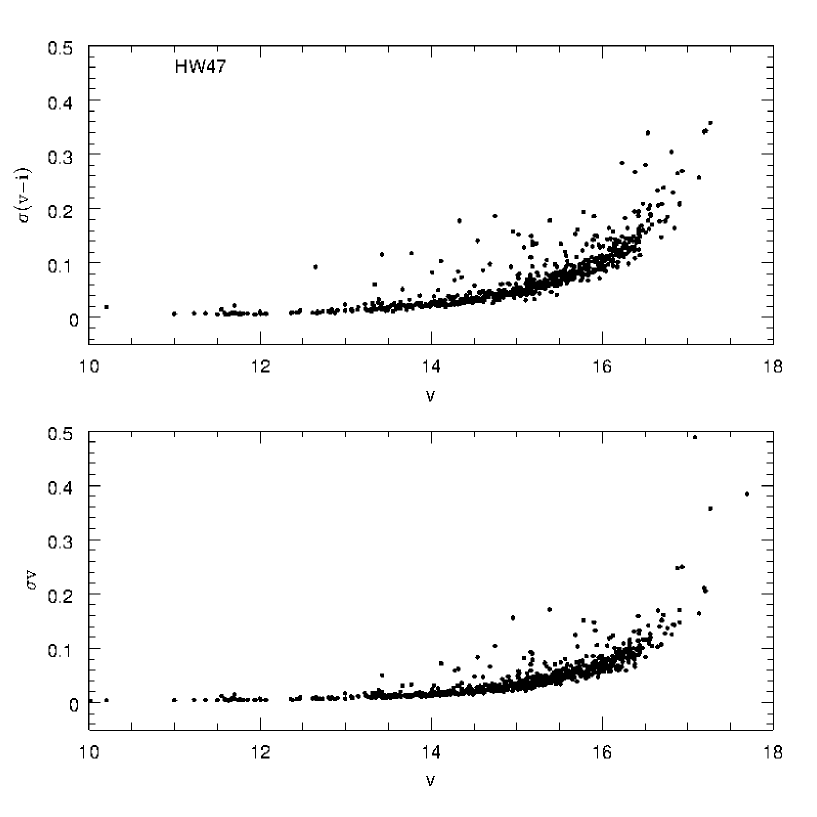
Figure 1 show, as example, the typical behavior of color and magnitude errors (upper and lower panels, respectively) as a function of instrumental magnitude. For magnitudes less than 15, most stars have 0.03 and 0.05, for the bulk of cluster. For some clusters, for example, L 17, L 27, L 111, thes error are larger probably due to the greater degree of crowding in the core regions.
3 Morphological Age Index
One way to derive cluster ages uses a morphological index that quantifies observational parameters
in the CMD that are sensitive to age (Anthony-Twarog & Twarog, 1985; Janes & Phelps, 1994; Rosenberg et al., 1999). A differential method, which utilizes differences between well-observed parameters to derive age, is particularly powerful as it is insensitive to
photometric problems, reddening, distance, etc. This technique allows the derivation of cluster ages avoiding
the well known difficulties present in the isochrone fitting method (Vandenberg et al., 1990; Sarajedini & Demarque, 1990; Salaris & Weiss, 1997) but requires
accurate calibration with fiducial clusters.
Phelps et al. (1994) and Janes & Phelps (1994, hereafter JP94), respectively, defined the parameter as the difference
between the visual magnitude of the MSTO () and that of the RC () (see Figure 1 of
Phelps et al. 1994). It is well known that the MSTO luminosity depends on the cluster age but that the RC luminosity
is almost age independent (Cannon, 1970), therefore turns out to be a good and reliable age indicator.
JP94 showed that there is a good correlation between the parameter and the
cluster age, in the sense that the younger a cluster, the smaller . Due to the heterogeneity of
the calibration material, JP94 emphasize the fact that their calibration can only be used to make a ranking of
clusters in terms of age and is not robust for absolute age determinations. For this reason, Carraro & Chiosi (1994) (hereafter CC94),
and, more recently, Salaris et al. (2004, hereafter S04) recalibrated the relation between age, metallicity and ,
based on homogeneous Galactic cluster samples.
Both calibrations include a metallicity dependence but, because this dependence is small, in cases where there is no information regarding the cluster metallicity, the metallicity-dependent term can be neglected (CC94). In spite of having information about the metallicity of our clusters, we decided to neglect the metallicity term because those clusters used for the derivation of all available calibrations (for example S04 and CC94) are galactic clusters that cover a metallicity range very different from the one covered by our cluster sample, which are considerably more metal-poor. Since we are trying to derive ages of SMC clusters which have a very different chemical evolution from those of our Galaxy, the metallicity issue is relevant. It is for this reason plus the fact that metallicity terms are small that we will not consider the metallicity effect on age. We note that the systematic effects from uncertainty in the basis of the CC94 (and S04) relations and the neglect of any metallicity compensation means that the uncertainties in the derived ages are likely larger in many cases than the errors stemming from determining . A revised age calibration explicitly taking into account the chemical composition of both SMC and LMC star clusters is needed.
One of the most reliable methods to derive cluster ages is isochrone fitting. However, the CMDs necessary to apply such a method must be based on calibrated photometry. As noted above, our PSF photometry was performed on VLT pre-images and we did not have the calibration images necessary to transform magnitudes and colors to the standard system. We then decided to use the method as our primary age determinant since it does not rely on calibrated photometry.
4 Cluster Ages
4.1 Color Magnitude Diagrams and Age Determination
Before starting the analysis of the observed cluster CMDs, it is necessary to minimize their contamination by
field stars. Such contamination clearly constitutes an important factor which limits precision in the
determination of all cluster parameters, particularly . To decrease the field star contamination in
the CMDs, we followed the procedure described by Piatti et al. (2005), that is, to build CMDs including stars located
in different concentric circular areas centered on the cluster center. Then we qualitatively analyzed the
ratio of field to cluster stars within each ring by studying their variation as a function of radius.
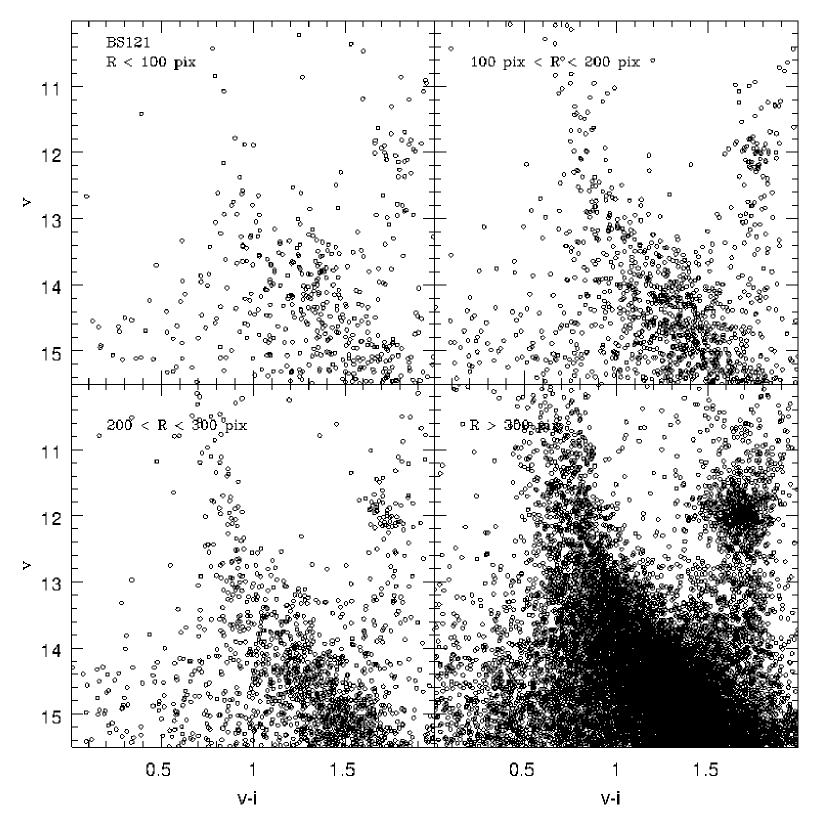
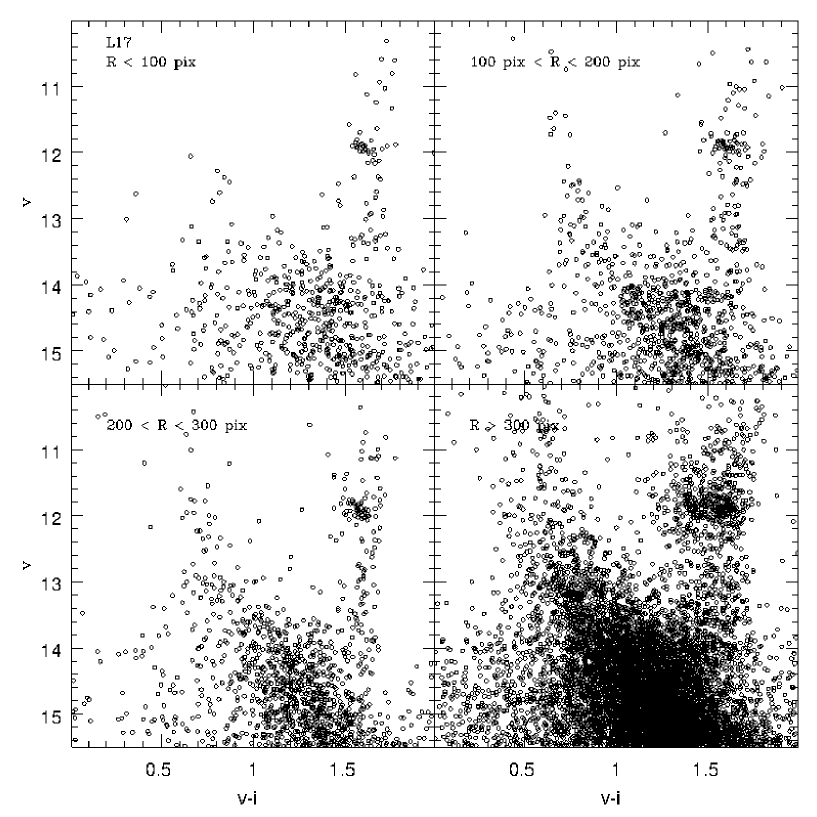
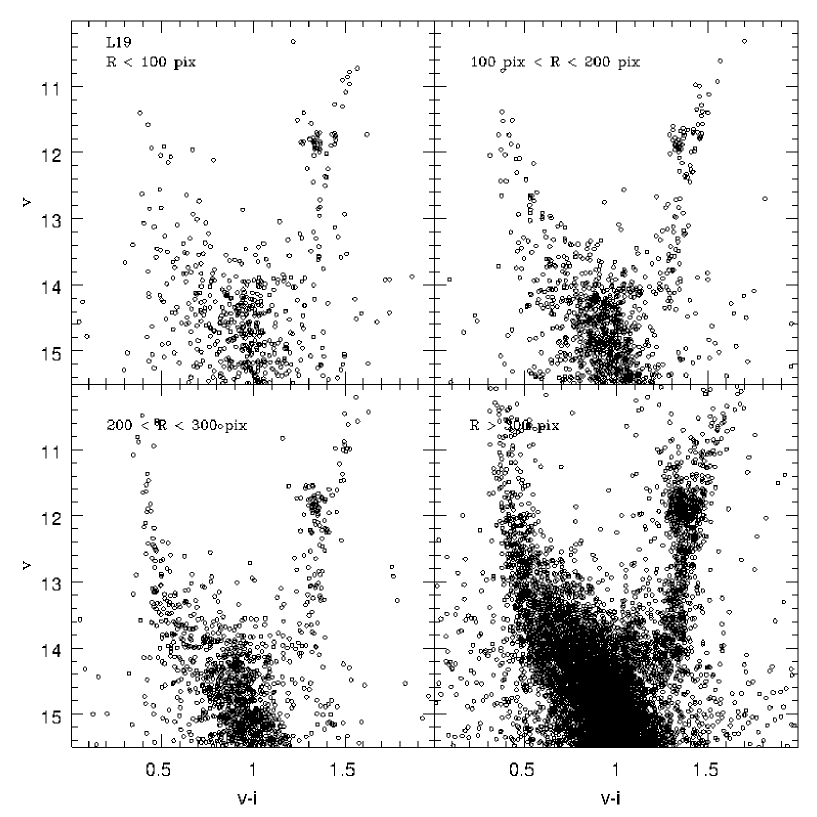
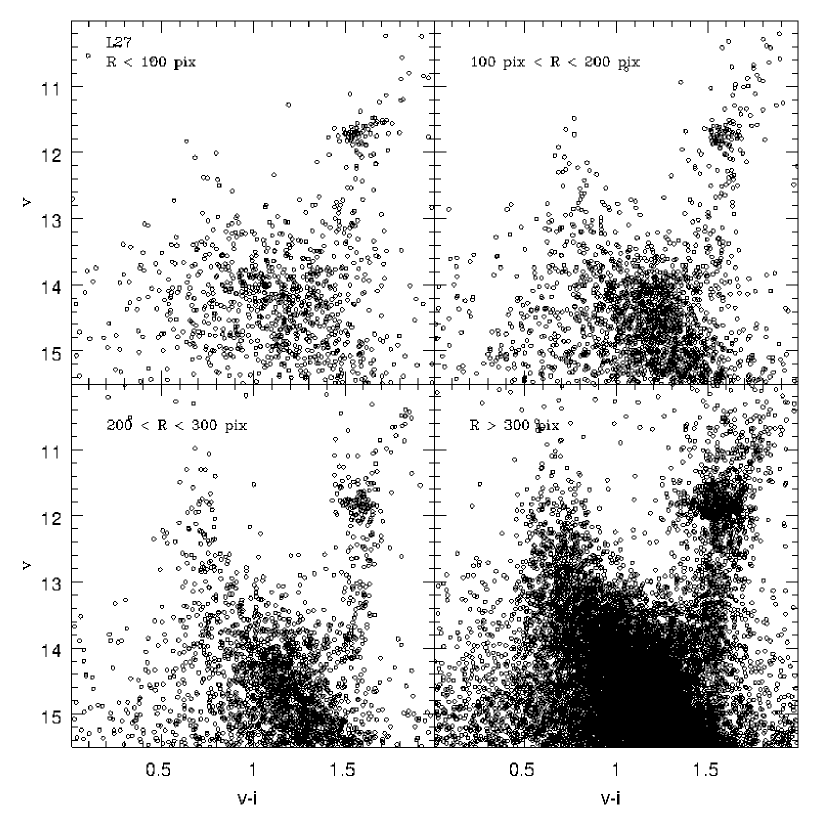
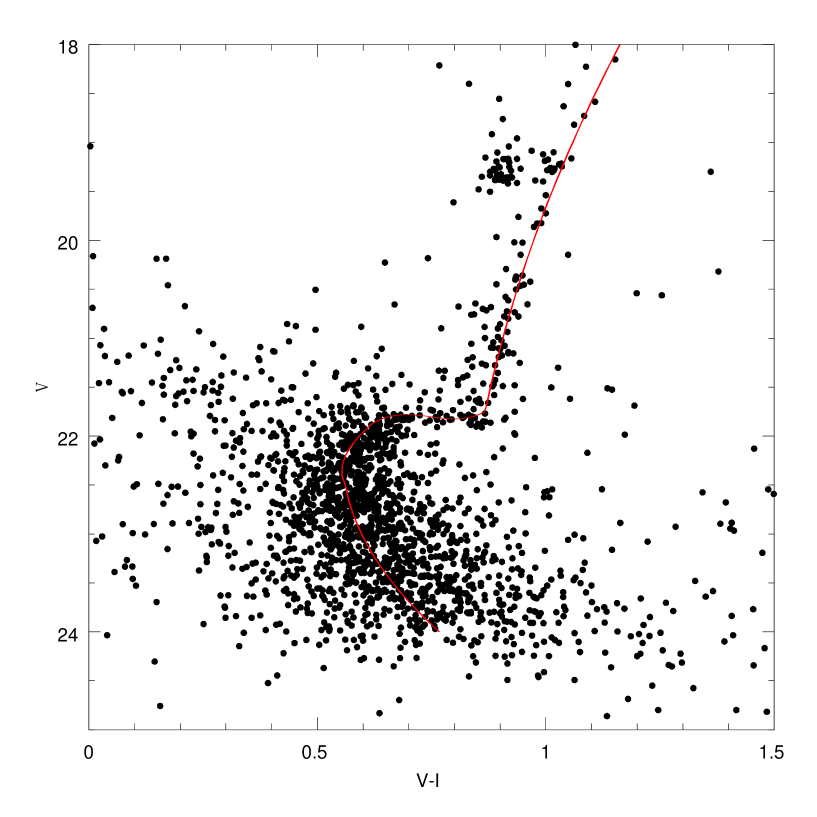
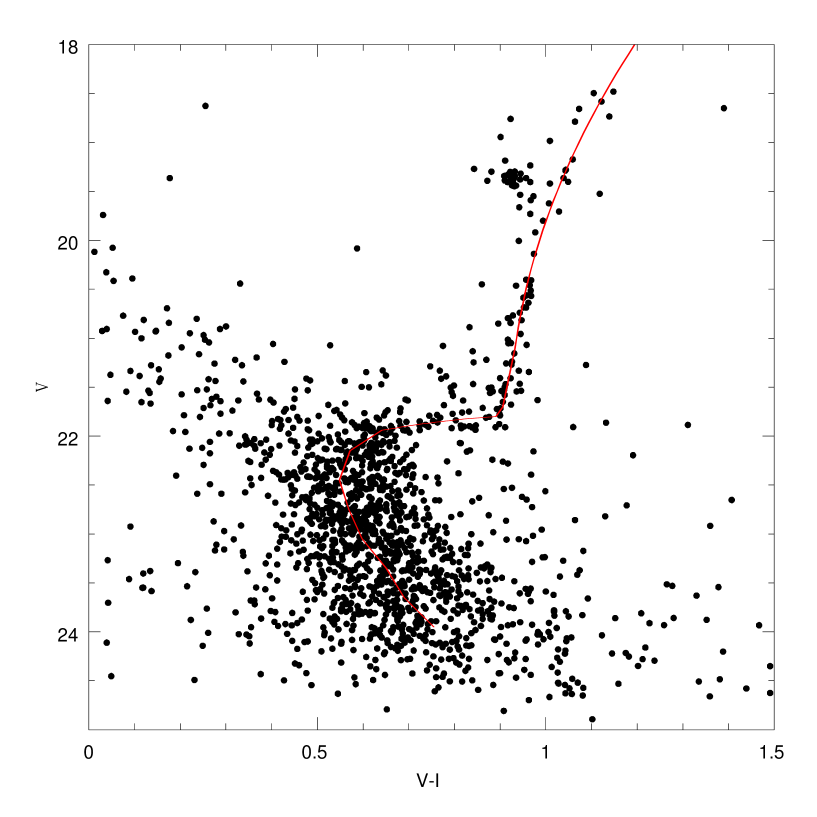
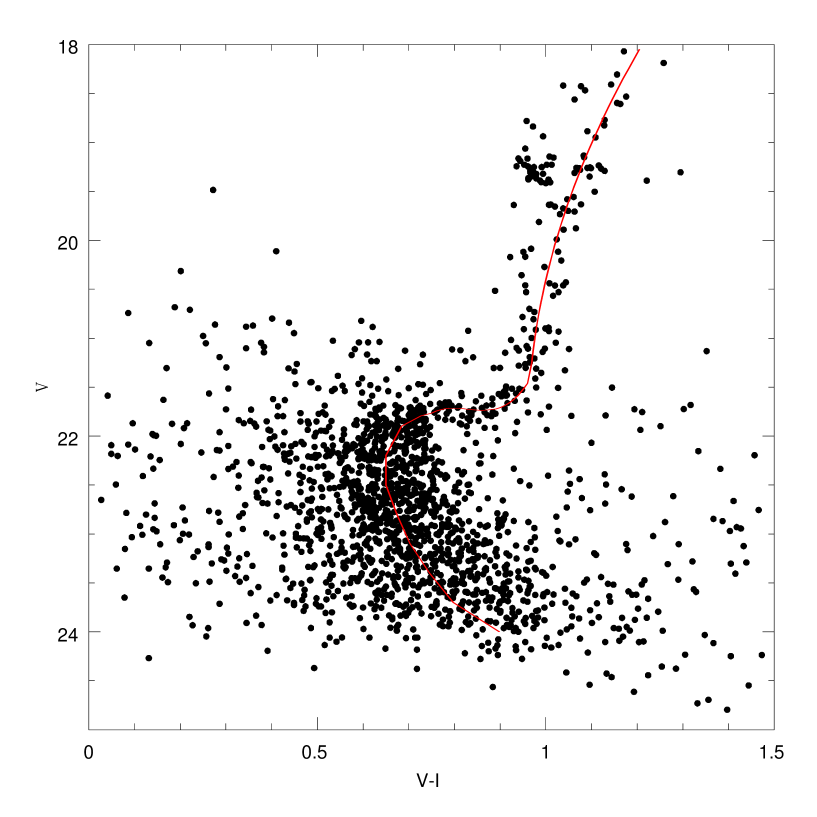
Figures 2 - 16 show the instrumental CMDs built from the DAOPHOT output,
corresponding to circular regions centered on each
cluster. For each cluster, we built four different CMDs which include stars belonging to four radial ranges
of 100 pixels width each. The first diagram (left top panels) includes all of the stars located within a circle of 100
pixel radius. The following two diagrams (right top and left bottom panels), include all of the stars between 100 and 200 pixels and from 200 to 300 pixels from the cluster center, respectively. The
fourth diagram (right bottom panels) includes all of the stars with distances from the cluster center greater than
300 pixels.
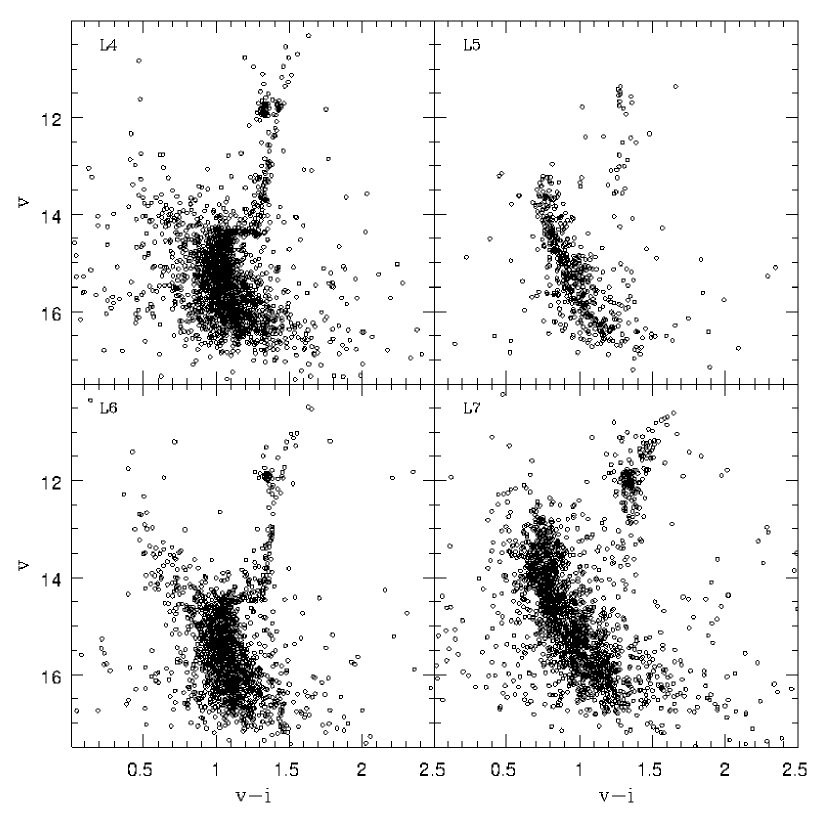
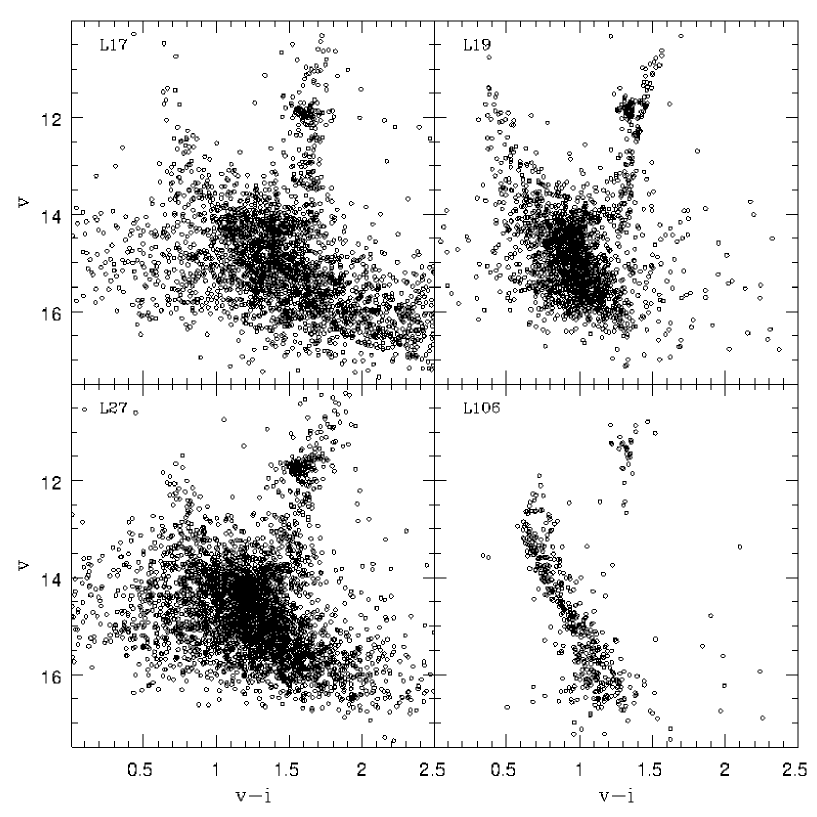
It can be clearly seen that the first diagram (inner interval) is, as expected, the least contaminated by field stars. The second annular CMD is still dominated by cluster stars, although the field contamination has increased considerably and is beginning to dominate the cluster stars in the third annular CMD. Therefore, to identify the CMD features of interest ( and ), we decided to use the CMDs constructed with stars belonging to the two innermost regions, that is, those located within 200 pixels from the center. Figures 17 - 20 show the CMDs of our cluster sample constructed using only the aforementioned annuli. These CMDs were used to determine and . As can be seen in Figures 17 - 20, all clusters exhibit reasonably well defined RCs and MSTOs, except clusters BS 121, L 17 and L 27, in which the dispersion near the MSTO is comparatively higher. In these cases, of course, the determination of the MSTO is clearly more uncertain. To quantify contamination by field stars in the CMD of Figures 17 - 20, we calculated the “contamination index”: since we know the field star surface density surrounding the cluster, i.e., in the r 300 pixel region, we calculated the number of field stars within a r = 200 pixel circle. The ratio between this number and the real number of (cluster + field) stars inside the said circle is a measure of the field star contamination. This parameter is listed in the last column of Table Age Determination of Fifteen Old to Intermediate-Age Small Magellanic Cloud Star Clusters. It is seen that contamination is very high for BS 121, strong for HW 47, L 17, L 19 and L 27, relatively small for HW 84, HW 86, L 5, L 6 and L 7, and very low for the remaining clusters. Clearly, ages derived for clusters in the two most contaminated categories will have larger errors.
Because the determination
of includes some degree of subjectivity, three members of our team determined this parameter
independently. Since these three independent determinations generally showed good agreement
(total spread of 0.1-0.5 in ),
we then adopted the value of corresponding to the average of such determinations. We estimated that
a typical error in the determination of both and
is 0.2 magnitudes, which implies an uncertainty of 0.3 magnitudes for . However, the range in such factors as contamination among our sample means
that this adopted typical error is likely too small in
some cases and too large in others.
Then we estimated ages using both the S04 and CC94 calibrations. From here on, we
will refer to the ages derived from the calibrations of S04 and CC94 and , respectively.
In Table Age Determination of Fifteen Old to Intermediate-Age Small Magellanic Cloud Star Clusters we list the cluster designations, , and , and their respective errors.
The errors were calculated using error propagation on the corresponding equation.
We also include in the table the age values reported in the literature, , as well as the reference of the
corresponding work where was determined. Finally, we list the “contamination index” described above.
As can be seen from Table Age Determination of Fifteen Old to Intermediate-Age Small Magellanic Cloud Star Clusters, is systematically larger than for all clusters. This tendency
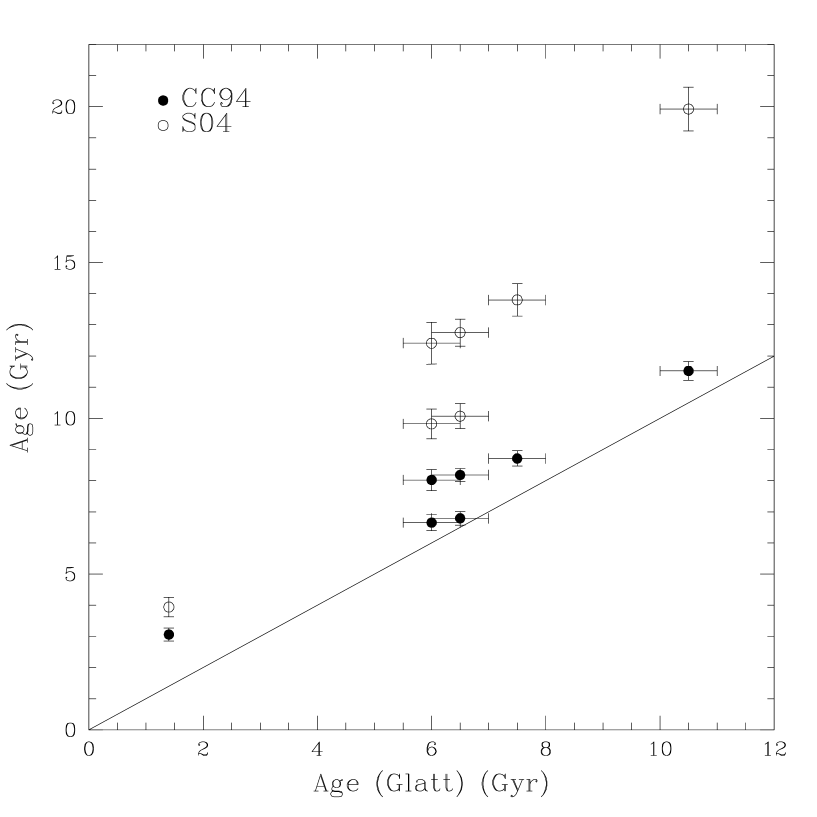
becomes considerably larger for older clusters. We compared ages derived for both the CC94 and S04 prescriptions
to those found by Glatt et al. (2008b) for seven old to intermediate-age SMC clusters using deep Hubble Space Telescope (HST)
data and state-of-the-art isochrones. These ages are
among the best constrained of any SMC clusters. This comparison is presented in Figure 21.
It is clear that CC94 ages are in much better agreement with those of Glatt et al. (2008b) for all clusters. Based on
these arguments, for the subsequent analysis, we use ages estimated from the CC94 calibration. However, it is important
to note that, although CC94 ages are in better agreement with Glatt’s ages than those of S04, there is a significant
offset even between ages from Glatt et al. (2008b) and those derived by
using the CC94 calibration, with the CC94 ages being larger by about a Gyr on average, independent of age. More precisely,
the difference between both values goes from 0.29 to 2.02 Gyr with a mean value of 1.22 (standard deviation of 0.61). This
difference may arise from the fact that,
as already mentioned, the SMC and Galactic clusters used by CC94 as calibrators have very different chemical
compositions. Again, a new age calibration for the chemical composition of the Magellanic Clouds is sorely needed.
4.2 Comparison with previous age determinations
To compare our age determinations with those from other authors, we show in Figure 22
as a function of the age values found in the current study (). The solid line represents the 1:1 relation
between both quantities. From this diagram, we classified the clusters in three different groups: the ages of
the 9 clusters identified with circles are in reasonably good agreement with those previously derived by other
authors, while the remaining clusters of the sample exhibit age values reported in the literature lower than
the ones derived in the present work, which is more remarkable for squares than for triangles. Triangles and
squares represent clusters where is moderately and considerably smaller than , respectively. To make
this discrimination, we adopted the following criteria: we first calculated the difference between
and and then we compared that difference with the mean error of (),
which is 0.54 Gyr. If the difference is lower than 3, we consider that the
value of is in agreement with the value of (circles). If the difference is larger than
3 but smaller than 6, we consider that the disagreement between
and is moderate (triangles). Finally, if the difference is larger than 6,
then both age determinations exhibit a considerable disagreement (squares). The mean
differences between and and their corresponding standard deviations are 0.7 0.4 , 2.7
0.5 and 5.1 0.4 Gyr for consistent clusters, moderately inconsistent clusters
and highly inconsistent clusters, respectively. Note that all of the inconsistent clusters have
ages derived here that are larger than those found in the literature. The two highly inconsistent clusters
are L 4 and L 6, which clearly stand out from the other clusters as being much older than previous indications. Much
more will be said about these intriguing clusters in the next Section.
The values of for clusters L 4, L 6, L 27 and L 19 were derived by Piatti et al. (2005) following a
procedure similar to ours. Using the (,) CMDs, they derived the parameter (difference
between the magnitude of the RC and the MSTO). This parameter allows one to determine the age of a cluster
from the calibration of Geisler et al. (1997). Note that this calibration included a wide range of metallicity,
covering that of the majority of our cluster sample here, so that metallicity effects should be minimal.
The most likely explanation for the differences found between and
is that the (,) CMDs of these clusters are not deep enough to reach the corresponding MSTO
with sufficient photometric accuracy to define this feature well. This fact may have led Piatti et al. (2005)
to underestimate , which, in turn, implies a significant underestimation of the value. The
photometric observations used in the current study were obtained with an 8 m telescope, while those of
Piatti et al. (2005) used an 0.9 m telescope. At a given magnitude, the photometric errors of the 8 m telescope
observations are roughly a factor of 3 less than those from the 0.9 m telescope. As such, not only do the 8 m
data extend to deeper magnitudes, but they do so with greater precision. Given the much smaller telescope,
the difficulties to reach the fainter
portions of the cluster CMDs are more problematic, especially for older clusters in which the MSTO occurs at
fainter magnitudes. It is then to be expected that the difference between and is more noticeable
for the older clusters of our sample (L 4 and L 6), as shown in Figure 22. In addition,
both the seeing as well as the telescope scale represent important factors that tend to decrease the
quality of Piatti et al.’s data compared to ours. In fact, the photometric data used by Piatti et al. (2005)
were obtained with a seeing of 1.5” and a scale of 0.4”px-1, while our pre-images were
obtained with a seeing typically smaller than 1” and a scale of 0.25”px-1.
Regarding cluster L 17, the value of was estimated by Rafelski & Zaritsky (2005) from the comparison of the cluster
integrated colors (, and ) with models of simple stellar populations. As these authors point
out, however, this work lacks accuracy in the calculated ages, mainly because the integrated colors have low
precision and the models used do not predict consistent colors for a given age. As Rafelski & Zaritsky (2005) emphasize,
their cluster ages should only be taken as a guide for future investigations. As for the cluster L 108, its
value was derived by Piatti et al. (2007c) by fitting theoretical isochrones to the Washington system CMD. Recently,
Piatti et al. (2011b) derived ages for L 108 of 1.10 0.25 and 1.60 0.30 Gyr, by fitting theoretical
isochrones and by using the parameter, respectively. According to the above described criteria, the
L 108 isochrone age is still moderately inconsistent but its morphological age is consistent with the value
derived in the present work. Again, the most likely reason for the discrepancy is that the Piatti et al. data
are from a much smaller telescope (in this case a 1.5m) with inferior seeing and scale.
5 Old SMC clusters
As mentioned in the previous section, two of our clusters (L 4 and L 6) appear much older than indicated by previous studies. Indeed, our data strongly suggest they are indeed very old SMC clusters, helping to fill the possible age gap between L 1 and NGC 121.
To corroborate the very old nature of L 4 and L 6, we decided to perform independent age determinations. In
addition, although the age of L 110 here derived is consistent with the value reported in the literature
(within the errors), our age of 7.6 Gyr based on the CC94 calibration officially makes L 110
slightly older than L1, providing another “age-gap” cluster and a third very interesting object to be more
thoroughly investigated, which we now do.
It is worth mentioning that Piatti (2012) recently found that the SMC cluster ESO 51-SC09 appears to be
quite old, with an age (7.0 Gyr) comparable to that of L 1. He calculated the parameter and used the
JP94 calibration to derive the cluster age. He then transformed into according
to equation (3) of Geisler et al. (1997) and calculated ESO 51-SC09’s age from equation (4) of the same work.
Finally, he fitted theoretical isochrones of Marigo et al. (2008). He derived age values of 8.3 1.6, 6.5 1.0 and 6.3 1.0 Gyr from
, and isochrone procedures, respectively. Piatti (2012) averaged these three values,
obtaining an age of 7.0 1.3 Gyr. However, as we have already mentioned, the JP94 calibration suffers
from serious problems that render it less reliable for deriving accurate ages, and in particular, it overestimates ages,
especially for older clusters. Using the value reported by
Piatti (2012) (2.5 0.15 Gyr) and the CC94 calibration, we derive an age of 5.2 0.4 Gyr for
ESO 51-SC09, which is 3 Gyr less than the value reported by Piatti (2012) using the JP94 calibration.
This value turns out to be in better agreement with those derived from and isochrone fitting. If we
calculate the average of the three values from , and isochrone fitting, using the CC94 instead
of the JP94 calibration, ESO 51-SC09 has an age of 6.0 1.4
Gyr. Though the average age derived in the present work is in agreement with the average age derived by
Piatti (2012), within the errors, ESO 51-SC09 is now younger than L 1, which supports the view that the JP94 calibration
needs to be used with caution.
NGC 361 is another cluster Piatti (2012) suggested may be older than L 1. He reports for this cluster
an age of 8.1 1.2 Gyr derived by Mighell et al. (1998), but this value corresponds to the age NGC 361
would have if we assumed that L 1 is 9 Gyr. This is obviously not the case because L 1 now has a very
well determined age of 7.5 Gyr (Glatt et al., 2008b). Mighell et al. (1998) actually derived an age of 6.8
0.5 Gyr for NGC 361 and then added 1.3 1.1 Gyr to this value in order to place its age on the scale of Olszewski et al. (1996).
This allows us to conclude that the only currently known cluster candidates to lie in the possible “SMC age gap” between
L 1 and NGC 121 are L 4, L 6, L 110 and HW 42.
Based on samples of catalogued and well studied SMC clusters, Piatti (2011a) performed a statistical study of clusters older than 2.5 Gyr. He found that only about seven old or relatively old clusters have yet to be found. We note, however, that a considerable number of clusters (used by Piatti 2011a) whose ages were determined from the MSTO were observed with small telescopes and relatively poor seeing conditions and pixel scale. Therefore, it is likely that the photometry of some clusters studied by these authors is not deep enough to delineate the MSTO clearly. In consequence, some of these clusters could have ages that are underestimated, as shown clearly in Figure 22, and which is the case for both L4 and L6.
5.1 The SMC calibration
In order to obtain an independent age determination for our new candidate old SMC clusters L 4, L 6 and L 110 based on the best observed SMC clusters,
we derived a new calibration (the “SMC calibration”), using the SMC clusters studied by Glatt et al. (2008a, b). These authors observed the clusters
Lindsay 1, Kron 3, NGC 339, NGC 416, Lindsay 38,
NGC 419 and NGC 121 with HST. From a photometric analysis of their vs.
CMDs, they reported the magnitude of the MSTO and of the RC (see Table 2 of
Glatt et al. 2008b). The difference between these values should be identical to V. They also derived cluster
ages using Padova (Girardi, 2008; Girardi et al., 2000), Teramo (Pietrinferni et al., 2004) and Dartmouth isochrones (Dotter et al., 2007). We adopted their
ages given by the Dartmouth isochrones because, as Glatt et al. (2008a, b) note, this set of isochrones are
the best approximation to the CMDs, except for NGC 419, in which Padova isochrones appear to be the best
representation of its CMD. The Dartmouth age for NGC 121 is 10.5 0.5 Gyr (Glatt et al., 2008a), while the Dartmouth ages
for the other six observed clusters are given in Table 6 of Glatt et al. (2008b). The age of NGC 419 is rather
uncertain because its CMD presents more than one MSTO. Hence, we decided not to include this cluster in the SMC
calibration.
We present in Figure 23 the behavior of age as a function of by using the Glatt et al. values. The best linear fit (solid line) is:
| (1) |
where age is given in Gyr. The fit has an rms of 0.83 Gyr. This “SMC calibration” is valid
only for clusters older than 6 Gyr with similar metallicities ([FeH] -1) and can be applied to
any V-band-like photometric system because it only involves a magnitude difference.
We then applied this calibration to our three old clusters, which indeed have
similar metallicities to the Glatt sample (Parisi et al., 2009). We found ages for L 110, L 4 and L 6 of 6.6, 6.9
and 7.7 Gyr, respectively. These values are in very good agreement with those found using the CC94 calibration
(albeit showing the same offset found in Figure 21)
but are more than 4 Gyr younger than the age calculated from the S04 calibration. This reaffirms our earlier suggestion that the S04 calibration
overestimates age, which prompted us to choose the CC94 calibration. The error in age due to the error in
is 2.42 Gyrs. We added in quadrature this value and the rms dispersion of the linear fit which renders
an age error of 2.5 Gyr. Note that, according to this procedure, all 3 clusters are about the same age as L 1 at
7.5 Gyr, with L 6 slightly older, and L 4 and L 110 a bit older than the next oldest clusters in the Glatt sample at 6.5 Gyr.
5.2 Fitting isochrones
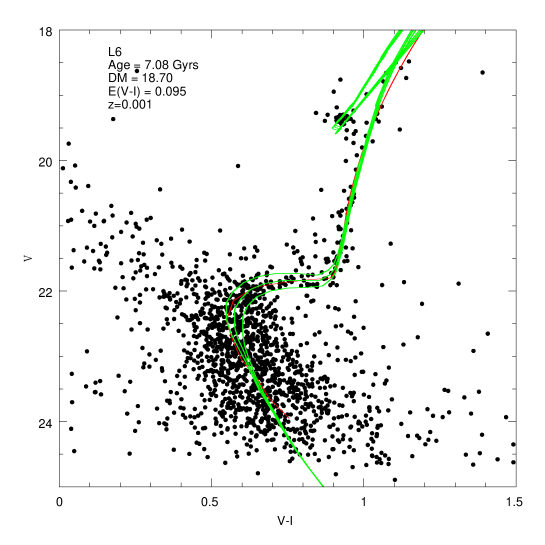
For another independent age determination for L 4, L 6 and L 110, we also fit isochrones to the observed CMDs.
As previously mentioned, our FORS2 photometry is uncalibrated because we do not have images of standard stars
taken during the same night as the pre-images. We emphasize, however, that the three clusters were observed with FORS2
during the same night of August 8, 2005, in a time interval shorter than one hour. The night, according to VLT logs, was declared
clear. For these reasons, the three clusters have been observed under the same, good sky conditions and at virtually the same airmass.
To tie the FORS2 images to the standard system, we obtained independent images of these three clusters, as well as images of standard stars to perform the corresponding calibration of our PSF photometry using local standard stars. From now on, for the sake of clarity, we will call CPIs the cluster pre-images and CCIs (cluster calibration images) the images obtained to calibrate the PSF photometry of the CPIs.
CCIs have been obtained at Cerro Tololo InterAmerican observatory (CTIO), using the Yale 1.0m telescope, operated by
the SMARTS consortium222http://http://www.astro.yale.edu/smarts during an observation run in Dec 8-10,
2010. The telescope works only in imaging mode with the Y4KCAM. This camera is equipped with an STA 40644064
CCD333http://www.astronomy.ohio-state.edu/Y4KCam/ detector.html with 15-m pixels, yielding a scale
of 0.289′′/pixel and a field-of-view (FOV) of at the Cassegrain focus of the CTIO 1-m telescope.
The CCD was operated without binning, at a
nominal gain of 1.44 e-/ADU, implying a readout noise of 7 e- per quadrant (this detector is read
by means of four different amplifiers).
The clusters were observed with exposures of 10, 60, and 600 secs in both the V and I filters. To tie photometry
to the standard system we observed the Landolt (1992) fields SA98 and T Phe 3 times during the night, spanning an
airmass range from 1.03 to 2.10 . SA98 is a particularly useful field since it contains more than 50 standard
stars with a wide range in color.
After basic pre-processing, instrumental magnitudes were extracted following the point-spread function (PSF) method (Stetson, 1987). Aperture corrections were then determined large aperture photometry of a suitable number (typically 10 to 20) of bright, isolated, stars in the field. These corrections were found to vary from 0.190 in V to 0.200 in I. The PSF photometry was then aperture-corrected, filter by filter. Finally, calibrated magnitudes were obtained using the calibration solution inferred from the Landolt standards.
Once the PSF photometry of the CCIs has been transformed into the standard system, we used it to calibrate the
CPIs to the standard system. We proceeded as follows: 1) Firstly, we selected
as local standard stars (LSSs) 97 stars from the CCIs standard system photometry. (2) Secondly, we identified
the LSSs in our CPI PSF photometry. (3) Next, we used the standard magnitudes and colors ( and ) of the
LSSs (obtained from the CCIs) and the instrumental magnitudes and colors ( and ) of the LSSs (obtained
from the CPIs) to find the transformation coefficients to the standard system. (4) Finally, we applied the
obtained transformation equations to all stars of the CPIs.
To select LSSs, we carefully chose bright stars as isolated as possible, avoiding stars located near the cluster centers, which fell within our color range of interest (from the upper RGB to MSTO). LSSs have magnitudes from 17.5 to 21 and colors from -0.5 to 1.2.
We used IRAF FITPARAM task to derive the transformation coefficients. Because we are using LSSs, we fixed
the airmass coefficients at zero. The equations and coefficients are:
| (2) |
| (3) |
Capital and lowercase letters represent standard and instrumental magnitudes, respectively. The rms are 0.036 and 0.096, for and fits, respectively. The standard magnitudes and colors of our observed stars were calculated inverting equations 2 and 3. The resulting CMDs for L 4, L 6 and L 110 are presented in Figures 24, 25 and 26, respectively.
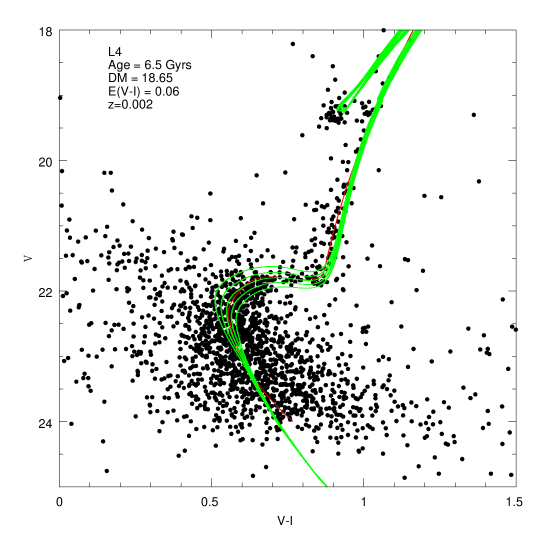
To derive ages from isochrone fits, we followed the prescriptions given by Glatt et al. (2008b). Using the vs CMDs, they fit three different models of isochrones: Padova, Teramo and Dartmouth. We also fit, when possible, these three sets of isochrones to our own CMDs. Isochrone fits depend of course on many parameters, in particular cluster metallicity, reddening and distance modulus. We adopted cluster metallicities from Paper I, which were very accurately determined. Therefore, we have only two free parameters to adjust, reddening and distance modulus. Although the SMC distance modulus is assumed to be 18.88 (Storm et al., 2004), small adjustments to this parameter could be made in order to take into account the depth of the SMC in the line of sight (LOS).
According to Crowl et al. (2001), the LOS depth of the SMC ranges between 6 and 12 kpc. Consequently, it would
seem reasonable to adopt 9 kpc as the mean value of the LOS depth. If we adopt 60 kpc for the mean SMC
heliocentric distance and consider that star clusters can be located in front or behind the SMC, then
their apparent distance moduli may present differences as large as 0.2 mag.
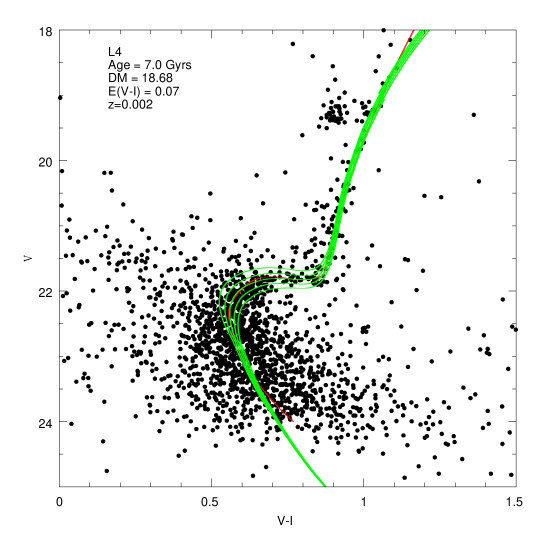
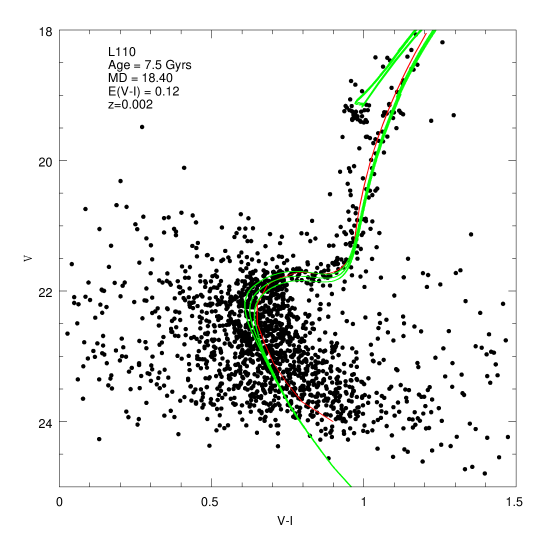
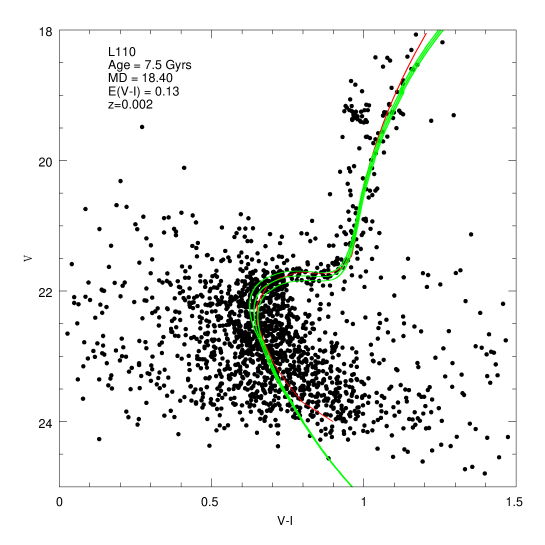
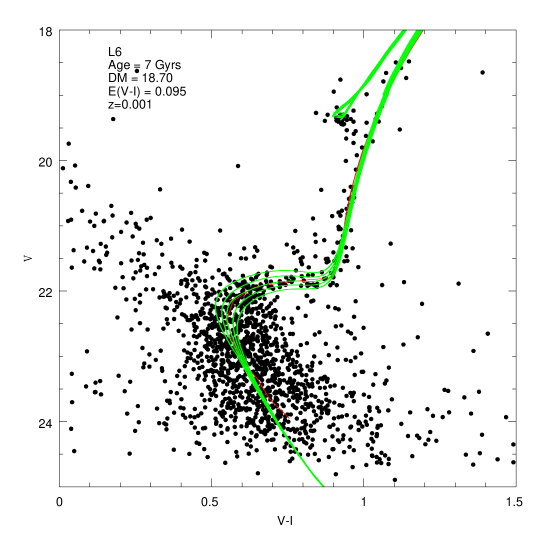
We fit Teramo and Dartmouth isochrones (upper and lower panels of Figures 27 and 28, respectively) to the CMD of L 4 and L 110, and Teramo and Padova isochrones (upper and lower panels of Figure 29, respectively) to the CMD of L 6. We adopted a chemical composition ([Fe/H]=-1.02, Bertelli et al. 1994) for L 4 and L 110, and ([Fe/H]=-1.33, Bertelli et al. 1994) for L 6, which are the closest to the observed values of these clusters.
In all cases, we adopted a set of isochrones and superimposed them on the CMDs, once they were shifted by the corresponding E(V-I) colour excess and by the apparent distance modulus (DM). Then we adopted, as the cluster age, the one corresponding to the isochrone which best reproduced the cluster fiducial ridgeline. The fitting parameters are shown on the corresponding plot (Figures 27 and 29).
We had to face the following issue when we fitted isochrones to L 4 and L 6. The CMD of L 4 is shifted to the blue by 0.035 magnitudes (in ) with respect to the CMD of L 6, as judged by their RCs and RGBs. These two clusters have virtually the same reddening (Piatti et al., 2005), and indeed lie very close together in the outer parts of the SMC, but L 4 is more metal-rich than L 6. Therefore, the L 4 fiducial should be redder than that of L 6. For this reason, we had to adopt E(B-V) values larger than the ones reported in the literature (0.03 and 0.04 for L 4 and L 6, respectively, Piatti et al. 2005). This problem is likely due to the fact that L 4 and L 6 were observed on the same CTIO 1m frame, which was centered on L 6, leaving L 4 located near the image border. It is well known that objects observed in the border of such images may have a difference of up 0.05 magnitudes with respect to the centered objects.
From this procedure we find than the two clusters have ages of 7 Gyrs. While our photometric calibration is not precise enough to consider these ages robustly determined, it is important to note that they constitute an independent confirmation of the truely old nature of these clusters.
6 Age Analysis
In the previous section, it was demonstrated that the combination of the V parameter and CC94 calibration is a very good indicator of cluster age. For the subsequent analysis, we then adopted values of cluster ages derived in the present work using the CC94 calibration and metallicities from Paper I. As a consequence, the ages and metallicities of our sample of 15 SMC clusters were determined homogeneously and on the same scale. We believe our errors in both age and metallicity to be significantly smaller than in other works (e.g. Piatti 2011a; Piatti et al. 2011b; Piatti 2011c), as well as being homogeneously derived. However, even though our sample is homogeneous, it is limited to only 15 clusters. In order to study global effects, a larger sample is necessary. We now proceed to enlarge the cluster sample as carefully as possible.
6.1 Age Distribution
The age distribution (AD) of a sample of star clusters is a very valuable tool that allows us to understand cluster formation processes. Until
about a decade ago, it was widely believed that the SMC formed its clusters continuously over the last 12 Gyr
(Olszewski et al. 1996; van den Bergh 1991; Da Costa & Hatzidimitriou 1998-hereafter DH98), while the AD of star clusters in the LMC was known to have the infamous age gap (Da Costa, 1991). Rich et al. (2000) presented the first compelling evidence for bursts in cluster formation in SMC clusters. They reported HST photometry and MSTO ages for seven SMC
clusters older than 1 Gyr and they analyzed the AD of their cluster sample together with the sample previously
studied by DH98. They found two peaks in the AD at 2 0.5 and 8 2 Gyr. More recently, however,
Glatt et al. (2008b), using superior HST photometry for 7 clusters found no evidence of two cluster formation bursts, although their AD reveals a
slight enrichment in the cluster formation process at 6 Gyr. Although Glatt et al. (2008b)
ages were accurately determined, their sample is statistically very small. On the other hand, Piatti et al. (2011b)
obtained the most complete SMC AD using 43 star clusters with age estimates (see their Table
19) derived in their paper and supplemented by ages taken from the literature. The AD derived by these authors presents bimodality, showing two peaks of
enhanced star formation processes at 2 and 5 Gyr. Their AD also shows that the slope in the cluster formation/destruction rate is constant from 12 to
8 Gyr. According to these authors, this may reflect the possibility that in this period there existed a constant cluster formation rate, in agreement with the simple closed box model presented by DH98.
The crosshatched histogram in Figure 30 shows the AD obtained for the present fifteen cluster sample. Unfortunately, our sample is too small to draw definitive conclusions. For this reason, we decided to add other previously studied clusters to our sample, trying to maintain age homogeneity as far as possible. Piatti et al. systematically studied SMC star clusters from Washington photometry. In a series of papers they calculated the parameter as the difference between the magnitude of the RC and the MSTO. We selected 27 clusters from Piatti et al. (2001, 2007b) and Piatti (2011a, c). We transformed their values into by inverting equation (3) of Geisler et al. (1997). We also included the age value of ESO 51-SC09 (5.2 0.4 Gyr) derived in section 5 by using the CC94 calibration. Next, we calculated cluster ages using the CC94 calibration to place Piatti et al.’s cluster ages on the same scale as ours. Piatti et al. (2011b) derived the age of 14 SMC clusters (8 of them not included in our sample) from the parameter. These authors did not include the values but we estimated them from the published CMDs. We did not include the cluster IC 1708 because its CMD does not have an evident clump. In Table Age Determination of Fifteen Old to Intermediate-Age Small Magellanic Cloud Star Clusters, we list cluster designation, with its error, the reference of the work from where was taken, and the corresponding age with their respective errors.
Therefore, our full sample now consists of a total of 50 clusters with ages on
the same scale, comparable to the sample used by Piatti et al. (2011b).
In relation to Piatti et al. (2011b) work, it is worth pointing out that they use an age scale where L 1 is 10
Gyr (Mighell et al., 1998), although the best age determination for L 1 is 7.5 Gyr (Glatt et al., 2008b). Similarly, Piatti gives an age for NGC 121 of 12 Gyr
and K3 of 9 Gyr, while the corresponding Glatt et al values are 10.5 and 6.5, respectively.
Thus, it appears that the Piatti et al. scale is indeed somewhat different from the one adopted here, especially for the oldest clusters.
The unhatched histogram of Figure 30 represents the AD of the extended sample. Figure 30 reproduces the two peaks found in Piatti et al. (2011b) at 2 and 5 Gyr. They suggest the two peaks correspond to bursting cluster formation episodes. Very recently, Weisz et al. (2013) have derived large scale field star formation histories of both Clouds from deep HST imaging of a number of regions. They find two notable peaks in the SMC, at 4.5 and 9 Gyr ago, which are not present in the LMC. They also find sharp increases in the star formation history of both galaxies starting about 3.5 Gyr ago. One of course expects that the field and cluster formation histories should be very similar. We do find good correspondence with the strong increase starting 3.5 Gyr ago, and reasonable agreement with the peak of about 4.5 -5 Gyr ago. The field stars also appear to show a peak around 2 Gyr ago, as we find in the clusters. However, the cluster sample is too small to discern any structure earlier than 6.5 Gyr ago, in particular to corroborate or not the field star peak at 9 Gyr.
Our sample does not appear to
show a constant slope for the first 4 Gyr of the SMC, as posed by Piatti et al. (2011b).
In any case, the numbers are very small and statistics therefore very uncertain.
Note that the ages of L 4 and L 6 included in the sample
of Piatti et al. (2011b) are the ones derived by Piatti et al. (2005), which have been considerably underestimated, as we have
shown in section 4. Consequently, the conclusions reached by Piatti et al. (2011b)
could substantially change if these authors used our ages for L4 and L6, which should be much more accurate. Similarly, some of the cluster ages included in our extended
sample could also have been underestimated because the clusters were observed with small telescopes (especially
those in Piatti et al. 2001 and Piatti et al. 2007b). In these cases, the real MSTO magnitude may not have been clearly
detected. Although our sample of 15 star clusters is not large enough to either confirm or deny the existence
of the first burst of star formation at 5 Gyr and/or the constant slope for the first
4 Gyr, the photometry of our 15 clusters is deep enough to measure the MSTO with small errors. This fact, together
with the homogeneous nature of our 15 cluster ages, supports the existence of the second peak of star formation
at 2 Gyr suggested by Piatti et al. (2011b) (crosshatched AD). It is clearly advisable to continue studying clusters in a homogeneous way, applying the same techniques.
With this in mind, we have obtained and images and spectra in the
CaT region of an additional sample of 15 clusters. Currently, we are in the process of deriving ages and
metallicities following the same procedures used here and in Paper I. We are confident that such a homogeneous
sample of 30 clusters will enable us to better understand the processes of cluster formation
in the SMC.
6.2 Age Gradient
To take into account the orientation of the SMC and the probable projection effects necessary to analyze the possible existence of an SMC gradient, we adopted the elliptic system defined in Piatti et al. (2007a). In this system, the semimajor axis is used instead of the cluster true galactocentric distance (see Piatti et al. 2007a and P09 for details on the calculation of ).
In Figure 31 we show how cluster ages vary as a function of . Filled circles represent our 15 clusters
which show no evidence of an age gradient. We also included in Figure 31 the additional 35 clusters studied by
Piatti et al. (see the above description and figure caption for details). The extended sample also supports the nonexistence
of an age gradient as has been previously suggested by other authors (see, e.g., Piatti 2011c; Glatt et al. 2008b). Note that in Paper I we find no metallicity gradient, either.
It is necessary to note, however, that the spatial distribution of age and metallicity are built based on the current positions of the clusters.
To find out where they were born it would be necessary to know their orbits, which at present is not possible.
The Weisz et al. (2013) study of the large scale field star formation history of the Clouds finds that after the onset
of the recent strong increase in star formation some 3.5 Gyr ago in the SMC, subsequent star formation
was concentrated to the central regions of the galaxy and little or no field star formation occurred outside
this. Their sampling is small, however, as they only have fields at a galactocentric radius of about 0.5 kpc
or 2.3 kpc, which corresponds to a 1 and 4.6∘. However, we clearly have a number of
young clusters located beyond this radius in our diagram. Either the Weisz et al. sample is too small and
does not reveal real variations in the galaxy or the field and cluster star formation is uncoupled, which
is less likely. We believe the clusters are telling us more of the true star formation history and that recent
star formation is not solely concentrated to the central regions.
7 Age Metallicity Relation
The relationship between the age of a stellar population and overall metallicity, and its time variation,
is one of the best tools to study the chemical evolutionary history of a galaxy. Both the ages and metallicities
of the tracer population need to be as accurately determined as possible. It is of vital importance for those
parameters not only to be on the same scale but also to be determined in a homogeneous way.
Several investigations have aimed at deriving the SMC AMR using various stellar populations, such as star clusters, field giants and planetary nebulae (see, e.g., Stryker et al. 1985; Da Costa 1991; Olszewski et al. 1996).
After these first attempts, DH98 obtained what can be considered the first well constrained SMC AMR.
DH98 used a sample of 6 clusters studied by them and others. Their metallicities were determined
from CaT spectra and their ages from deep, ground-based CMDs. According to DH98, the metallicity variation with age in the SMC
is consistent with a simple closed box model. However, subsequent analyses seemed to be more
in agreement with only a small increase
in the intermediate period followed by a faster evolution more recently.
A series of papers summarized in Piatti et al. (2007c), wherein cluster ages and abundances were derived from Washington
photometry, showed an excellent agreement with the bursting model of Pagel & Tautvaišienė (1998) (hereafter PT98), even in the intermediate period ranging from 5
to 10 Gyr. The PT98 model assumes an early burst, followed by no star formation from Gyr ago,
and then an ensuing burst of recent star formation, leading to a significantly enhanced subsequent enrichment.
However, in Paper I, we showed that there is poor agreement between our CaT observations and the PT98 model for the
intermediate period.
The recent investigation of Piatti (2011a) confirms our point of view that, although the PT98 model is a very
good representation of the observations for ages smaller than 4 Gyr, this model fails to explain the AMR for
larger ages. In fact, the 9 SMC clusters studied by Piatti (2011a) are older than 4 Gyr but cover a considerable
metallicity range. More precisely, 8 of their 9 clusters are included within a very small age range ( 2.2 Gyr) but their metallicities vary from 0.7 to 1.3 dex, five of which have metallicity values
considerably larger than those predicted by PT98.
In Paper I we also found that some of our clusters have metallicities in good agreement with the models of Carrera (2005) and Carrera et al. (2008), which do not assume any bursts but use instead both infall and outflow. Carrera et al. used the CaT to derive metallicities on the Carretta & Gratton (1997) scale for a large number of field giants in regions spread across the SMC. In Paper I we concluded that the model of PT98 is a good representation of the AMR for ages 3-4 Gyr but the ideal model for larger ages would predict metallicities between PT98 and the Carrera (2005) and Carrera et al. (2008) models.
As we have already mentioned, in Paper I we analized the AMR of the SMC using our sample of 15 SMC clusters as
tracers. The metallicities of these clusters were accurately determined following the CaT technique so that they
are on a homogeneous scale. Unfortunately, at the time of Paper I, we could not determine
ages for these objects from our own data, instead simply taking them from the literature. So the AMR of Paper I is
inhomogeneous regarding ages. The CaT method is among the most accurate procedures for the determination of
cluster metallicities (Cole et al., 2004; Grocholski et al., 2006), and the parameter is an excellent age indicator (e.g.
Carraro & Chiosi 1994) so the AMR derived in the current work can be considered a good indicator of the chemical
evolution of the SMC and a significant improvement over Paper I given the now homogeneous ages.
In Figure 32 we present our new AMR. Solid circles represent our 15 cluster sample considering ages derived in the present work and metallicities from Paper I.
As in Paper I, we have also included in Figure 32 six clusters having metallicities derived by other authors on the same scale than ours, namely three from DH98 (open circles) and other three from Glatt et al. (2008b), having their metallicities been derived by CaT method. We only included clusters which we do not have in common with other studies, using in these cases the metallicity values on the Carretta & Gratton (1997) scale to match ours. We have also included NGC 330, whose metallicity (-0.94 ± 0.2) was derived by Gonzalez & Wallerstein (1999) from high resolution spectroscopy. Squares in Figure 32 represent the mean CaT metallicities calculated by Carrera et al. (2008) in different age bins for their sample of field stars. Different lines represent: (i) the model of closed box continuous star formation computed by DH98 (short-dashed line). (ii) the bursting model of PT98 (solid line), (iii) the best-fit model derived by Carrera (2005), long-dashed line), and (iv) the AMR obtained by Harris & Zaritsky (2004).
If we first consider only our 15 cluster sample, the main differences that we can find between the present AMR and the one derived in Paper I, are:
1) ages of clusters younger than 4 Gyrs are now in better agreement with the model of PT98, 2) we have now 6 star clusters with ages larger than 4 Gyr
so we have improved the representation of the intermediate/old SMC period. Four of these 6 clusters follow reasonably well both
DH98 and Carrera (2005) models, but the other 2 intermediate/old clusters are better represented by the model of PT98, 3) we have found 3 new very old SMC clusters
and two of them, L 4 and L 6, are right next to each other in the very outer reaches of the SMC, and 4) these three old clusters are candidates for filling the possible “SMC age gap”. Accurate ages and abundances for them now allows improved understanding of the AMR for the old period, particularly between L 1 and NGC 121.
Considering the full cluster sample, we corroborate that the model of PT98 is a good indicator of the chemical enrichment of the SMC for ages less that 4 Gyrs (except for the anomalous cluster NGC 330) but a more complicated model is needed to account for the intermediate/old SMC period. The PT98 model underestimates metallicities during this period. It is clear that the chemical evolution was slow during this period and then experienced an increase during the last few Gyrs, as discussed extensively in Paper I. However, sample size is still small, especially for older clusters. Continued searches for such new old clusters will be important to try and pin down the chemical evolution and cluster formation history during this time, and see how real the possible SMC age gap really is. Accurate ages and metallicities for more clusters, on a homogeneous scale, are also of paramount importance to derive a definitive understanding of the chemical evolution of this important galaxy.
8 Summary and Conclusions
We measured the parameter in the vs. CMD of 15 SMC star clusters and we used the calibrations of Carraro & Chiosi (1994, CC94) to derive their ages. We found that three of them, L 110, L 4 and L 6, are newly discovered very old SMC clusters ( 7.6 1.0, 7.9 1.1 and 8.7 1.2, respecively). Consequently, we have enlarged considerably the number of known old clusters in this galaxy. We corroborate the old nature of these new old clusters, from two independent methods. First, we derived a new calibration (SMC calibration), using the SMC clusters studied by Glatt et al. (2008a, b) with deep HST photometry. Secondly, we calibrated our VLT photometry with independent observations and we fitted different sets of isochrones to the calibrated CMD of these old clusters.
Finally, using ages derived from the combination of and CC94’s calibration, and metallicities from Parisi et al. (2009) we analyzed the age distribution (AD), age gradient and the age metallicity relation of the SMC. Our main results are:
-
•
We combined our 15 SMC cluster with 35 clusters studied by other authors. The AD of this combined sample of 50 clusters reproduces the two peaks found in Piatti et al. (2011b) at 2 and 5 Gyr (corresponding to possible episodes of cluster formation) but it does not show a constant slope in the AD for the first 4 Gyr. The peak at 5 Gyr is in reasonable agreement with the peak in the field star formation rate at about 4.5 Gyr found recently by the HST study of Weisz et al. (2013) but their second peak at 9 Gyr is not found in our data.
-
•
The extended sample supports the idea of the nonexistence of an age gradient as has been previously suggested by other authors (see, e.g., Piatti 2011c; Glatt et al. 2008b). In particular, we find clusters younger than 3.5 Gyrs at a large range of galactocentric distances and not just near the center, as suggested by the field star data of Weisz et al. (2013)
-
•
Combining our cluster sample with those observed by DH98 and Glatt et al. (also with CaT) and the one cluster with high resolution metallicity, we compiled a sample of 25 clusters on a homogeneous metallicity scale with relatively small errors and study the cluster AMR. We corroborate our Paper I result that for ages smaller than 4 Gyr, the chemical enrichment of the SMC is well represented by the PT98 model but for explaining the intermediate/old SMC period a more complicated model is needed. We now have seven clusters older than 6 Gyr homogeneously studied so we have doubled the representation of that period.
-
•
According to the calibration of CC94, our three new old clusters lie between L 1 and NGC 121, which suggest that the suggested SMC cluster age gap claimed by Glatt et al. (2008a) is probably not real.
References
- Anthony-Twarog & Twarog (1985) Anthony-Twarog, B.J., & Twarog, B.A. 1985, ApJ, 291, 595
- Beasley et al. (2002) Beasly, M., Hoyle, F., & Sharples, R.M. 2002, MNRAS, 336, 168
- Bertelli et al. (1994) Bertelli, G., Bressan, A., Chiosi, C., Fagotto, F., & Nasi, E. 1994, A&AS, 106, 275
- Cannon (1970) Cannon, R.D. 1970, MNRAS, 150, 111
- Carraro & Chiosi (1994) Carraro, G., & Chiosi, C. 1994, A&A, 287, 761 (CC94)
- Carrera (2005) Carrera, R. 2005, Ph. D. Thesis, Departamento de Astrofísica, Universidad de La Laguna, España.
- Carrera et al. (2008) Carrera, R., Gallart, C., Aparicio, A., et al. 2008, AJ, 136, 1039
- Carretta & Gratton (1997) Carretta, E., & Gratton, R.G. 1997, A&AS, 121, 95
- Cole et al. (2004) Cole, A.A., Smecker-Hane, T.A., Tolstoy, E., Bosler, T.L., & Gallagher, J.S. 2004, MNRAS, 347, 367
- Crowl et al. (2001) Crowl, H.H., Sarajedinini, A., Piatti, A.E., et al. 2001, AJ, 122, 220
- Da Costa (1991) Da Costa, G.S. 1991, in IAU Symp. 148, The Magellanic Clouds, ed. R. Haynes & D. Milne (Dordrecht: Kluwer), 183
- Da Costa & Hatzidimitriou (1998) Da Costa, G.S., & Hatzidimitriou, D. 1998, AJ, 115, 1934 (DH98)
- Dotter et al. (2007) Dotter, A., Chaboyer, B., Jevremović, D., et al. 2007, AJ, 134, 376
- Dotter et al. (2010) Dotter, A., Sarajedini, A., Anderson, J., et al. 2010, ApJ, 708, 698
- Dutra et al. (1999) Dutra, C.M., Bica, E., Clariá, J.J., & Piatti, A.E., 1999, MNRAS, 305, 373
- Ferraro et al. (1995) Ferraro, F.R., Fusi Pecci, F., Testa, V., et al. 1995, MNRAS, 272, 391
- Geisler et al. (1997) Geisler, D., Bica, E., Dottori, H., et al. 1997, AJ 114, 1920
- Girardi et al. (2000) Girardi, L., Bressan, A., Bertelli, G., & Chiosi, C. 2000, A&AS, 141,371
- Girardi (2008) Girardi, L. Dalcanton, J., Williams, B., et al. 2008, PASP, 120, 583
- Glatt et al. (2008a) Glatt, K., Gallagher, J.S., III, Grebel, E.K., et al. 2008a, AJ, 135, 1106
- Glatt et al. (2008b) Glatt, K., Grebel, E.K., Sabbi, E. et al. 2008b, AJ, 136, 1703
- Gonzalez & Wallerstein (1999) Gonzalez, G., &, Wallerstein, G. 1999, AJ, 117, 2286
- Grocholski et al. (2006) Grocholski, A.J., Cole, A.A, Sarajedini, A., Geisler, D., & Smith, V. 2006, AJ, 132, 1630
- Harris & Zaritsky (2004) Harris, J., & Zaritsky, D. 2004, AJ, 127, 1531
- Janes & Phelps (1994) Janes, K.A., & Phelps, R.L. 1994, AJ, 108, 1773 (JP94)
- Landolt (1992) Landolt, A. 1992. AJ, 104, 340
- Marigo et al. (2008) Marigo, P., Girardi, L., Bressan, A., et al. 2008, A&A, 482, 883
- Mighell et al. (1998) Mighell, K.J., Sarajedini, A., & French, R. S. 1998, AJ, 116, 2395
- Olszewski et al. (1996) Olszewski, E.W., Suntzeff, N.B., & Mateo, M. 1996, ARA&A, 34, 511
- Pagel & Tautvaišienė (1998) Pagel, B.E.J., & Tautvaišienė, G. 1998, MNRAS, 299, 535 (PT98)
- Parisi et al. (2009) Parisi, M.C., Grocholski A.J., Geisler, D., Sarajedini, A., & Clariá, J.J. 2009, AJ, 138, 517 (Paper I)
- Phelps et al. (1994) Phelps, R.L., Janes, K.A., & Montgomery, K.A. 1994, AJ, 107, 1079
- Piatti (2011a) Piatti, A.E. 2011a, MNRAS, 416, L89
- Piatti (2011c) Piatti, A.E. 2011c, MNRAS, 418, L69
- Piatti (2012) Piatti, A.E. 2012, ApJ, 756, L32
- Piatti et al. (2011b) Piatti, A.E., Clariá, J.J., Bica, E., et al. 2011b, MNRAS, 417, 1559
- Piatti et al. (2001) Piatti, A.E., Santos, J.F.C., Clariá, J.J., et al. 2001, MNRAS, 325, 792
- Piatti et al. (2007a) Piatti, A.E., Sarajedini, A., Geisler, D., Clark, D., & Seguel, J. 2007a, MNRAS, 377, 300
- Piatti et al. (2007b) Piatti, A.E., Sarajedini, A., Geisler, D., Gallart, C., & Wischnjewsky, M. 2007b, MNRAS, 381, L84
- Piatti et al. (2007c) Piatti, A.E., Sarajedini, A., Geisler, D., Gallart, C., & Wischnjewsky, M. 2007c, MNRAS, 382, 1203
- Piatti et al. (2005) Piatti, A.E., Sarajedini, A., Geisler, D., Seguel, J., & Clark, D. 2005, MNRAS, 358, 1215
- Pietrinferni et al. (2004) Pietrinferni, A., Cassisi, S., Salaris, M., & Castelli, F. 2004, ApJ, 612, 168
- Rafelski & Zaritsky (2005) Rafelski, M., & Zaritsky, D. 2005, AJ, 129, 2701
- Rich et al. (2000) Rich, R.M., Shara, M., Fall, S.M., & Zurek, D. 2000, AJ, 119, 197
- Rosenberg et al. (1999) Rosenberg, A., Saviane, I., Piotto, G., & Aparicio, A. 1999, AJ, 118, 2306
- Salaris & Weiss (1997) Salaris, M., & Weiss, A. 1997, A&A, 327, 107
- Salaris et al. (2004) Salaris, M., Weiss, A., & Percival, M. 2004, A&A, 414, 163 (S04)
- Sarajedini & Demarque (1990) Sarajedini, A., & Demarque, P. 1990, ApJ, 365, 219
- Stetson (1987) Stetson, P.B. 1987, PASP, 99, 191
- Storm et al. (2004) Storm, J., Carney, B.W., Gieren, W.P., et al. 2004, A&A, 415, 531
- Stryker et al. (1985) Stryker, L.L., Da Costa, G.S., & Mould, J.R. 1985, ApJ, 298, 544
- van den Bergh (1991) van den Bergh, S. 1991, ApJ, 369, 1
- Vandenberg et al. (1990) Vandenberg, D.A., Bolte, M., & Stetson, P.B. 1990, AJ, 100, 445
- Weisz et al. (2013) Weisz, D.R., Dolphin, A.E., Skillman, E.D., et al. 2013, 2013arXiv1301.7422
| Cluster | RA (J2000.0) | Dec (J2000.0) | [Fe/H] | |
|---|---|---|---|---|
| ( ) | (∘ ′ ′′) | dex | (∘) | |
| BS 121 = SMC OGLE 237 | 01 04 22 | -72 50 52 | -0.66 0.07 | 1.496 |
| HW 47 | 01 04 04 | -74 37 09 | -0.92 0.04 | 3.502 |
| HW 84 | 01 41 28 | -71 09 58 | -0.91 0.05 | 5.513 |
| HW 86 | 01 42 22 | -74 10 24 | -0.61 0.06 | 7.345 |
| L 4 = K 1, ESO 28-15 | 00 21 27 | -73 44 55 | -1.08 0.04 | 3.265 |
| L 5 = ESO 28-16 | 00 22 40 | -75 04 29 | -1.25 0.05 | 3.092 |
| L 6 = K 4, ESO 28-17 | 00 23 04 | -73 40 11 | -1.24 0.03 | 3.124 |
| L 7 = K 5, ESO 28-18 | 00 24 43 | -73 45 18 | -0.76 0.06 | 2.888 |
| L 17 = K 13, ESO 29-1 | 00 35 42 | -73 35 51 | -0.84 0.03 | 1.718 |
| L 19 = SMC OGLE 3 | 00 37 42 | -73 54 30 | -0.87 0.03 | 1.564 |
| L 27 = K 21, SMC OGLE 12 | 00 41 24 | -72 53 27 | -1.14 0.06 | 1.392 |
| L 106 = ESO 29-44 | 01 30 38 | -76 03 16 | -0.88 0.06 | 7.877 |
| L 108 | 01 31 32 | -71 57 10 | -1.05 0.05 | 4.460 |
| L 110 = ESO 29-48 | 01 34 26 | -72 52 28 | -1.03 0.05 | 5.323 |
| L 111 = NGC 643, ESO 29-50 | 01 35 00 | -75 33 24 | -0.82 0.03 | 7.830 |
| Cluster | Contamination | |||||
|---|---|---|---|---|---|---|
| mag | Gyrs | Gyrs | Gyrs | Reference | index | |
| BS 121 | 1.89 0.30 | 3.5 0.5 | 2.8 0.5 | 2.30 | 1 | 0.86 |
| HW 47 | 2.07 0.30 | 4.3 0.7 | 3.3 0.5 | 2.80 | 1 | 0.59 |
| HW 84 | 1.39 0.30 | 2.1 0.3 | 1.6 0.2 | 2.40 | 1 | 0.35 |
| HW 86 | 1.23 0.30 | 1.7 0.2 | 1.4 0.2 | 1.60 | 1 | 0.40 |
| L 4 | 2.91 0.30 | 12.3 2.1 | 7.9 1.1 | 3.10 | 1 | 0.21 |
| L 5 | 2.17 0.30 | 4.9 0.8 | 3.7 0.5 | 4.10 | 1 | 0.30 |
| L 6 | 3.00 0.30 | 13.8 2.4 | 8.7 1.2 | 3.30 | 1 | 0.32 |
| L 7 | 1.45 0.30 | 2.2 0.3 | 1.6 0.2 | 2.00 | 1 | 0.29 |
| L 17 | 2.34 0.30 | 5.9 0.9 | 4.4 0.6 | 1.26 | 2 | 0.54 |
| L 19 | 2.43 0.30 | 6.6 1.1 | 4.8 0.7 | 2.10 | 1 | 0.50 |
| L 27 | 2.39 0.30 | 6.3 1.0 | 4.6 0.6 | 2.10 | 1 | 0.52 |
| L 106 | 1.58 0.30 | 2.5 0.4 | 2.0 0.3 | 0.89 | 3 | 0.13 |
| L 108 | 1.93 0.30 | 3.7 0.6 | 2. 9 0.4 | 0.89 | 3 | 0.17 |
| L 110 | 2.87 0.30 | 11.6 1.9 | 7.6 1.0 | 6.40 | 4 | 0.09 |
| L 111 | 1.57 0.30 | 2.5 0.4 | 2.0 0.3 | 1.00 | 3 | 0.06 |
.
| Cluster | Ref. | |||
|---|---|---|---|---|
| K 28 | 1.70 0.30 | 1 | 1.57 0.30 | 2.0 0.3 |
| K 44 | 2.10 0.20 | 1 | 1.97 0.20 | 3.0 0.3 |
| L 116 | 2.00 0.40 | 1 | 1.87 0.40 | 2.7 0.5 |
| L 32 | 2.50 0.10 | 1 | 2.37 0.10 | 4.6 0.2 |
| L 38 | 2.70 0.10 | 1 | 2.58 0.10 | 5.6 0.3 |
| L 112 | 2.60 0.15 | 2 | 2.47 0.15 | 5.1 0.3 |
| L 113 | 2.35 0.15 | 2 | 2.22 0.15 | 3.9 0.3 |
| AM 3 | 2.70 0.15 | 3 | 2.58 0.15 | 5.6 0.4 |
| HW 31 | 2.50 0.15 | 3 | 2.37 0.15 | 4.6 0.3 |
| HW 40 | 2.60 0.15 | 3 | 2.47 0.15 | 5.1 0.3 |
| HW 41 | 2.70 0.15 | 3 | 2.58 0.15 | 5.6 0.4 |
| HW 42 | 3.10 0.15 | 3 | 2.98 0.15 | 8.5 0.6 |
| HW 59 | 2.80 0.15 | 3 | 2.68 0.15 | 6.2 0.4 |
| HW 63 | 2.60 0.15 | 3 | 2.47 0.15 | 5.1 0.3 |
| L 91 | 2.40 0.15 | 3 | 2.27 0.15 | 4.1 0.3 |
| NGC 339 | 2.60 0.15 | 3 | 2.47 0.15 | 5.1 0.3 |
| L 3 | 0.80 0.25 | 4 | 0.66 0.25 | 0.8 0.1 |
| L 28 | 0.75 0.25 | 4 | 0.61 0.25 | 0.7 0.1 |
| HW 66 | 2.20 0.25 | 4 | 2.08 0.25 | 3.4 0.4 |
| L 100 | 1.80 0.25 | 4 | 1.67 0.25 | 2.2 0.3 |
| HW 79 | 2.40 0.25 | 4 | 2.27 0.25 | 4.1 0.5 |
| L 109 | 2.20 0.25 | 4 | 2.07 0.25 | 3.3 0.4 |
| HW 85 | 1.75 0.25 | 4 | 1.62 0.25 | 2.1 0.2 |
| B 34 | 1.20 0.15 | 5 | 1.06 0.15 | 1.2 0.1 |
| B 39 | 1.20 0.20 | 5 | 1.06 0.20 | 1.2 0.1 |
| B 47 | 1.10 0.30 | 5 | 0.96 0.30 | 1.1 0.1 |
| B 112 | 1.30 0.15 | 5 | 1.16 0.15 | 1.3 0.1 |
| BS 88 | 1.60 0.15 | 5 | 1.46 0.15 | 1.8 0.1 |
| HW 22 | 2.70 0.20 | 5 | 2.58 0.20 | 5.6 0.5 |
| HW 55 | 1.90 0.30 | 5 | 1.77 0.30 | 2.4 0.3 |
| HW 67 | 2.00 0.20 | 5 | 1.87 0.20 | 2.7 0.3 |
| K 38 | 2.10 0.35 | 5 | 1.97 0.35 | 3.0 0.4 |
| L 58 | 1.60 0.20 | 5 | 1.46 0.20 | 1.8 0.2 |
| NGC 419 | 1.10 0.25 | 5 | 0.96 0.25 | 1.1 0.1 |