Decoherence-assisted spectroscopy of a single Mg+ ion
Abstract
We describe a high-resolution spectroscopy method, in which the detection of single excitation events is enhanced by a complete loss of coherence of a superposition of two ground states. Thereby, transitions of a single isolated atom nearly at rest are recorded efficiently with high signal-to-noise ratios. Spectra display symmetric line shapes without stray-light background from spectroscopy probes. We employ this method on a 25Mg+ ion to measure one, two, and three-photon transition frequencies from the ground state to the , , and excited states, respectively. Our results are relevant for astrophysics and searches for drifts of fundamental constants. Furthermore, the method can be extended to other transitions, isotopes, and species. The currently achieved fractional frequency uncertainty of is not limited by the method.
pacs:
32.30.Jc, 37.10.Ty, 37.10.Rs, 37.25.+kQuantum systems that are well isolated from their environments, e.g., tailored solid-state systems, photons, and trapped atoms, offer a high level of control Ladd et al. (2010). Over the past decades, several experimental methods have been devised for quantum control of single trapped ions Brown and Gabrielse (1986); Wineland (2013); Leibfried et al. (2003). Developments are driven by the urge to make more accurate and precise clocks Diddams et al. (2001); Schmidt et al. (2005) as well as to address questions in different fields of research, e.g., properties of highly charged ions Gillaspy (2001); Derevianko et al. (2012), ion-neutral collisions Côté and Dalgarno (2000); Idziaszek et al. (2007); Bodo et al. (2008); Idziaszek et al. (2009), molecular physics Carr et al. (2009); Kahra et al. (2012); Loh et al. (2013), and tests of fundamental physics Hanneke et al. (2008); Pohl et al. (2010); ATRAP Collaboration (2013); Mooser et al. (2013); DiSciacca et al. (2013). High-resolution spectroscopy measurements Drullinger et al. (1980); Rosenband et al. (2008); Wolf et al. (2008); Batteiger et al. (2009); Wan et al. (2013) are of particular interest for studying spatial and temporal fine structure variations of the universe Webb et al. (1999); Dzuba et al. (1999); Webb et al. (2011). In such experiments, complex atomic and molecular structures need to be probed by single- or multi-photon transitions in isotopically pure samples revealing undisturbed transition line shapes. Weak transitions in trapped ions can be measured with various methods Schmidt et al. (2005); Wineland (2013), and techniques based on the detection of momentum kicks altering the occupation of motional states from few absorbed photons have been developed that are applicable to strong electric dipole transitions as well Hempel et al. (2013); Wan et al. (2013). In this Letter, we experimentally study single- and multi-photon transitions in a single, laser cooled 25Mg+ ion that can be near-perfectly isolated from its environment. We detect the decoherence of a superposition of two electronic ground states due to single scattering events and determine transition frequencies which are relevant for astrophysics and searches for variations of fundamental constants Berengut and Flambaum (2010); Destree et al. (2010) with a fractional uncertainty of .
For a simplified description of the method, consider an atom with three states. Two of these states, labeled and , which are long-lived and allow for coherent control, are used to study transitions to a third, excited state . After preparation in , a pulse on the transition creates a superposition state . A spectroscopy pulse probes the couplings and during a delay period . To decouple the superposition state from sources of detrimental decoherence, a spin-echo pulse is applied after . A second pulse completes the sequence and the final state is analyzed. Disregarding the influence of the spectroscopy pulse, the total sequence coherently transfers to . However, absorption of a probe photon and the subsequent spontaneous emission project the system into or , i.e., the original phase information of is destroyed. The remaining sequence creates a new superposition state of and , and analyzing the final state, the detection probability of single excitations is 1/2. Hence, decoherence constitutes the spectroscopic signal and, therefore, the method probes only excitation strengths and is insensitive to branching ratios of the spontaneous decay, making it a versatile method to study a variety of transitions.
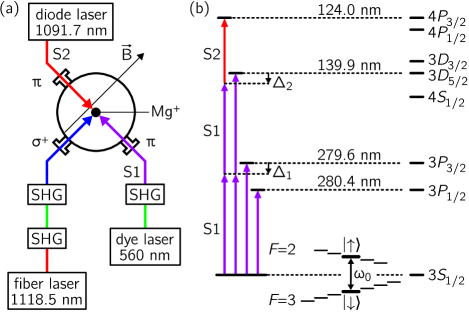
In our experimental demonstration of the method, we trap a single 25Mg+ ion in a linear Paul trap Schaetz et al. (2007). A schematic of the setup is shown in Fig. 1(a), while the relevant energy levels are depicted in Fig. 1(b). The beam of a fiber laser, frequency-quadrupled using two second harmonics generation (SHG) stages Friedenauer et al. (2006), is tuned below the to transition (natural line width Ansbacher et al. (1989)) and aligned with a magnetic quantization field . The light is -polarized and provides Doppler cooling to and optical pumping into the state , where and denote the total angular momentum quantum numbers of the valence electron. This state provides efficient, state sensitive detection via closed cycling transition to to discriminate between the ground state manifolds. We observe a count rate of on average for all states and for the states. As parts of the superposition state we choose the low field clock states and which are separated by . These states feature a low sensitivity to magnetic field fluctuations and long coherence times. We employ microwave pulses to transfer population from to with near-unity fidelity, and to coherently control and . For spectroscopy we use two laser systems: a frequency-doubled dye laser (S1) at wavelength with a beam waist radius ( radius of intensity) of m, and a diode laser (S2, , m). The S1 and S2 laser beams enter the chamber from opposite directions, perpendicular to with linear polarization to induce transitions. We determine the spectroscopy laser wavelengths with a wavelength meter (HighFinesse WS Ultimate/2), which is referenced to the R(53)28-3 line in 127I2 and the D2 line in 87Rb via Doppler-free spectroscopy.
Since 25Mg+ has more than two hyperfine levels in the ground state, the final state is not restricted to superpositions of and , and the excited state can decay into other hyperfine ground states, analogous to electron shelving Leibfried et al. (2003). In that case, the subsequent microwave pulses are off resonant leaving the state unchanged. These other decay channels also alter the detection outcome when recording the spectrum via state-dependent fluorescence. However, comparing to spectra recorded by optical pumping and electron shelving techniques, our method reveals additional features, e.g., excitations from to , to (see below), as well as cycling transitions. Furthermore, it facilitates the detection of transitions with unfavorable branching ratios of the spontaneous decay, and the interlaced pulse enables extended probe periods to detect weak transitions.

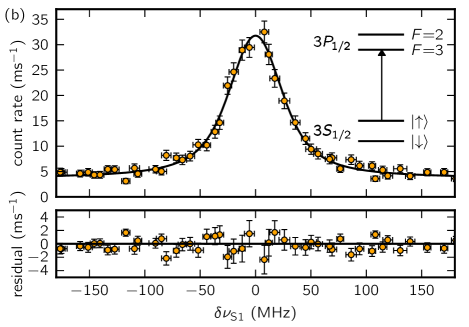
We first implement the method on the to transition, using the pulse sequence outlined in Fig. 2(a). The spectroscopy laser S1 is applied for with an intensity . This corresponds to an on-resonance saturation parameter with saturation intensity , and is equivalent to on average two scattering events per experiment. We repeat the sequence and gradually increase the frequency of S1 to span resulting in an absorption spectrum with two resonances. These are separated by and the excited-state hyperfine structure. Each collected data point represents the average of 2000 experiments, acquired in about per point. Fig. 2(b) only covers a fraction of the full spectrum to emphasize the undistorted, symmetric line shape centered at the to resonance. A best fit is shown as a solid line and yields no significant deviation from a Voigt profile with fixed natural line width Ansbacher et al. (1989). We find a Gaussian contribution of while the calculated Doppler limit amounts to and the broadening due to residual micromotion is estimated to be less than of the natural line width. Based on a beat note measurement of S1 with the Doppler cooling laser (at ), we attribute the main part of the Gaussian contribution to the line width of S1. Since this broadening effect preserves symmetric line shapes, the center of the resonance is still determined with high precision.
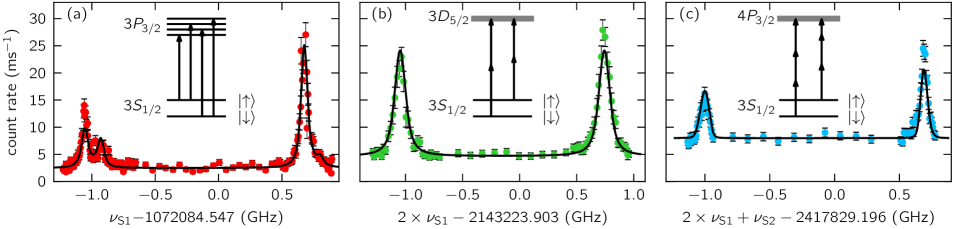
In total, we study four different transitions to excited electronic states in detail: two one-photon transitions ( to and ), one two-photon transition ( to ), and one three-photon transition ( to ). These transitions, as well as the relevant detunings and are sketched in Fig. 1(b). We record 28 one-photon transition spectra with different laser intensities – and probe durations –. Figure 3(a) shows an absorption spectrum of the to transition that resolves the substructure resulting from hyperfine interactions. The two-photon transition to ( Fischer and Tachiev (2013)) is probed with intensities – and probe durations – leading to 24 different spectra centered around a detuning of S1 from ; one representative is shown in Fig. 3(b). In the three-photon absorption spectra to ( Fischer and Tachiev (2013)), we vary the frequency of S2 in discrete steps to obtain a spectrum, while the frequency of S1 is locked via Doppler-free spectroscopy at from and from , see Fig. 3(c). Due to the hyperfine splitting of the ground state, the detuning from the line centroid amounts to roughly from two-photon resonance (cf. Figs. 1(b) and 3(b)). We record 28 spectra with varying laser intensities – and –, and probe durations –.
To extract the line centroids from the data, each absorption spectrum is analyzed by a best fit considering the substructure as a sum of Voigt profiles. To reduce the number of free fit parameters, relative transition strengths and sublevel splittings due to hyperfine and magnetic field interactions as well as the effect of population transfer between and all other hyperfine ground states due to spontaneous emission are set to their calculated values Metcalf and van der Straten (1999). The calculations include magnetic-dipole and electric-quadrupole hyperfine constants Itano and Wineland (1981); Sur et al. (2004); Safronova et al. (1998), and natural line widths. We calibrate the magnetic field strength using measurements of to microwave transitions with a magnetic field sensitivity of . We neglect transitions with a calculated relative intensity of less than , leaving four free fit parameters: fluorescence offset, signal intensity, Gaussian width , and centroid frequency . The results are shown as solid lines in Fig. 3. Within our measurement resolution, we find no systematic shifts of the line centroids of the one and two-photon transitions for our range of intensities and pulse durations. However, probing the three-photon transition, we observe a systematic shift related to the intensity of S2 of up to . We account for this effect by including ac-Stark shifts from off-resonant coupling of S2 to the and states into our fit model. To this end, for the three-photon transition, we introduce the intensity of S2 as an additional free parameter in the fit routine. We compare the fitted intensities with the results of beam waist and power measurements and find that the observed shift is consistent with being entirely due to this effect.
In Fig. 4 we show the deviation of each fitted from the mean centroid of all analyzed spectra, with the data ordered according to the measurement day. Each data point represents a spectrum similar to those shown in Fig. 3 and the error bars indicate the statistical uncertainty from the fit result, while the corresponding are listed in Table 1. The main systematics dominating the estimated uncertainty of the transition frequencies stems from the frequency measurement. We conservatively estimate this to be near and near . We calibrated the wavelength meter with two reference frequencies, known to an uncertainty of for the line Knöckel and Tiemann and for the line Ye et al. (1996); Bize et al. (1999). When probing the three-photon transition, an additional systematic uncertainty of arises from the Doppler-free spectroscopy used for locking S1. Additional effects, e.g., correction of ac Stark shifts, magnetic field fluctuations, spectral widths of the spectroscopy lasers, and deviations of relative intensities, each contribute less than to the final uncertainties.

| Transition frequencies in 25Mg+ from in THz | ||
| This work | 1 069.339 957 (5) | 1 072.084 547 (5) |
| Batteiger et al. Batteiger et al. (2009) | 1 069.339 96 (2) | 1 072.084 56 (2) |
| This work | 2 143.223 903 (7) | 2 417.829 196 (12) |
| Martin et al. Martin and Zalubas (1980) | 2 143.222 0 (15) | 2 417.826 8 (15) |
| Goorvitch et al. Goorvitch et al. (1970) | 2 143.227 7 (18) | 2 417.805 (10) |
In Table 1 we compare our results to literature values. The one-photon transition frequencies are in good agreement with the values from Ref. Batteiger et al. (2009). We have conducted the first isotopically pure measurements of transition frequencies to the and levels, and improved the fractional frequency uncertainty compared to previously calculated Martin and Zalubas (1980) and experimental Goorvitch et al. (1970) values by more than two orders of magnitude.
We record high-SNR and symmetric line shapes of one, two, and three-photon transitions, allowing for the determination of transition frequencies with a fractional frequency uncertainty of . This uncertainty is limited by our wavelength measurement and can be substantially improved by using a frequency comb. In addition, the resolution can be enhanced by use of spectroscopy lasers with smaller spectral widths and by cooling the ion to the motional ground state. With the demonstrated sensitivity and the multitude of accessible transitions enabled by utilizing a superposition state, the method may facilitate the determination of transition strengths, natural line widths, and hyperfine constants. Furthermore, it can be extended to other transitions, isotopes, species, and even other quantum systems. In particular, the signal induced by decoherence is insensitive to branching ratios of the spontaneous decay. In combination with a logic ion Wineland (2013), and incorporating the motional degrees of freedom into our method, it may also be applicable to species without cooling and detection transitions as well as molecular ions. We anticipate that this spectroscopy method is only one of many future techniques that take advantage of decoherence effects that are typically thought of as detrimental when controlling quantum systems.
Acknowledgements.
This work was supported by DFG (SCHA 973), and EU (PICC, Grant No. 249958). We gratefully acknowledge the technical support from the company HighFinesse, who provided us with the wavelength meter. We thank M. Bujak for installing the diode laser system, and J. Denter for maintaining the dye lasers.References
- Ladd et al. (2010) T. D. Ladd, F. Jelezko, R. Laflamme, Y. Nakamura, C. Monroe, and J. L. O’Brien, Nature 464, 45 (2010).
- Brown and Gabrielse (1986) L. S. Brown and G. Gabrielse, Rev. Mod. Phys. 58, 233 (1986).
- Wineland (2013) D. J. Wineland, Rev. Mod. Phys. 85, 1103 (2013).
- Leibfried et al. (2003) D. Leibfried, R. Blatt, C. Monroe, and D. Wineland, Rev. Mod. Phys. 75, 281 (2003).
- Diddams et al. (2001) S. A. Diddams et al., Science 293, 825 (2001).
- Schmidt et al. (2005) P. O. Schmidt, T. Rosenband, C. Langer, W. M. Itano, J. C. Bergquist, and D. J. Wineland, Science 309, 749 (2005).
- Gillaspy (2001) J. D. Gillaspy, J. Phys. B-At. Mol. Opt. 34, R93 (2001).
- Derevianko et al. (2012) A. Derevianko, V. A. Dzuba, and V. V. Flambaum, Phys. Rev. Lett. 109, 180801 (2012).
- Côté and Dalgarno (2000) R. Côté and A. Dalgarno, Phys. Rev. A 62, 012709 (2000).
- Idziaszek et al. (2007) Z. Idziaszek, T. Calarco, and P. Zoller, Phys. Rev. A 76, 033409 (2007).
- Bodo et al. (2008) E. Bodo, P. Zhang, and A. Dalgarno, New J. Phys. 10, 033024 (2008).
- Idziaszek et al. (2009) Z. Idziaszek, T. Calarco, P. S. Julienne, and A. Simoni, Phys. Rev. A 79, 010702 (2009).
- Carr et al. (2009) L. D. Carr, D. DeMille, R. V. Krems, and J. Ye, New J. Phys. 11, 055049 (2009).
- Kahra et al. (2012) S. Kahra et al., Nat. Phys. 8, 238 (2012).
- Loh et al. (2013) H. Loh, K. C. Cossel, M. C. Grau, K.-K. Ni, E. R. Meyer, J. L. Bohn, J. Ye, and E. A. Cornell, Science 342, 1220 (2013).
- Hanneke et al. (2008) D. Hanneke, S. Fogwell, and G. Gabrielse, Phys. Rev. Lett. 100, 120801 (2008).
- Pohl et al. (2010) R. Pohl et al., Nature 466, 213 (2010).
- ATRAP Collaboration (2013) ATRAP Collaboration, Phys. Rev. Lett. 110, 130801 (2013).
- Mooser et al. (2013) A. Mooser, H. Kracke, K. Blaum, S. A. Bräuninger, K. Franke, C. Leiteritz, W. Quint, C. C. Rodegheri, S. Ulmer, and J. Walz, Phys. Rev. Lett. 110, 140405 (2013).
- DiSciacca et al. (2013) J. DiSciacca, M. Marshall, K. Marable, and G. Gabrielse, Phys. Rev. Lett. 110, 140406 (2013).
- Drullinger et al. (1980) R. E. Drullinger, D. J. Wineland, and J. C. Bergquist, Appl. Phys. 22, 365 (1980).
- Rosenband et al. (2008) T. Rosenband et al., Science 319, 1808 (2008).
- Wolf et al. (2008) A. L. Wolf, S. A. van den Berg, C. Gohle, E. J. Salumbides, W. Ubachs, and K. S. E. Eikema, Phys. Rev. A 78, 032511 (2008).
- Batteiger et al. (2009) V. Batteiger, S. Knünz, M. Herrmann, G. Saathoff, H. A. Schüssler, B. Bernhardt, T. Wilken, R. Holzwarth, T. W. Hänsch, and T. Udem, Phys. Rev. A 80, 022503 (2009).
- Wan et al. (2013) Y. Wan, F. Gebert, J. B. Wübbena, N. Scharnhorst, S. Amairi, I. D. Leroux, B. Hemmerling, N. Lörch, K. Hammerer, and P. O. Schmidt, arXiv e-print 1309.7033 (2013).
- Webb et al. (1999) J. K. Webb, V. V. Flambaum, C. W. Churchill, M. J. Drinkwater, and J. D. Barrow, Phys. Rev. Lett. 82, 884 (1999).
- Dzuba et al. (1999) V. A. Dzuba, V. V. Flambaum, and J. K. Webb, Phys. Rev. Lett. 82, 888 (1999).
- Webb et al. (2011) J. K. Webb, J. A. King, M. T. Murphy, V. V. Flambaum, R. F. Carswell, and M. B. Bainbridge, Phys. Rev. Lett. 107, 191101 (2011).
- Hempel et al. (2013) C. Hempel, B. P. Lanyon, P. Jurcevic, R. Gerritsma, R. Blatt, and C. F. Roos, Nat. Photon. 7, 630 (2013).
- Berengut and Flambaum (2010) J. C. Berengut and V. V. Flambaum, Hyperfine Interact. 196, 269 (2010).
- Destree et al. (2010) J. D. Destree, K. E. Williamson, and T. P. Snow, Astrophys. J. Lett. 712, L48 (2010).
- Schaetz et al. (2007) T. Schaetz, A. Friedenauer, H. Schmitz, L. Petersen, and S. Kahra, J. Mod. Optic. 54, 2317 (2007).
- Friedenauer et al. (2006) A. Friedenauer, F. Markert, H. Schmitz, L. Petersen, S. Kahra, M. Herrmann, T. Udem, T. W. Hänsch, and T. Schaetz, Appl. Phys. B 84, 371 (2006).
- Ansbacher et al. (1989) W. Ansbacher, Y. Li, and E. Pinnington, Phys. Lett. A 139, 165 (1989).
- Fischer and Tachiev (2013) C. F. Fischer and G. Tachiev, MCHF/MCDHF Collection, Version 2, http://physics.nist.gov/mchf, National Institute of Standards and Technology (2013).
- Metcalf and van der Straten (1999) H. J. Metcalf and P. van der Straten, Laser Cooling and Trapping (Springer, New York, 1999).
- Itano and Wineland (1981) W. M. Itano and D. J. Wineland, Phys. Rev. A 24, 1364 (1981).
- Sur et al. (2004) C. Sur, B. K. Sahoo, R. K. Chaudhuri, B. P. Das, and D. Mukherjee, Eur. Phys. J. D 32, 25 (2004).
- Safronova et al. (1998) M. S. Safronova, A. Derevianko, and W. R. Johnson, Phys. Rev. A 58, 1016 (1998).
- (40) H. Knöckel and E. Tiemann, Computer Program IodineSpec5.
- Ye et al. (1996) J. Ye, S. Swartz, P. Jungner, and J. L. Hall, Opt. Lett. 21, 1280 (1996).
- Bize et al. (1999) S. Bize, Y. Sortais, M. S. Santos, C. Mandache, A. Clairon, and C. Salomon, EPL 45, 558 (1999).
- Martin and Zalubas (1980) W. C. Martin and R. Zalubas, J. Phys. Chem. Ref. Data 9, 1 (1980).
- Goorvitch et al. (1970) D. Goorvitch, G. Mehlman-Balloffet, and F. P. J. Valero, J. Opt. Soc. Am. 60, 1458 (1970).