**–**
Glitch Statistics of Radio Pulsars : Multiple populations
Abstract
We present statistical evidence suggesting more than one population in the energy distributing of pulsar glitches, which implies the presence of different mechanisms accessing different energy ranges responsible for glitches.
A glitch is a timing irregularity of radio pulsars, marked by a sudden increase in the spin-frequency , often followed by a relaxation towards the unperturbed . So far, a total of 451 glitches have been seen in 158 objects (151 radio pulsars, 7 magnetars) (Espinoza et al., 2011). These are likely caused by sudden and irregular transfer of angular momentum to the solid crust of the neutron star by a super-fluid component rotating faster; or by the crust quakes. It is conjectured that the bimodality seen within the range of glitch values () are indicative of these two separate mechanisms (Yu et al., 2013). As a step towards understanding the mechanism underlying glitches, we consider the statistical nature of the glitch energy () distribution. The rotational energy () of a pulsar is approximately , where is the stellar moment of inertia. The change in rotational energy due to a glitch is then , assuming to be roughly constant ( gm.cm2) across the glitching pulsar population.
One possible way in which multiple glitching populations may manifest in the data is via multimodal structure in the probability densities. We therefore apply three standard statistical tests to the and data; namely, dip test (Hartigan & Hartigan, 1985), Silverman test (Silverman, 1981), and bimodality test (Holzmann & Vollmer, 2008). The null hypothesis for all these tests is that of unimodality. As a measure of evidence against the null hypothesis, we report the -value for each test (; lower the , greater the evidence against the null hypothesis). For the data, the -values are and strong evidence against unimodality. For the data, the -values are and respectively. The dip test -value, though closer to 0 than to 1, suggests little or no evidence against unimodality. Reasons for this (apparent) discrepancy between the dip test and the other two tests are being investigated.
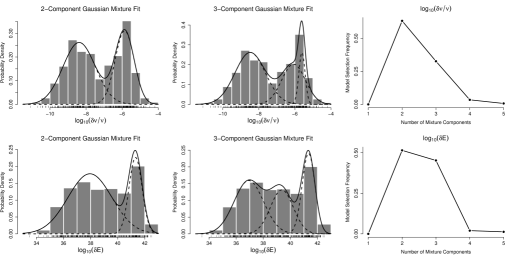
On the other hand, unimodal structure of a probability density function may not necessarily rule out the presence of multiple populations. For example, the sum of two not-so-well-separated Gaussians may be unimodal. We therefore model the probability densities of the two glitch quantities as mixtures of Gaussians (McLachlan & Peel, 2000) with up to 5 components (Gaussianity is a purely modeling assumption here). We apply a multimodel bootstrap approach coupled with BIC-based model selection (Burnham & Anderson, 2002) to obtain model selection frequencies. Here, selection frequency for the 1-component model is akin to the -value for a test. The two columns on the left in Fig. 1 show data histograms with mixture fits. BIC-optimal mixture size is 2 for both quantities. The right column shows model selection frequencies against mixture size (bootstrap size: 10000): We see that the 1-component model is the least favoured one for either quantity.
Our statistical analysis is therefore indicative of the presence of structure in the data which, in turn, is suggestive of more than one glitch mechanisms corresponding to different intrinsic energies. These may well correspond to the energies available in different crustal regions of a neutron star (Mandal et al., 2009). We conclude that mechanisms responsible for glitches are perhaps different for different energy regimes, originating in different regions of the star. (We used the R statistical computing environment (R Core Team, 2013) for computation.)
References
- Burnham & Anderson (2002) Burnham, K.P., & Anderson, D.R., 2002, Model Selection and Multimodel Inference, Springer.
- Espinoza et al. (2011) Espinoza, C.M., Lyne, A.G., Stappers, B.W., Kramer, M., 2011, MNRAS, 414, 1679.
- Hartigan & Hartigan (1985) Hartigan, J.A. & Hartigan, P.M., Ann. Stat., 1985, 13, 70.
- Holzmann & Vollmer (2008) Holzmann, H. & Vollmer S., AStA Adv. Stat. Anal., 2008, 92, 57.
- McLachlan & Peel (2000) McLachlan, G., & Peel, D., 2000, Finite Mixture Models, Wiley (New York).
- Mandal et al. (2009) Mandal, R.D.R. & Konar, S. & Dey, M. & Dey, J., 2009, MNRAS, 399, 822.
- Silverman (1981) Silverman, B.W., J. Roy. Statist. Soc. Ser. B, 1981, 43, 97.
- R Core Team (2013) R Core Team, http://www.R-project.org/, 2013.
- Yu et al. (2013) Yu, M. et al. , 2013, MNRAS, 429, 688.