Anomalous critical fields in quantum critical superconductors
Abstract
Fluctuations around an antiferromagnetic quantum critical point (QCP) are believed to lead to unconventional superconductivity and in some cases to high-temperature superconductivity. However, the exact mechanism by which this occurs remains poorly understood. The iron-pnictide superconductor BaFe2(As1-xPx)2 is perhaps the clearest example to date of a high temperature quantum critical superconductor, and so it is a particularly suitable system in which to study how the quantum critical fluctuations affect the superconducting state. Here we show that the proximity of the QCP yields unexpected anomalies in the superconducting critical fields. We find that both the lower and upper critical fields do not follow the behaviour, predicted by conventional theory, resulting from the observed mass enhancement near the QCP. Our results imply that the energy of superconducting vortices is enhanced, possibly due to a microscopic mixing of antiferromagnetism and superconductivity, suggesting that a highly unusual vortex state is realised in quantum critical superconductors.
Quantum critical points (QCPs) can be associated with a variety of different order-disorder phenomena, however, so far superconductivity has only been found close to magnetic order. Superconductivity in heavy fermions, iron-pnictides, and organic salts is found in close proximity to antiferromagnetic order [1, 2], whereas in the cuprates the nature of the order (known as the pseudogap phase) is less clear [3]. The normal state of these materials have been widely studied and close to their QCPs non-Fermi liquid behaviour of transport and thermodynamic properties are often found, however, comparatively little is known about how the quantum critical fluctuations affect the superconducting state [4]. This is important as it is the difference in energy between the normal and superconducting state which ultimately determines the critical temperature .
Amongst the various iron-pnictide superconductors, BaFe2(As1-xPx)2 has proved to be the most suitable family for studying the influence of quantum criticality on the superconducting state. This is because the substitution of As by P introduces minimal disorder as it tunes the material across the phase diagram from a spin-density-wave antiferromagnetic metal, through the superconducting phase to a paramagnetic metal [5]. The main effect is a compression of the -axis arising from the smaller size of the P ion compared to As which mimics the effect of external pressure [6]. Normal state properties such as the temperature dependence of the resistivity [7] and spin-lattice relaxation rate [8] clearly point to a QCP at . Measurements of superconducting state properties that show signatures of quantum critical effects include the magnetic penetration depth and the heat capacity jump at , [9, 10]. Both of these quantities show a strong increase as tends to 0.30, and it was shown that this could be explained by an underlying 6 fold increase in the quasiparticle effective mass at the QCP [10].
In the standard single-band Ginzburg-Landau theory, the upper critical field is given by
| (1) |
where is the flux quantum and is the Ginzburg-Landau coherence length. In the clean-limit at low temperature is usually well approximated by the BCS coherence length which results in , where is the mass of the quasiparticles, and is the superconducting gap. This simplified analysis is borne out by the full strong coupling BCS theory [12]. Hence, a strong peak in at the QCP should result in a corresponding increase in as well as the slope of at (). This latter quantity is often more easily accessible experimentally because of the very high values in compounds such as iron-pnictides for and also because the values of close to are not reduced by the effect of the magnetic field on the electron-spin (Pauli limiting effects).
For the lower critical field , standard Ginzburg-Landau theory predicts that
| (2) |
where , and so the observed large peak in at the QCP [9] should result in a strong suppression of . Here we show that the exact opposite, a peak in at the QCP, occurs in BaFe2(As1-xPx)2, and in addition the expected sharp increase in is not observed. This suggest that the critical fields of quantum critical superconductors strongly violate the standard theory.
Results
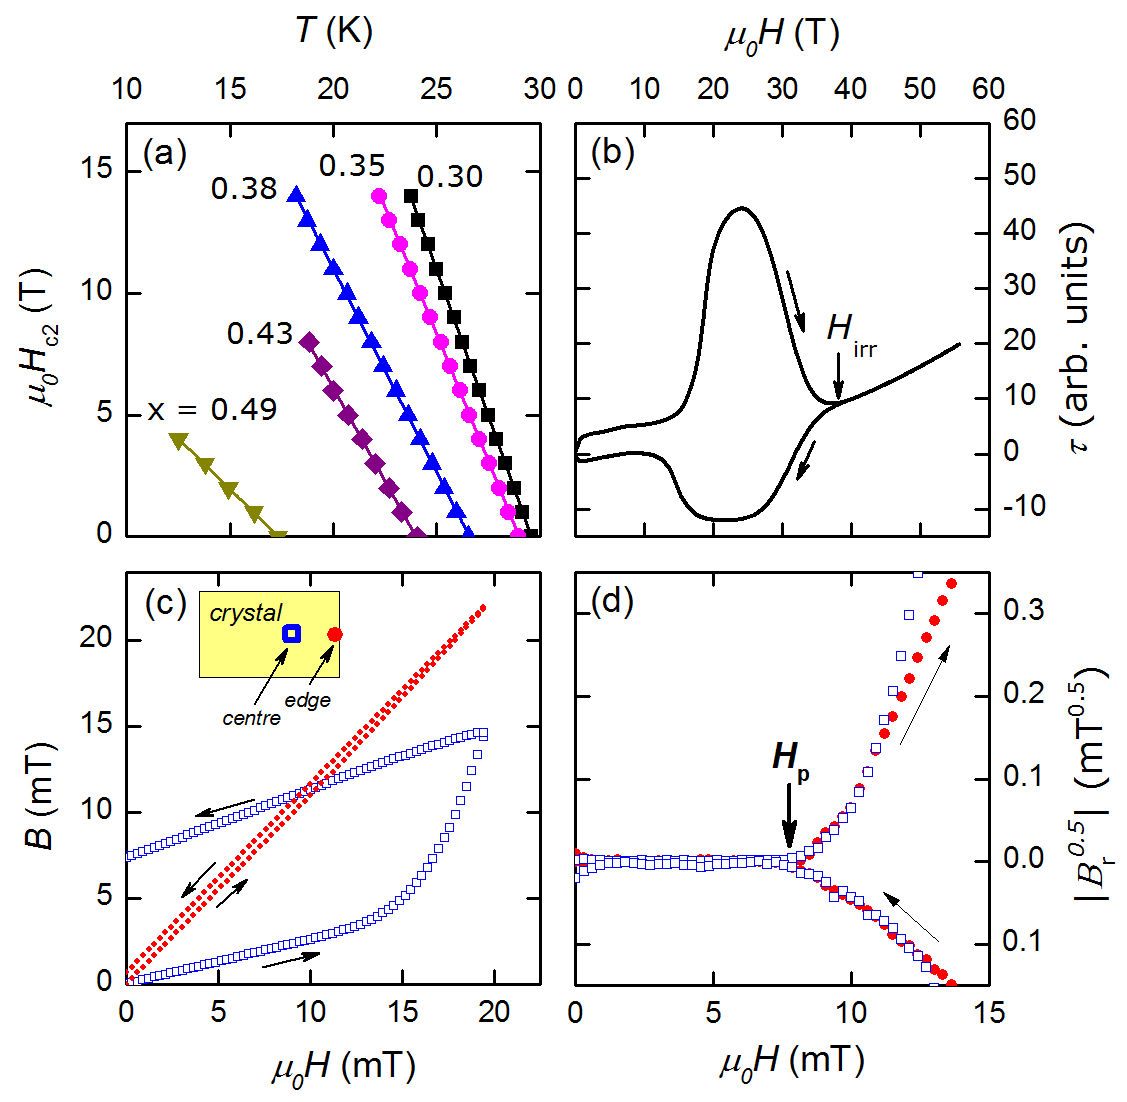
Upper Critical Field . We have measured parallel to the -axis, in a series of high quality single crystal samples of BaFe2(As1-xPx)2 spanning the superconducting part of the phase diagram using two different techniques. Close to we measured the heat capacity of the sample using a micro-calorimeter in fields up to 14 T (see figure 1a). This gives an unambiguous measurement of and the slope which unlike transport measurements is not complicated by contributions from vortex motion [13]. At lower temperature, we used micro-cantilever torque measurements in pulsed magnetic fields up to 60 T. Here, an estimate of was made by observing the field where hysteresis in the torque magnetisation loop closes (see figure 1b). Although, strictly speaking, this marks the irreversibility line , this is a lower limit for and in superconductors with negligible thermal fluctuations and low anisotropy such as BaFe2(As1-xPx)2 should coincide approximately with . Indeed, in Fig. 2 we show that the extrapolation of the high temperature specific heat results, using the Helfand-Werthamer (HW) formula [14], to zero temperature are in good agreement with the irreversibility field measurements showing both are good estimates of .
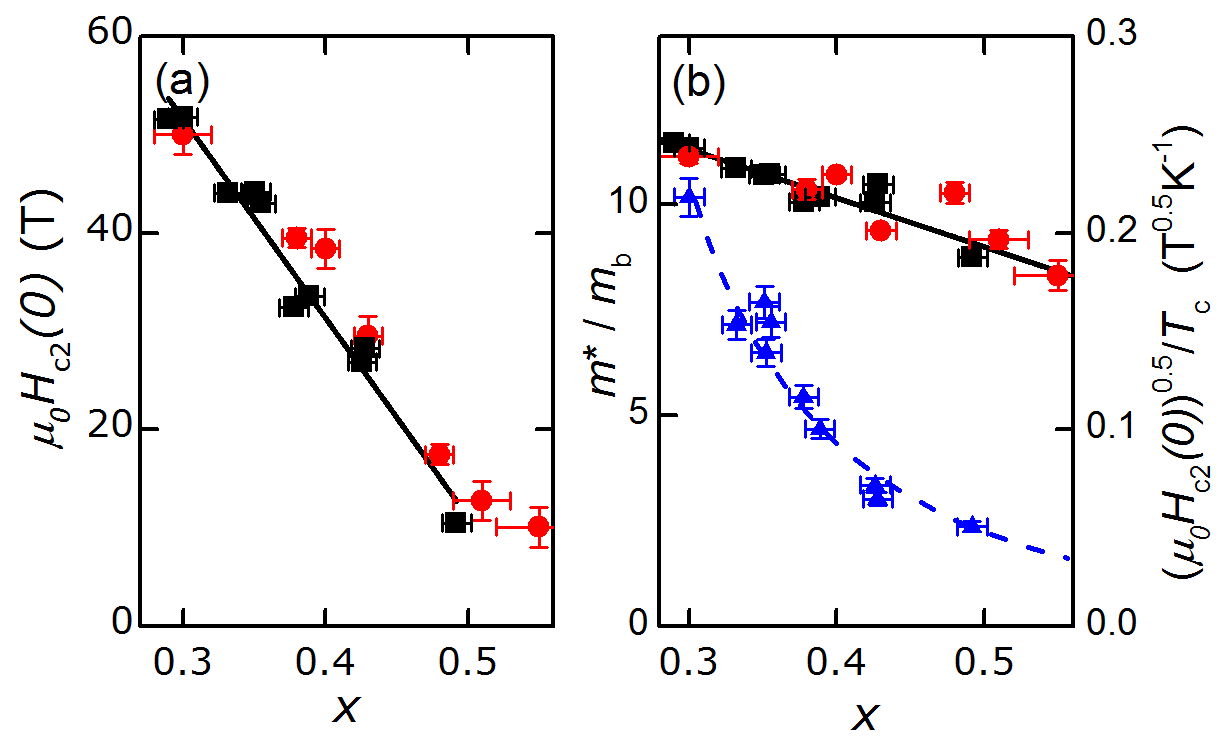
In the clean-limit we would expect to be proportional to the renormalized effective mass . Surprisingly, we show in figure 2 that this quantity increases by just % from to whereas increases by 400% for the same range of .
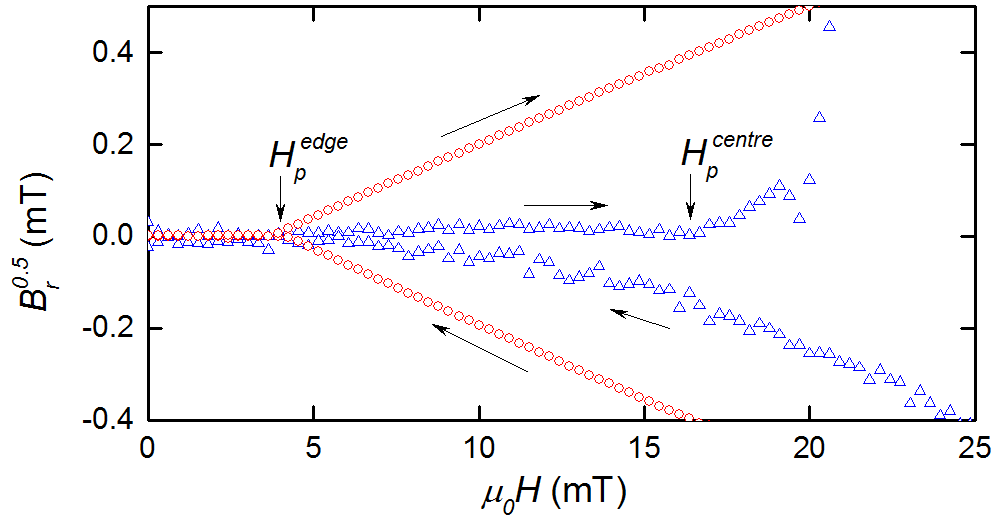
Lower Critical Field . We measured in our BaFe2(As1-xPx)2 samples using a micro-Hall probe array. Here the magnetic flux density is measured at several discrete points a few microns from the surface of the sample. Below , increases linearly with the applied field due to incomplete shielding of the sensor by the sample. Then, as the applied field passes a certain field , increases more rapidly with indicating that vortices have entered the sample (see figure 1 c,d). Care must be taken in identifying with because, in some cases, surface pinning and geometrical barriers can push well above . However, in our measurements several different checks, such as the equality of for increasing and decreasing field [11], and the independence of on the sensor position [15], rule this out (see Methods).
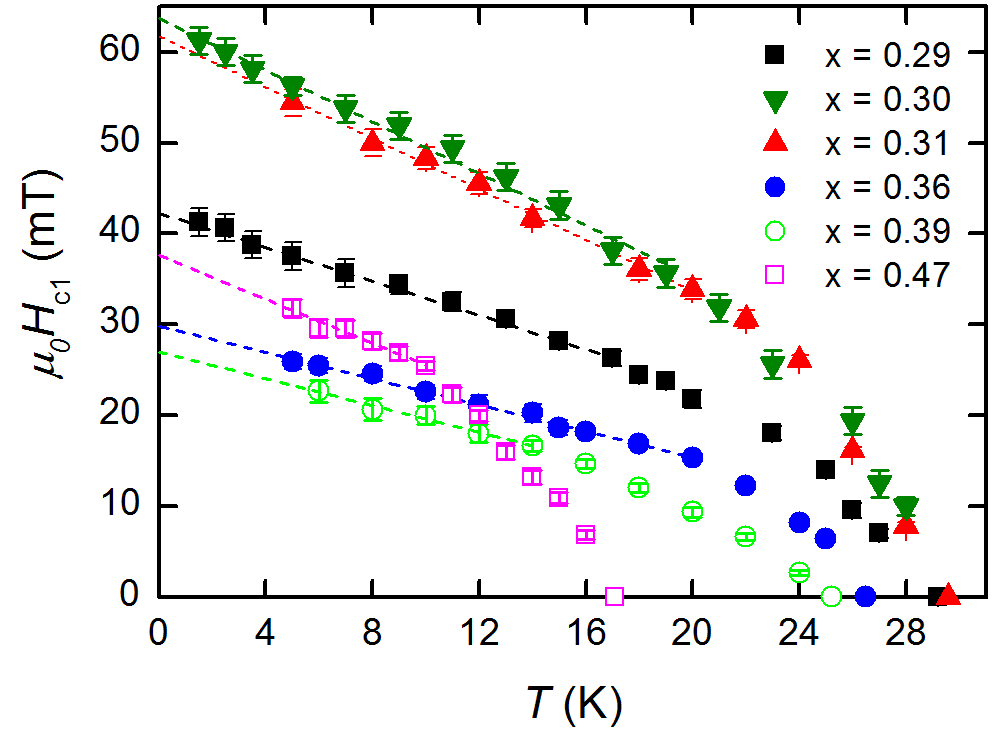

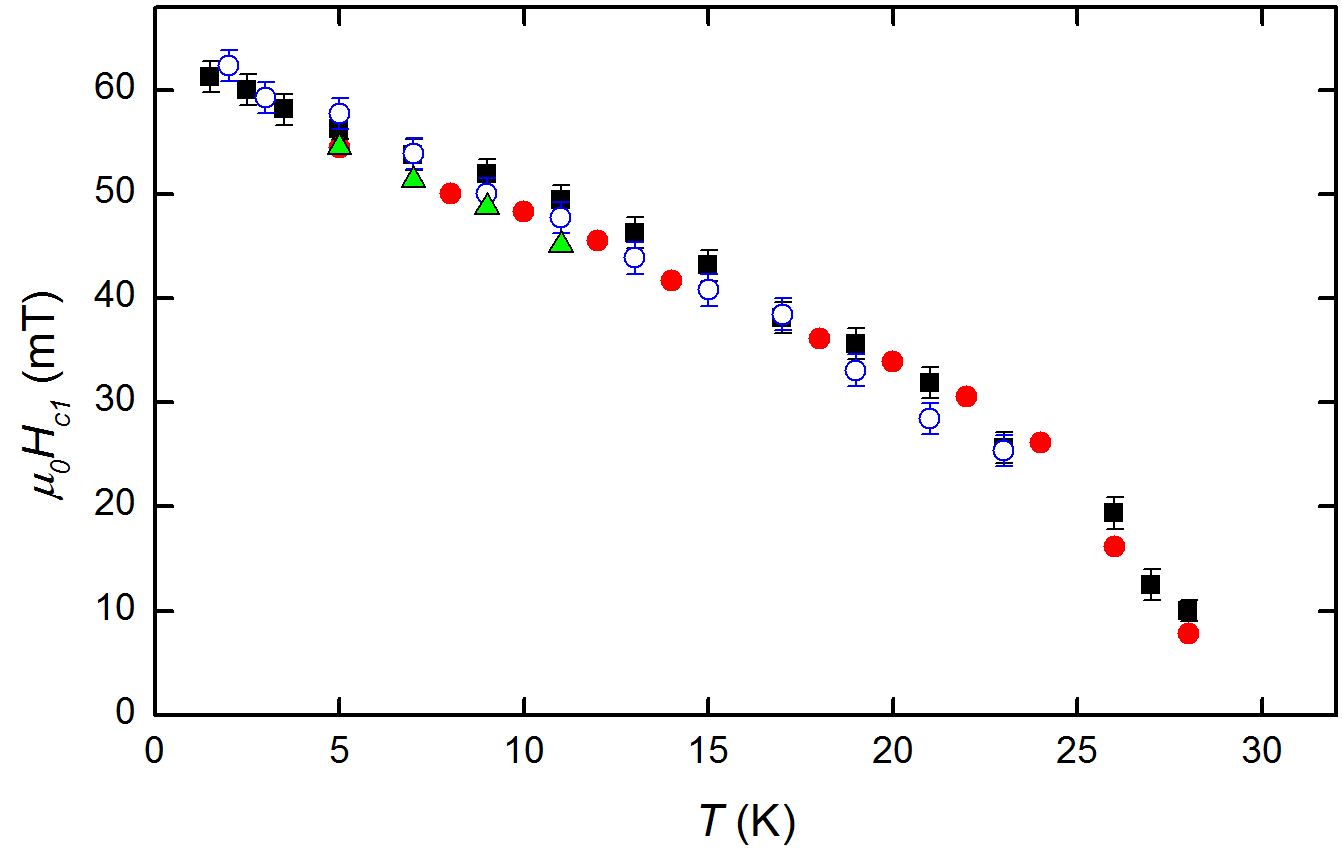
The temperature dependence of is found to be linear in at low temperature for all (figure 3), which again is indicative of a lack of surface barriers which tend to become stronger at low temperature causing an upturn in [16]. Extrapolating this linear behaviour to zero temperature gives us which is plotted versus in Fig. 4a. Surprisingly, instead of a dip in at the QCP predicted by equation 2 in conjunction with the observed behaviour of [9], there is instead a strong peak. To resolve this discrepancy we consider again the arguments leading to equation 2.
In general is determined from the vortex line energy which is composed of two parts [17],
| (3) |
The first, is the electromagnetic energy associated with the magnetic field and the screening currents which in the high approximation is given by
| (4) |
The second contribution arises from the energy associated with creating the normal vortex core . In high superconductors, is usually almost negligible and is accounted for by the additional constant 0.5 in equation 2. However, in superconductors close to a QCP we argue this may not be the case.
In Fig. 4b,c we use equations 3 and 4 to determine and . Away from the QCP, is approximately zero and so the standard theory accounts for well. However as the QCP is approached there is a substantial increase in as determined by from the corresponding increase in . We can check this interpretation by making an independent estimate of the core energy from the condensation energy which we estimate from the experimentally measured specific heat (see Methods). The core energy is then where is the effective core radius which may be estimated from the coherence length derived from measurements using Eq. 1. In Fig. 4 we see that has a similar dependence on as and is in approximate quantitative agreement if for all . Hence, this suggests that the observed anomalous increase in could be caused by the high energy needed to create a vortex core close to the QCP.
Discussion
In principle, the relative lack of enhancement in close to the QCP could be caused by impurity or multiband effects, although we argue that neither are likely explanations. Impurities decrease and in the extreme dirty limit , where is the electron mean-free-path [12]. Hence, even in this limit we would expect to increase with although not as strongly as in the clean case. Impurities increase and as the residual resistance increases close to [7] we would actually expect a larger increase in than expected from clean limit behaviour. dHvA measurements show that at least for the electron bands and for , which suggest that, in fact, our samples are closer to the clean limit.
To discuss the effect of multiple Fermi surface sheets on we consider the results of Gurevich [18] for two ellipsoidal Fermi surface sheets with strong interband pairing. This limit is probably the one most appropriate for BaFe2(As1-xPx)2 [19]. In this case for , were are the in-plane Fermi velocities on the two sheets. So if the velocity were strongly renormalized on one sheet only () then would be determined mostly by on the second sheet and hence would not increase with in accordance with our results. However, in this case the magnetic penetration depth , which will also be dominated by the Fermi surface sheet with the largest , would not show a peak at the QCP in disagreement with experiment [9]. In fact, the numerical agreement between the increase in with as determined by or specific heat, which in contrast to is dominated by the low Fermi velocity sections, rather suggests that the renormalization is mostly uniform on all sheets [10]. In the opposite limit, appropriate to the prototypic multiband superconductor MgB2, where intraband pairing dominates over interband, will be determined by the band with the lowest [18] and again an increase in should be reflected in . So these multiband effects cannot easily explain our results.
Another effect of multiband superconductivity is that it can modify the temperature dependence of such that it departs from the HW model. For example, in some iron-based superconductors a linear dependence of was found over a wide temperature range [20]. For BaFe2(As1-xPx)2 however, the coincidence between the HW extrapolation of the data close to and the pulsed field measurement of for for all , would appear to rule out any significant underestimation of . In Supplementary Figure 3 we show that for a sample with fits the HW theory for over the full temperature range. There is no reason why would underestimate by the same factor as the HW extrapolation. Even in cuprate superconductors where, unlike here, there is evidence for strong thermal fluctuation effects, has been shown to agree closely with in the low temperature limit [21]. The magnitude of the discrepancy between the behaviour of and discussed above (see figure 2) also makes an explanation based on an experimental underestimate of implausible.
Another possibility is that in heavy fermion superconductors the mass enhancement is often reduced considerably at high fields and so therefore could be reduced at fields comparable to . In BaFe2(As1-xPx)2 however, a significantly enhanced mass in fields greater than can be inferred from the dHvA measurements [10] and low temperature, high field, resistivity [22]. Although very close to the QCP the mass inferred from these measurements is slightly reduced from the values inferred from the zero field specific heat measurements [10] this cannot account for the lack of enhancement of shown in figure 2.
Our results are similar to the behaviour observed in another quantum critical superconductor, CeRhIn5. Here the pressure tuned QCP manifests a large increase in the effective mass as measured by the dHvA effect and the low temperature resistivity. is maximal at the QCP but displays only a broad peak, inconsistent with the mass enhancement shown by the other probes [23]. We should note that in this system at low temperatures is Pauli limited. However, close to , is always orbitally limited and as neither or are enhanced in BaFe2(As1-xPx)2 or CeRhIn5 [23], Pauli limiting can be ruled out as the explanation.
A comparison to the behaviour observed in cuprates is also interesting. Here two peaks in as a function of doping in YBa2Cu3O7-δ have been reported [21], which approximately coincide with critical points where other evidence suggests that the Fermi surface reconstructs. Quantum oscillation measurements indicate that increases close to these points [24], suggesting a direct link between and in the cuprates in contrast to our finding here for BaFe2(As1-xPx)2. However, by analysing the data in the same way as we have done here, it can be seen [25] that for YBa2Cu3O7-δ is independent of above and falls for below this value, reaching a minimum at . This suggest that at least the peak at higher is driven by the increasing gap value rather than a peak in , in agreement with our results here, and that the minimum in coincides with the doping where charge order is strongest at [26].
The lack of enhancement of in all these systems suggests a fundamental failure of theory. One possibility is that this may be driven by microscopic mixing of superconductivity and antiferromagnetism close to the QCP. In the vicinity of the QCP, antiferromagnetic order is expected to emerge near the vortex core region where the superconducting order parameter is suppressed [27, 28]. Such a field-induced antiferromagnetic order has been observed experimentally in cuprates [29, 30]. When the QCP lies beneath the superconducting dome, as in the case of BaFe2(As1-xPx)2 [9, 4], antiferromagnetism and superconductivity can coexist on a microscopic level. In such a situation, as pointed out in Ref. [28], the field-induced antiferromagnetism can extend outside the effective vortex core region where the superconducting order parameter is finite. Such an extended magnetic order is expected to lead to further suppression of the superconducting order parameter around vortices. This effect will enlarge the vortex core size, which in turn will suppress the upper critical field in agreement with our results. We would expect this effect to be a general feature of superconductivity close to an antiferromagnetic QCP, but perhaps not relevant to the behaviour close to in the cuprates.
To explain the results we postulate that the vortex core size is around 4 times larger than the estimates from . This is in fact expected in cases of multiband superconductivity or superconductors with strong gap anisotropy. In MgB2 [31, 32] and also in the anisotropic gap superconductor 2H-NbSe2 [33] the effective core size has been found to be around 3 times , similar to that needed to explain the behaviour here. BaFe2(As1-xPx)2 is known to have a nodal gap structure [34] which remains relatively constant across the superconducting dome [9] and so we should expect the core size to be uniformly enhanced for all . The peak in at the QCP is then, primarily caused by the fluctuation driven enhancement in the normal state energy, but the effect is magnified by the nodal gap structure of BaFe2(As1-xPx)2.
We expect the observed anomalous increase in to be a general feature of quantum critical superconductors as these materials often have nodal or strongly anisotropic superconducting gap structures and the increase in normal state energy is a general property close to a QCP. The relative lack of enhancement in also seems to be a general feature, which may be linked to a microscopic mixing of antiferromagnetism and superconductivity.
Methods
Sample growth and characterisation. BaFe2(As1-xPx)2 samples were grown using a self flux technique as described in Ref. [7]. Samples for this study were screened using specific heat and only samples with superconducting transition width less than 1 K were measured (see Supplementary Figure 1). To determine the phosphorous-concentration in the samples we carried out energy-dispersive x-ray analysis (EDX) on several randomly chosen spots on each crystal ( samples) or measured the -axis lattice parameter using x-ray diffraction ( samples) which scales linearly with . For some of the samples measured using high field torque magnetometry the measured de Haas-van Alphen frequency was also used to determine as described in Ref. [10].
Measurements of . Close to the upper critical field was determined using heat capacity. For this a thin film microcalorimeter was used [10]. We measured the superconducting transition at constant magnetic field up to 14 T (see Supplementary Figure 2). The midpoint of the increase in at the transition defines . At low temperatures () we used piezo-resistive microcantilevers to measure magnetic torque in pulsed magnetic field and hence determine the irreversibility field . The crystals used in the pulsed field study were the same as those used in Ref. [10] for the de Haas-van Alphen effect (except samples for ). By taking the difference between the torque in increasing and decreasing field we determined the point at which the superconducting hysteresis closes as (see figure 1(b)). For some compositions we measured in dc field over the full temperature range and found it to agree well with the HW model and also the low temperature measurements in pulsed field on the same sample (Supplementary figure 3). Our heat capacity measurements of close to are in good agreement with those of Ref. [35].
Measurements of . The measurements of the field of first flux penetration have been carried out using micro-Hall arrays. The Hall probes were made with either GaAs/AlGaAs heterostructures (carrier density ) or GaAs with a 1m thick silicon doped layer (concentration ). The latter had slightly lower sensitivity but proved more reliable at temperatures below 4 K. The measurements were carried out using a resistive magnet so that the remanent field during zero field cooling was as low as possible. The samples was warmed above after each field sweep and then cooled at a constant rate to the desired temperature.
When strong surface pinning is present may be pushed up significantly beyond . In this case there will also be a significant difference between the critical field measured at the edge and the centre of the sample (for example see Ref. [15]) and also a difference between the field where flux starts to enter the sample and the field at which it leaves. Some of our samples, also showing signs of inhomogeneity, such as wide superconducting transitions, showed this behaviour. An example is shown in supplementary figure 4. In this sample the sensor at the edge shows first flux penetration at mT whereas the value is times higher at the centre. For decreasing fields, the centre sensor shows a similar value to the edge sensor. All the samples reported in this paper showed insignificant difference between at the centre and the edge and also for increasing and decreasing fields. Hence, we conclude that in our samples is not significantly increased by pinning.
As our samples are typically thin platelets, demagnetisation effects need to be taken into account for measurement of . Although an exact solution to the demagnetisation problem is only possible for ellipsoids and infinite slabs, a good approximation for thin slabs has been obtained by Brandt [36]. Here is related to the measured , determined from using
| (5) |
where is the sample dimension along the field and perpendicular to the field.
All samples in this study had . To ensure that the determination of the effective field is independent of the specific dimension we have carried out multiple measurements on a single sample cleaved to give multiple ratios of . The results of this study (supplementary figure 5) show that determined by this method are independent of the aspect ratio of the sample. Furthermore, the samples used all had similar ratios (see Supplementary Table 1), and so any correction would not give any systematic errors as a function of .
Calculation of condensation energy. The condensation energy can be calculated from the specific heat using the relation
| (6) |
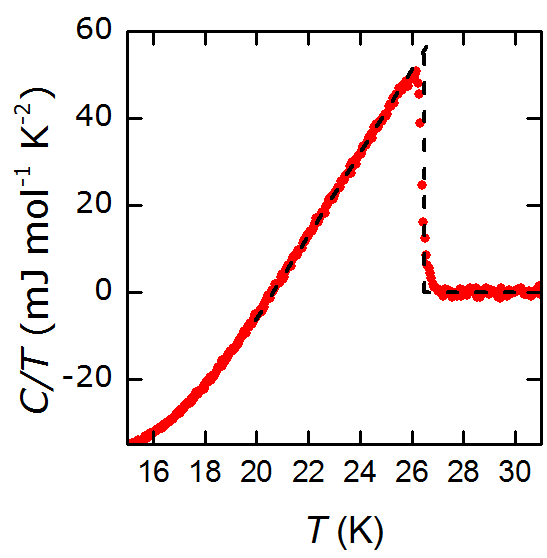
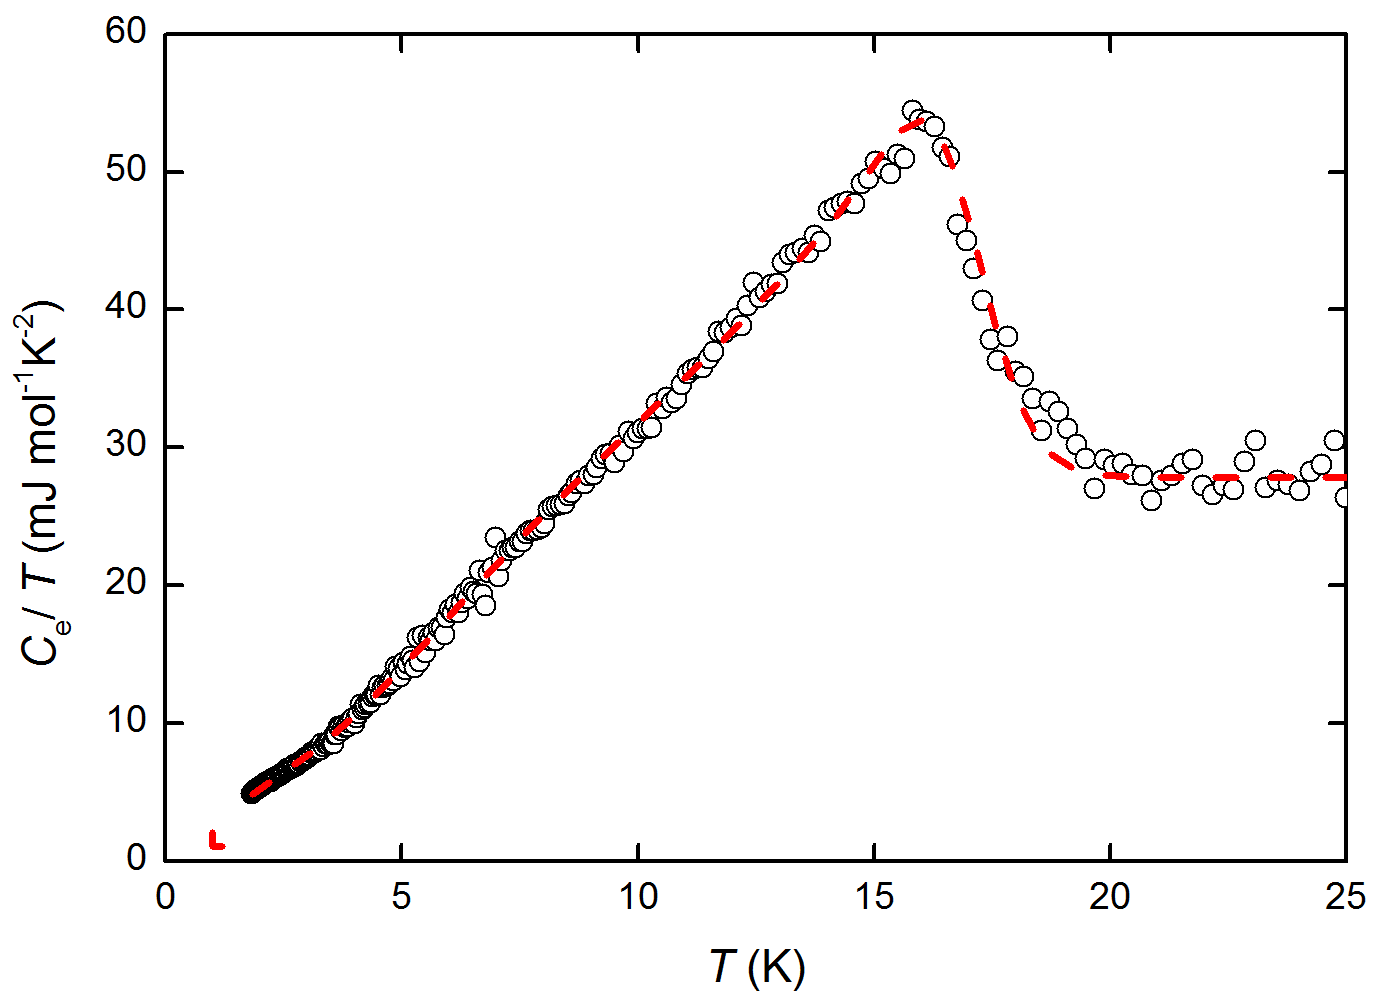
To calculate this we first measured a sample of BaFe2(As1-xPx)2 with , using a relaxation technique in zero field and T which is sufficient at this doping to completely suppress superconductivity and thus reach the normal state. We used this 14 T data to determine the phonon heat capacity and we then subtract this from the zero field data to give the electron specific heat of the sample. We then fitted this data to a phenomenological nodal gap, alpha model (with variable zero temperature gap) similar to that described in Ref. [37] (see supplementary figure 6). We then integrated this fit function using Eq. 6 to give for this value of . For lower values of (higher ) the available fields were insufficient to suppress superconductivity over the full range of temperature, so we assumed that the shape of the heat capacity curve does not change appreciably with but rather just scales with and the jump height at . This is implicitly assuming that the superconducting gap structure does not change appreciably with , which is supported by magnetic penetration depth measurements which show that normalised temperature dependence is relatively independent of [9]. With this assumption we can then calculate
where .
References
- [1] Taillefer, L. Scattering and Pairing in Cuprate Superconductors. Annu. Rev. Condens. Matter Phys. 1, 51-70 (2010).
- [2] Sachdev, S., Keimer, B. Quantum criticality. Phys. Today 64, 29-35 (2011).
- [3] Broun, D.M. What lies beneath the dome? Nature Phys. 4, 170-172 (2008).
- [4] Shibauchi, T., Carrington, A., Matsuda, Y. A quantum critical point lying beneath the superconducting dome in iron-pnictides. Annu. Rev. Condens. Matter Phys. 5, 113-135 (2014).
- [5] Shishido, H. et al. Evolution of the Fermi surface of BaFe2(As1-xPx)2 on entering the superconducting dome. Phys. Rev. Lett. 104 ,057008 (2010).
- [6] Klintberg, L.E. et al. Chemical Pressure and Physical Pressure in BaFe2(As1-xPx)2. J. Phys. Soc. Jpn. 79, 123706 (2010).
- [7] Kasahara, S. et al. Evolution from non-Fermi- to Fermi-liquid transport via isovalent doping in BaFe2(As1-xPx)2 superconductors. Phys. Rev. B 81, 184519 (2010).
- [8] Nakai, Y. et al. Unconventional superconductivity and antiferromagnetic quantum critical behavior in the isovalent-doped BaFe2(As1-xPx)2. Phys. Rev. Lett. 105, 107003 (2010).
- [9] Hashimoto, K. et al. A sharp peak of the zero-temperature penetration depth at optimal composition in BaFe2(As1-xPx)2. Science 336, 1554-1557 (2012).
- [10] Walmsley P. et al. Quasiparticle mass enhancement close to the quantum critical point in BaFe2(As1-xPx)2. Phys. Rev. Lett. 110, 257002 (2013).
- [11] Liang, R., Bonn, D.A., Hardy, W.N., Broun, D. Lower Critical Field and Superfluid Density of Highly Underdoped YBa2Cu3O6+x Single Crystals Phys. Rev. Lett. 94, 117001 (2005).
- [12] Shulga, S.V., Drechsler, Low Temperature Value of the Upper Critical Field of Isotropic Single Band Metals Journal of Low Temperature Physics 129, 93-102 (2002).
- [13] Serafin, A. et al. Anisotropic fluctuations and quasiparticle excitations in FeSe0.5Te0.5. Phys. Rev. B 82, 104514 (2010).
- [14] Helfand, E., Werthamer, N.R., Temperature and purity dependence of the superconducting critical field, II. Phys. Rev. 147, 288 (1966).
- [15] Okazaki, R. et al. Lower critical fields of superconducting PrFeAsO1-y single crystals. Phys. Rev. B 79, 064520 (2009).
- [16] Burlachkov, L., Yeshurun, Y., Konczykowski, M., Holtzberg, F. Explanation for the low-temperature behavior of in YBa2Cu3O7.Phys. Rev. 45, 8193 (1992).
- [17] Liang, R., Dosanjh, P., Bonn, D.A., Hardy, W.N., Berlinksky, A.J. Lower critical field in an ellipsoid-shaped single crystal. Phys. Rev. B 50, 4212 (1994).
- [18] Gurevich, A. Upper critical field and the Fulde-Ferrel-Larkin-Ovchinnikov transition in multiband superconductors Phys. Rev. B 82, 184504 (2010).
- [19] Hirschfeld, P.J., Korshunov, M.M, Mazin I.I. Gap symmetry and structure of Fe-based superconductors Rep. Prog. Phys. 74, 124508 (2011).
- [20] Yeninas, S et al. Upper critical field of isoelectron substituted SrFe2(As1-xPx)2, Phys. Rev. B 87 , 094503 (2013).
- [21] Grissonnanche, G et al. Direct measurement of the upper critical field in a cuprate superconductor, Nature Comm 5, 3280 (2014).
- [22] Analytis, J.G. et al. Transport near a quantum critical point in BaFe2(As1-xPx)2 Nature Phys. 10, 194-197 (2014).
- [23] Knebel, G., Aoki, D., Brison, J.P., Flouquet, J. The Quantum Critical Point in CeRhIn5: A Resistivity Study. J. Phys. Soc. Japan 77, 114704 (2008).
- [24] Sebastian, S.E. et al. Metal - insulator quantum critical point beneath the high- superconducting dome. Proc. Nat.Acad. Sci. 107, 6175 - 6179 (2010).
- [25] Tafti, F.F. et al. Nernst effect in the electron-doped cuprate superconductor Pr2-xCexCuO4 : Superconducting fuctuations, upper critical field , and the origin of the dome. Preprint at http://arxiv.org/abs/1405.6248 (2014).
- [26] Huecker, M. et al. Competing charge, spin, and superconducting orders in underdoped YBa2Cu3Oy. Preprint at http://arxiv.org/abs/1405.7001 (2014).
- [27] Demler, E., Hanke, W., Zhang, S.C. SO(5) theory of antiferromagnetism and superconductivity. Rev. Mod. Phys. 76, 909 (2004).
- [28] Zhang, Y., Demler, E., Sachdev, S. Competing orders in a magnetic field: Spin and charge order in the cuprate superconductors. Phys. Rev. B 66, 094501 (2002).
- [29] Lake, B. et al. Antiferromagnetic order induced by an applied magnetic feld in a high-temperature superconductor.2002, Nature 415, 299-302 (2002).
- [30] Kakuyanagi, K., Kumagai, K., Matsuda, Y., Hasegawa, Y. Antiferromagnetic vortex core in Tl2Ba2CuO6+δ studied by nuclear magnetic resonance. Phys. Rev. Lett. 90, 197003 (2003).
- [31] Eskildsen, M.R. et al. Vortex imaging in the pi band of magnesium diboride. Phys. Rev. Lett. 89 187003 (2002).
- [32] Koshelev, A.E., Golubov, A.A. Mixed state of a dirty two-band superconductor: Application to MgB2. Phys. Rev. Lett. 90, 177002 (2003).
- [33] Hartmann, U., Golubov, A.A., Drechsler, T., Kuprivanoc, M.Y., Heiden, C. Measurement of the vortex-core radius by scanning tunneling microscopy. Physica B 194-195, 387-388 (1994).
- [34] Hashimoto, K. et al. Line nodes in the energy gap of superconducting BaFe2(As1-xPx)2 single crystals as seen via penetration depth and thermal conductivity. Phys. Rev. B 81, 220501(R) (2010).
- [35] Chaparro, C et al. Doping dependence of the specific heat of single-crystal BaFe2(As1-xPx)2 Phys. Rev. B85, 184525 (2012).
- [36] Brandt, E.H. Irreversible magnetization of pin-free type-II superconductors. Phys. Rev. B 60, 11939 (1999).
- [37] Taylor OJ, Carrington A, Schlueter JA. Specific heat measurements of the gap structure of the organic superconductors -(ET)2Cu[N(CN)2]Br and -(ET)2Cu(NCS)2. Phys. Rev. Lett. 99, 057001 (2007).
Acknowledgements
We thank Igor Mazin and Georg Knebel for useful discussions, and A. M. Adamska for experimental help. This work was supported by the Engineering and Physical Sciences Research Council (Grant No. EP/H025855/1), EuroMagNET II under the EU Contract No. 228043, National Physical Laboratory Strategic Research Programme, and KAKENHI from JSPS.
Author contributions
A.C. and C.Putzke. conceived the experiment. C.Putzke performed the high field torque measurements (with D.V., C.Proust and S.B.) and the Hall probe measurements. P.W. and L.M. performed heat capacity measurements. The Hall probe arrays were fabricated by J.D.F., P.S., H.E.B and D.A.R. Samples were grown and characterised by S.K., Y. Mizukami, T.S. and Y.Matsuda. The manuscript was written by A.C. with input from C.Putzke, C. Proust, P.W., L.M., J.D.F, T.S and Y. Matsuda.
Supplementary information


| Sample | (m) | (m) | ||
|---|---|---|---|---|
| C19 | 0.29 | 0.01 | 11 | 149 |
| C24a | 0.30 | 0.01 | 27 | 360 |
| C24b | 0.30 | 0.01 | 18 | 360 |
| C24c | 0.30 | 0.01 | 18 | 170 |
| C2a | 0.31 | 0.01 | 28 | 300 |
| C21 | 0.34 | 0.01 | 20 | 255 |
| 0p3B | 0.35 | 0.01 | 48 | 115 |
| C1 | 0.36 | 0.01 | 35 | 269 |
| C7a | 0.39 | 0.02 | 17 | 260 |
| C9 | 0.47 | 0.02 | 40 | 300 |
| 0p6a | 0.55 | 0.01 | 48 | 240 |