Low-frequency High-resolution Radio Observations of the TeV-emitting Blazar SHBL J001355.9185406
Abstract
Context. In the framework of the unification scheme of radio-loud active galactic nuclei, BL Lac objects and quasars are the beamed end-on counterparts of low-power (FR I) and high-power (FR II) radio galaxies, respectively.
Aims. Some BL Lacs have been found to possess the FR II-type large-scale radio morphology, suggesting that the parent population of BL Lacs is a mixture of low- and high-power radio galaxies. This seems to apply only to ‘low frequency-peaked’ BL Lacs, since all the ‘high frequency-peaked’ BL Lacs studied so far were shown to host exclusively the FR I-type radio jets. While analyzing the NVSS survey maps of the TeV detected BL Lacs, we have however discovered that the high frequency-peaked object SHBL J001355.9185406 is associated uniquely with the one-sided, arcmin-scale, and edge-brightened jet/lobe-like feature extending to the south-west from the blazar core.
Methods. In order to investigate in detail the large-scale morphology of SHBL J001355.9185406, we have performed low-frequency and high-resolution observations of the source at 156, 259 and 629 MHz using the Giant Metrewave Radio Telescope.
Results. Our analysis indicates that no diffuse arcmin-scale emission is present around the unresolved blazar core, and that the arcmin-scale structure seen on the NVSS map breaks into three distinct features unrelated to the blazar, but instead associated with background AGN.
Conclusions. The upper limits for the extended radio halo around the TeV-emitting BL Lac object SHBL J001355.9185406 read as at MHz. The fact that the integrated radio spectrum of the unresolved blazar core is flat down to 156 MHz indicates that a self-similar character of the jet in the source holds up to relatively large distances from the jet base.
Key Words.:
Galaxies: active — BL Lacertae objects: individual: SHBL J001355.9185406 —- Galaxies: jets — Radio continuum: galaxies1 Introduction
Blazars constitute the most extreme class of active galactic nuclei (AGN), for which the total radiative output is dominated by a Doppler-boosted and highly variable emission of a nuclear relativistic jet observed at a small viewing angle. The blazar family includes flat-spectrum radio-loud quasars (FSRQs) and BL Lacertae (BL Lac) objects. In the framework of the “unified scheme” of AGN, powerful radio galaxies of the Fanaroff-Riley morphological type II (FR IIs; see, Fanaroff & Riley 1974) constitute the parent population of FSRQs, while low-power radio galaxies of the Fanaroff-Riley morphological type I (FR Is) are considered to be “misaligned” BL Lacs (Barthel 1989; Urry & Padovani 1995; Xu et al. 2009).
High-dynamic range radio imaging of BL Lac objects at GHz frequencies often reveals the presence of a diffuse extended radio emission, with the integrated luminosity exceeding, in several cases, the FR I/FR II divide. We note that this borderline scales with the optical luminosity of the host as , with the normalization W Hz-1 for the absolute isophotal magnitude of the host galaxy measured to 24.5 magnitudes per arcsec2 in the rest-frame of a source (Ledlow & Owen 1996). This may indicate that the parent population of BL Lac objects is a mixture of FR I and FR II type galaxies (see, e.g., Cassaro et al. 1999; Rector & Stocke 2001; Landt & Bignall 2008; Kharb et al. 2010). Therefore, a careful investigation of the extended diffuse radio emission in BL Lacs is of importance for the models relating the AGN accretion power and jet luminosity in general, and the blazar population studies in particular (e.g., Blandford & Payne 1982; Rawlings & Saunders 1991; Ghisellini et al. 2011).
The high frequency-peaked BL Lacs (HBLs), i.e. blazars with synchrotron peak frequencies Hz (see the discussion in Abdo et al. 2010 and references therein), dominate the population of extragalactic TeV emitters111http://tevcat.uchicago.edu/. These sources, unlike the low frequency-peaked BL Lacs (LBLs; synchrotron peak frequencies Hz), seem to be associated strictly with FR I-type large-scale radio structures (e.g., Kharb et al. 2010), and to form a relatively distinct sub-class of blazars with respect to the jet physical properties (e.g., Tavecchio et al. 2010). Also, no superluminal velocities have been detected in the TeV-emitting HBLs on milli-arcsec scales till now, despite several dedicated observational programs (e.g., Piner et al. 2010 and references therein). Such apparent superluminal velocities are typical for FSRQs and not rare for LBLs.
SHBL J001355.9185406 (J2000.0 R.A. , Dec. ; redshift according to Jones et al. 2009) is a peculiar example of an HBL. This source was listed in a catalog of extremely high X-ray–to–radio flux ratio targets in the multi-frequency ‘Sedentary Survey’ of HBLs performed by Giommi et al. (2005). Its keV X-ray flux is erg s-1 cm-2, and the corresponding MHz radio flux spectral density is mJy (see, Condon et al. 1998). Very recently, this source has been detected at the level of of the flux of the Crab nebula above 300 GeV by the High Energy Stereoscopic System (H.E.S.S.; Abramowski et al. 2013). The analysis of the Fermi Large Area Telescope (Fermi-LAT) data revealed a faint and flat-spectrum counterpart of SHBL J001355.9185406 at the GeV photon energies, with the integrated photon flux above MeV of ph cm-2 s-1 and the photon index of (Sanchez & Fegan 2010). At lower frequencies, the discussed object was also reported as a bright and variable NIR/optical emitter. In particular, the NIR flux of SHBL J001355.9185406 determined in 2010 was about 0.7 mag brighter than that previously published in the 2MASS survey (Carrasco et al. 2010). The corresponding flux increase imply the jet origin of the NIR continuum.
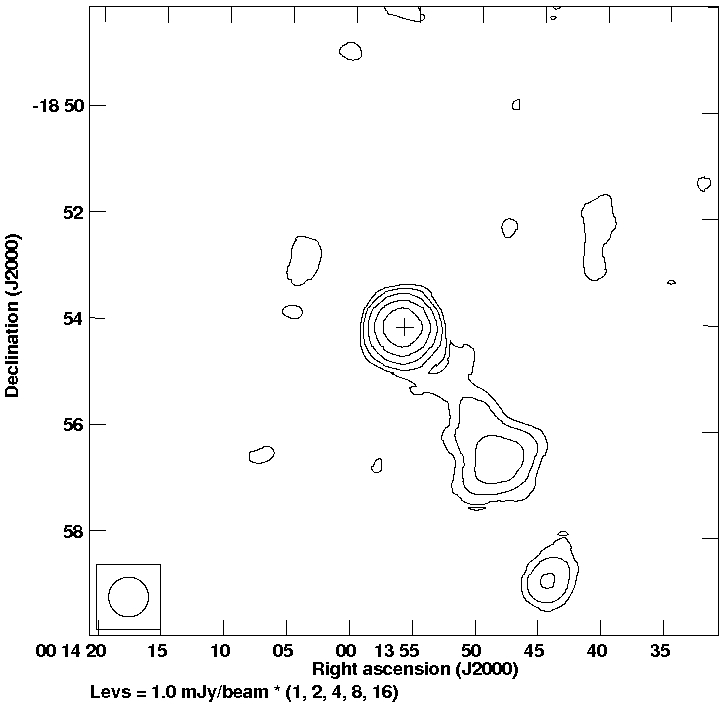
The peculiarity of the SHBL J001355.9185406 is related however to its large-scale radio structure which have been found when examining the archival radio National Radio Astronomy Observatory (NRAO) Very Large Array (VLA) Sky Survey (NVSS; Condon et al. 1998) maps of the TeV-detected BL Lacs. This structure, shown in Figure 1, consists of a compact core component, as expected for a blazar, but also of a one-sided and elongated lobe/jet-like feature extending to the south-west from the nucleus. At the redshift of the source (luminosity distance of Mpc for the flat cosmology with km sec-1 Mpc-1, and ), the 33 extension of the lobe corresponds to the physical (projected) size of kpc and the MHz flux mJy corresponds to the lobe’s monochromatic luminosity of erg s-1. The derived extended luminosity is therefore comfortably low as for the low-power blazar of the HBL type, yet the morphology of the giant lobe is striking for two reasons.
First, the lobe is clearly edge-brightened, and hence the whole large-scale radio structure of SHBL J001355.9185406 resembles more an FR II-type object. Second, the extended structure in the discussed source is clearly one-sided. This is not expected for the large-scale structures in radio-loud AGN in general, regardless on their Fanaroff-Riley type, since the lobes’ expansion velocities on scales of tens and hundreds of kpc are expected to be sub-relativistic only. In other words, the Doppler (and time-travel) effects cannot be easily blamed for the apparent lack of the counter-lobe in SHBL J001355.9185406 (but see in this context Stawarz 2004 and Bagchi et al. 2007). In order to investigate this issue in more detail, we performed deep and high-resolution radio observations of SHBL J001355.9185406 at low frequencies. The results of the analysis are presented below.
2 Observations and Data Analysis
Observations were carried out using the Giant Metrewave Radio Telescope (GMRT) in three frequency bands, namely 156, 259 and 629 MHz, the latter two being taken in dual frequency mode (Swarup 1991). Data were recorded with an integration time of 8 seconds with the available frequency band divided into 256 channels, following the usual protocol of observing flux and phase calibrator interlaced with observation on the source. At the beginning and end of the observing run, flux calibrator 3C 48 was observed for about 15 min. The phase calibrator J0025260, was observed every 25 min for 4-5 min. Table 1 gives the summary of the observations. The data reduction was carried out following standard calibration and reduction procedures in the Astronomical Image Processing System (AIPS). Data were edited for strong radio frequency interference (RFI) and then standard flux and phase calibration were applied to the source. In addition to the newly obtained GMRT data, we have also analyzed the archival 8434 MHz VLA data for SHBL J001355.9185406 in a standard fashion as described below.
| BW | Date | Time | Pol. | Flux cal. | Phase cal. | HPBW | Synth. beam | PA | Dyn. range | ||
|---|---|---|---|---|---|---|---|---|---|---|---|
| (MHz) | (MHz) | (dd.mm.yy) | (hr) | name(flux) | name(flux) | (arcmin) | (arcsec2) | (deg) | (mJy/b) | (peak/rms err.) | |
| (1) | (2) | (3) | (4) | (5) | (6) | (7) | (8) | (9) | (10) | (11) | (12) |
| 156 | 16 | 29.08.11 | 6 | RR,LL | 3C 48(65) | J0025260(20) | 186 | 20.3 13.0 | 23.3 | 2.0 | 31 |
| 259∗ | 6.5 | 01.09.11 | 6 | LL | 3C 48(47) | J0025260(18) | 116 | 15.1 10.5 | 37.4 | 0.09 | 60 |
| 629∗ | 32 | 01.09.11 | 6 | RR | 3C 48(30) | J0025260(14) | 45 | 6.4 4.1 | 32.9 | 0.07 | 600 |
| 8434† | 50 | 06.06.98 | 0.08 | RR,LL | 3C 48(3.3) | J0110076(0.55) | 6 | 0.48 0.28 | 31.07 | 0.09 | 150 |
Columns: (1) central radio frequency of observation (∗ indicates a dual frequency mode; † archival VLA data obtained in AnB configuration in 2 IF); (2) total bandwidth (BW) of observation; (3) date of observation; (4) time spent on the source excluding calibration overheads; (5) polarization; (6) the flux calibrator used in the observation (flux density of the calibrator in Jy); (7) the phase calibrator used during the observation (flux density of the calibrator in Jy); (8) half power beam width (HPBW ; where is the wavelength of observation and D is an antenna diameter); (9) synthesized beam achieved; (10) position angle (PA) of the restoring beam; (11) rms error in the map; (12) dynamic range achieved.
The Baars et al. (1977) absolute flux density scale was used to determine flux densities of the flux calibrators, phase calibrator, and the source. The calibrated data were channel collapsed after the bandpass calibration using the phase calibrator, and the deconvolved images were made using the task ‘IMAGR’. To account for wide-field imaging with non-coplanar baselines, polyhedron imaging was used in ‘IMAGR’ (Cornwell & Perley 1992), where the field of view is subdivided into a number of smaller fields (facets). These were , , and at 629, 259 and 156 MHz, respectively, facets covering the primary beam up to the half-power beam width (HPBW). Several rounds of phase-based self-calibration were performed iteratively, by choosing point sources such that the flux density within one synthesized beam is more than 5. Final maps were made from the full (u,v) coverage and the UV-data were weighted using Briggs robust weighting of 0 (Briggs 1995). The final images were then combined to reconstruct the sky using the task ‘FLATN’ and the ‘FLATNed’ image was then corrected for the primary beam222http://ncra.tifr.res.in/ngk/primarybeam/beam.html of the antenna using the task ‘PBCOR’.
The uncertainties in the estimated flux densities of the source (obtained using ‘TVSTAT’ task) depend on the rms noise in the map as well as on the errors associated with uncalibrated system temperature (Tsys) variations. These were taken to be 5% at 629 and 259 MHz, and 8% at 156 MHz. The final error on the flux density was calculated using the expression:
| (1) |
where S is the integrated flux density of the source, is the rms error due to the uncalibrated system temperature, is the rms error in the map, is the area of source in pixels, and is the beam area in pixels.
The expected thermal noise values are about 0.1, 0.09 and 0.02 mJy/beam at 156, 259 and 629 MHz, respectively, for our observational set-up (Table 1). However, the rms noise values achieved are about 20, 10 and 5 times worse, as a considerable amount of the GMRT bad data was flagged during the reduction process. For the VLA observations, the rms noise is close to the expected thermal noise 0.08 mJy/beam (Table 1).
3 Results
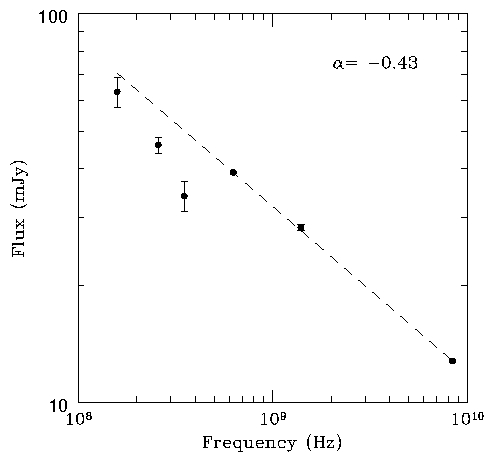
The spectral index (defined here as ) for the unresolved core of SHBL J001355.9185406 has been evaluated using the peak flux values of the blazar obtained using the task ‘JMFIT’ from the 156, 259 and 629 MHz GMRT maps, along with the archival 352 MHz data from the Westerbork In the Southern Hemisphere (WISH) survey (De Breuck et al. 2002), the 1400 MHz (NVSS survey) data, and the VLA data at 8434 MHz. By applying the weighted linear regression analysis we find (see Figure 2). The low-frequency radio spectrum seems to be even flatter than that, with (see Table 2), as indeed expected for a BL Lac object (e.g., Angel & Stockman 1980; Cavallotti et al. 2004).
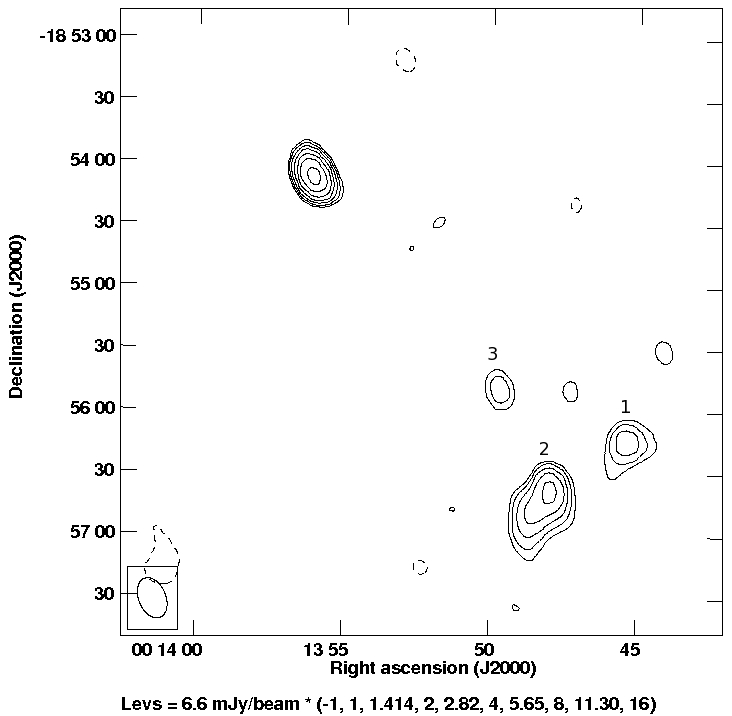
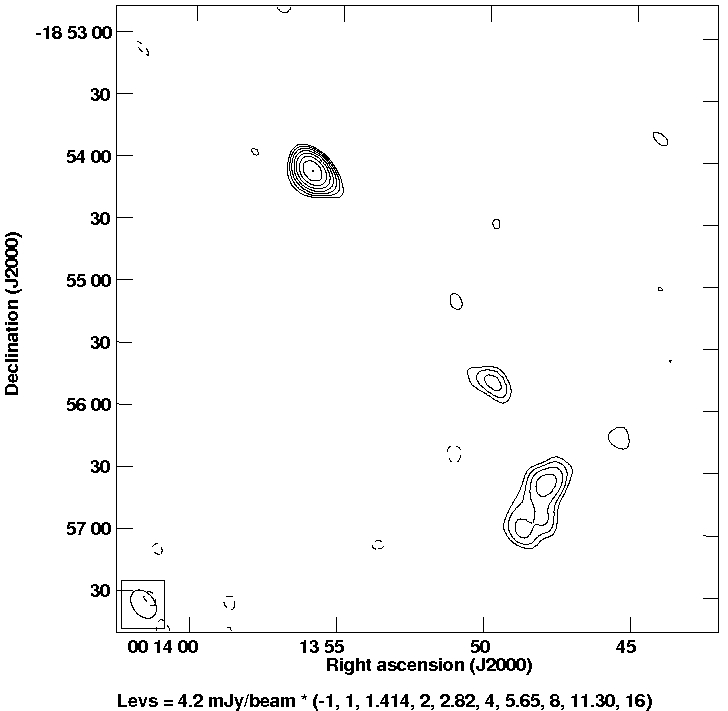
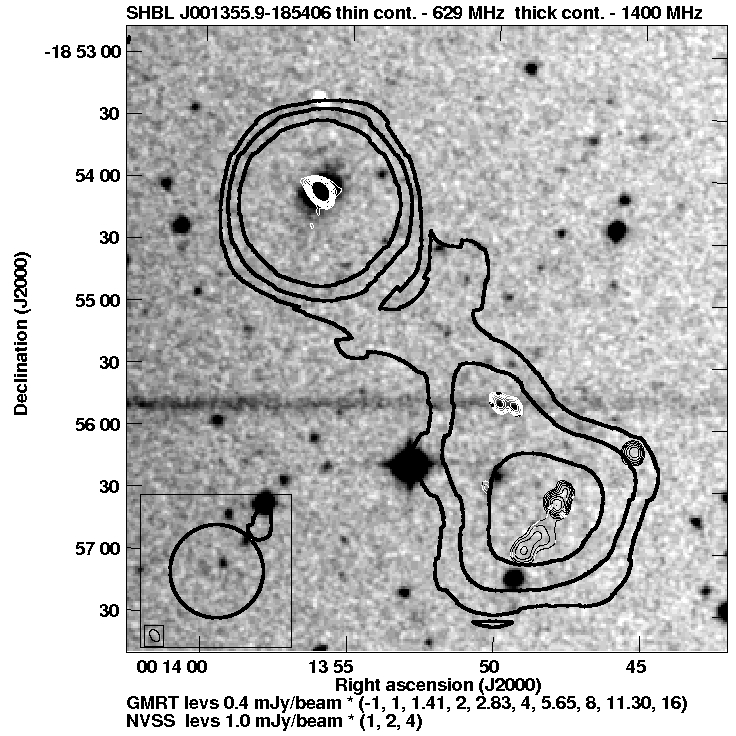
The full-resolution GMRT maps of the entire field of interest are presented in Figure 3-5. As shown, the lobe-like structure seen to the south-west from the blazar core in the NVSS image breaks into three distinct features, marked as Source 1, Source 2 and Source 3 in Figure 3. Table 2 gives the integrated flux densities for the unresolved blazar core and the above mentioned sources. Detailed morphologies of all the detected objects are best displayed in the 629 MHz map, which is the best quality map out of the three obtained GMRT maps (Table 1); the corresponding Figure 5 includes also the low-resolution 1400 MHz contours for comparison, as well as the overlaid DSS -band image. We note that at 8434 MHz map, only the point-like blazar is detected, hence the corresponding image is not presented here.
Figure 6 shows the spectral index map between 156 and 629 MHz frequencies. When generating this map, the 629 MHz images were made with 13 uvrange (equal to the uvrange obtained at 156 MHz with the GMRT). This ensured the resultant synthesized beam in the 629 MHz map close to that of 156 MHz, (although not exactly equal due to the dependence on the filling of the visibility plane; e.g., Cornwell et al. 1999). Next the two maps were convolved to the common circular beam as large as the largest axis beam at 156 MHz (i.e., 21″). As shown in the resulting figure, and already mentioned above, the unresolved blazar core displays a flat spectrum with ; the three newly resolved structures to the south-west are however characterized by steep spectra, (see Table 2).
| Source | 156 MHz | 259 MHz | 629 MHz | 8434 MHz | |
|---|---|---|---|---|---|
| flux (err.) | flux (err.) | flux (err.) | flux (err.) | ||
| (1) | (2) | (3) | (4) | (5) | (6) |
| Blazar | 55(6.0) | 53(3.7) | 45(2.2) | 15(2.3) | 0.1(0.1) |
| Source 1 | 29(5.3) | 5 (1.6) | 4.0(0.3) | – | 1.4(0.2) |
| Source 2 | 62(7.5) | 47(4.0) | 17(1.0) | – | 0.9(0.1) |
| Source 3 | 11(3.4) | 15(2.4) | 5.8(0.4) | – | 0.5(0.3) |
Columns :(1) source name ; (2)–(5) integrated radio flux densities and the errors in parentheses at 156 MHz, 259 MHz, 629 MHz and 8434 MHz; (6) integrated spectral indices between 156–629 MHz for the sources mentioned in the text.
The GMRT has a hybrid configuration, with 14 out of 30 antennas located in 1 km square area (known as the central square). The typical antenna spacing available in the central square with the GMRT is about m, this assures sensitivity to sources with angular sizes up to , , and at 156, 259 and 629 MHz, respectively, even with the snap shot observations. The half power beam width (HPBW), or, the primary beam at 156, 259 and 629 MHz is about 186′, 116′ and 45′, respectively (Table 1). Since the extension of the lobe-like structure to the south-west from the blazar core is about 33, the entire feature should be well within the primary beam at each frequency, and the availability of multiple short spacing in our observations ensures the measurements of the extended flux. Therefore, we do not expect any missing flux in our observations.
We note, however, that the non-detection of the extended emission just near the blazar core as seen in the NVSS map (Figure 1) could be due to the limited sensitivity achieved in our observations (see, Table 1). To investigate this issue in more detail, we computed the 1400 MHz expected flux density per 5′′ beam (as this is the typical synthesized beam achieved at 629 MHz using the GMRT) near the blazar core. Assuming a uniform flux density in the NVSS map in this region, we next evaluated the flux density per beam at 629 MHz assuming the spectral index . The extrapolated flux density per beam at 629 MHz comes out to be 0.03 mJy, much below the rms error achieved in our observations. Hence, it is possible that the extended structure seen in the NVSS map just near the blazar core is real, but only below the sensitivity limit of our high-resolution maps at low frequencies. Still, the radio morphologies of the sources detected to the south-west of blazar implies that the brightest part of the large-scale NVSS structure is unrelated to the blazar. Source 1 can be easiliy classified as a ultra-steep spectrum source (e.g., De Breuck et al. 2000, see Table 2, Figure 6) while Source 2 has a typical FR II radio morphology (e.g., Miley 1980; Hardcastle 2008). Source 3 breaks into two point-like sources, each with an optical counterpart (see Figure 5). This strongly suggests that the detected features are related to distant radio galaxies, although the lack of any obvious optical counterparts (for Sources 1 and 2), or optical spectra (Source 3) precludes us from making any definite statements in this respect.

4 Conclusions
In our study presented here, we investigated in detail large-scale radio morphology of the TeV-detected blazar SHBL J001356185406 which, on the low-resolution NVSS map, appears to be of the FR II type. High-sensitivity and high-dynamic range (Table 1) observations (which do not suffer from a missing flux; see Section 3) were made using the GMRT at low frequencies of 156, 259 and 629 MHz. Our analysis indicated that: (1) the integrated radio spectral index is flat down to 156 MHz for the blazar core (Figure 2); (2) no diffuse arcmin-scale emission is present around the unresolved blazar core (see Figures 3–5); (3) the 33-long, lobe/jet-like structure extending to the south-west from the blazar core on the NVSS map breaks into three distinct, steep-spectrum radio features, unrelated to the blazar but instead associated most likely with background AGN.
As a corollary to this study we point out that the observations presented here are rather unique, since very low-frequency, high-resolution and high-dynamic range studies of TeV detected HBLs are particularly sparse. The new data allow us to constrain the upper limits for the extended radio halo around the blazar as at 156 MHz, at 259 MHz, and at 629 MHz of the core emission. This is agreement with the early VLA studies of large-scale structures of BL Lacs at GHz frequencies by Ulvestad & Johnston (1984) and Ulvestad & Antonucci (1986), who found that only a few of the objects from the analyzed samples possess any arcminute-scale structures with total fluxes exceeding of the core emission.
The another interesting result of our study is that the radio spectral index of the SHBL J001356185406 core remains flat down to 156 MHz, with no dramatic curvature. Flat spectra (indices ) of relativistic jets observed at small viewing angles are widely believed to arise due to a superposition of self-absorbed spectra of different parts of an outflow with conserved magnetic flux and maintained power-law spectrum of the emitting electrons (Blandford & Königl, 1979). The fact that in the case of the SHBL J001356185406 core we do not see any spectral turnover down to 156 MHz indicates therefore that a self-similar character of the jet in the source holds up to relatively large distances from the jet base.
Acknowledgements.
We thank the anonymous referee for the helpful suggestions. We thank the staff of the GMRT that made these observations possible. GMRT is run by the National Centre for Radio Astrophysics of the Tata Institute of Fundamental Research. This research has made use of NASA/IPAC Extragalactic Database (NED), which is operated by the Jet Propulsion Laboratory, California Institute of Technology, under contract with National Aeronautics and Space Administration. The National Radio Astronomy Observatory is a facility of the National Science Foundation operated under cooperative agreement by Associated Universities, Inc. This work was supported by the Polish National Science Centre through the grant DEC-2012/04/A/ST9/00083. M.J. is supported by Polish National Science Center grant DEC-2013/09/B/ST9/00599.References
- Abdo et al. (2010) Abdo, A. A., Ackermann, M., Agudo, I., et al. 2010, ApJ, 716, 30
- Abramowski et al. (2013) Abramowski, A., Acero, F., Aharonian, F., et al. 2013, A&A, 554, A72
- Angel & Stockman (1980) Angel, J. R. P. & Stockman, H. S. 1980, ARA&A, 18, 321
- Baars et al. (1977) Baars, J. W. M., Genzel, R., Pauliny-Toth, I. I. K., & Witzel, A. 1977, A&A, 61, 99
- Bagchi et al. (2007) Bagchi, J., Gopal-Krishna, Krause, M., & Joshi, S. 2007, ApJ, 670, L85
- Barthel (1989) Barthel, P. D. 1989, ApJ, 336, 606
- Blandford & Königl (1979) Blandford, R. D. & Königl, A. 1979, ApJ, 232, 34
- Blandford & Payne (1982) Blandford, R. D. & Payne, D. G. 1982, MNRAS, 199, 883
- Briggs (1995) Briggs, D. S. 1995, High Fidelity Interferometric Imaging: Robust Weighting and NNLS Deconvolution, PhD thesis, New Mexico Institute of Mining Technology, Socorro, NM
- Carrasco et al. (2010) Carrasco, L., Carramiñana, A., Recillas, E., et al. 2010, The Astronomer’s Telegram, 3023, 1
- Cassaro et al. (1999) Cassaro, P., Stanghellini, C., Bondi, M., et al. 1999, A&AS, 139, 601
- Cavallotti et al. (2004) Cavallotti, F., Wolter, A., Stocke, J. T., & Rector, T. 2004, A&A, 419, 459
- Condon et al. (1998) Condon, J. J., Cotton, W. D., Greisen, E. W., et al. 1998, AJ, 115, 1693
- Cornwell et al. (1999) Cornwell, T., Braun, R., & Briggs, D. S. 1999, in Astronomical Society of the Pacific Conference Series, Vol. 180, Synthesis Imaging in Radio Astronomy II, ed. G. B. Taylor, C. L. Carilli, & R. A. Perley, 151
- Cornwell & Perley (1992) Cornwell, T. J. & Perley, R. A. 1992, A&A, 261, 353
- De Breuck et al. (2002) De Breuck, C., Tang, Y., de Bruyn, A. G., Rottgering, H., & van Breugel, W. 2002, VizieR Online Data Catalog, 8069, 0
- De Breuck et al. (2000) De Breuck, C., van Breugel, W., Röttgering, H. J. A., & Miley, G. 2000, A&AS, 143, 303
- Fanaroff & Riley (1974) Fanaroff, B. L. & Riley, J. M. 1974, MNRAS, 167, 31P
- Ghisellini et al. (2011) Ghisellini, G., Tavecchio, F., Foschini, L., & Ghirlanda, G. 2011, MNRAS, 414, 2674
- Giommi et al. (2005) Giommi, P., Piranomonte, S., Perri, M., & Padovani, P. 2005, A&A, 434, 385
- Hardcastle (2008) Hardcastle, M. J. 2008, in Astronomical Society of the Pacific Conference Series, Vol. 386, Extragalactic Jets: Theory and Observation from Radio to Gamma Ray, ed. T. A. Rector & D. S. De Young, 46
- Jones et al. (2009) Jones, D. H., Read, M. A., Saunders, W., et al. 2009, MNRAS, 399, 683
- Kharb et al. (2010) Kharb, P., Lister, M. L., & Cooper, N. J. 2010, ApJ, 710, 764
- Landt & Bignall (2008) Landt, H. & Bignall, H. E. 2008, MNRAS, 391, 967
- Ledlow & Owen (1996) Ledlow, M. J. & Owen, F. N. 1996, AJ, 112, 9
- Miley (1980) Miley, G. 1980, ARA&A, 18, 165
- Piner et al. (2010) Piner, B. G., Pant, N., & Edwards, P. G. 2010, ApJ, 723, 1150
- Rawlings & Saunders (1991) Rawlings, S. & Saunders, R. 1991, Nature, 349, 138
- Rector & Stocke (2001) Rector, T. A. & Stocke, J. T. 2001, AJ, 122, 565
- Sanchez & Fegan (2010) Sanchez, D. & Fegan, S. 2010, The Astronomer’s Telegram, 3014, 1
- Stawarz (2004) Stawarz, Ł. 2004, ApJ, 613, 119
- Swarup (1991) Swarup, G. 1991, in Astronomical Society of the Pacific Conference Series, Vol. 19, IAU Colloq. 131: Radio Interferometry. Theory, Techniques, and Applications, ed. T. J. Cornwell & R. A. Perley, 376–380
- Tavecchio et al. (2010) Tavecchio, F., Ghisellini, G., Ghirlanda, G., Foschini, L., & Maraschi, L. 2010, MNRAS, 401, 1570
- Ulvestad & Antonucci (1986) Ulvestad, J. S. & Antonucci, R. R. J. 1986, AJ, 92, 6
- Ulvestad & Johnston (1984) Ulvestad, J. S. & Johnston, K. J. 1984, AJ, 89, 189
- Urry & Padovani (1995) Urry, C. M. & Padovani, P. 1995, PASP, 107, 803
- Xu et al. (2009) Xu, Y.-D., Cao, X., & Wu, Q. 2009, ApJ, 694, L107