Dense gas tracers and star formation laws in active galaxies: APEX survey of HCN =43 HCO=43, and CS =76
Abstract
We report CS =76, HCN =43, and HCO=43 observations in 20 nearby star-forming galaxies with the Acatama Pathfinder EXperiment 12-m telescope. Combined with 4 CS, 4 HCN, and 3 HCO+ detections in literature, we probe the empirical link between the luminosity of molecular gas () and that of infrared emission (), up to the highest gas densities (106 - 108cm-3 ) that have been probed so far. For nearby galaxies with large radii, we measure the IR luminosity within the submm beam-size (14 –18′′) to match the molecular emission. We find linear slopes for - and -, and a slightly super-linear slope for -. The correlation of - even extends over eight orders of luminosity magnitude down to Galactic dense cores, with a fit of log()log() . Such linear correlations appear to hold for all densities cm-3 , and indicate that star formation rate is not related to free-fall time scale for dense molecular gas.
Subject headings:
galaxies: evolution — galaxies: ISM — infrared: galaxies — ISM: molecules — radio lines: galaxies1. INTRODUCTION
The star formation process constantly turns gas into stars. The Kennicutt-Schmidt (K-S) law (Kennicutt, 1998) globally correlates the surface-densities of star formation rate ( traced by H) with total gas mass (gas traced by CO and H i ), with a slope . However, quite a range of deviations from the K-S law have been observed, and no unique slope was found in the - correlations as well (e.g., Liu & Gao, 2012; Gao & Solomon, 2004a).
Recent studies on star formation indicate that stars, especially the massive stars, are predominantly formed in the dense cores of giant molecular clouds (e.g., Evans, 2008). Dense gas directly represents molecular content involved in forming stars (e.g., Lada et al., 2012), traced by the rotational transitions of high dipole moment molecules (e.g., HCN and HCO+), because of their high critical densities111All critical densities () in this letter are calculated with at =100 K assuming optically thin emission. and denote the Einstein coefficient for spontaneous emission and the collision rate, respectively. All state-to-state cross sections and rate coefficients are from the LAMDA Web site (http://home.strw.leidenuniv.nl/m̃oldata/) (Schöier et al., 2005).(). Gao & Solomon (2004a, b) find a tight linear correlation between the luminosities of IR emission ( tracing the SFR) and HCN =10 ( tracing ) in galaxies. This correlation even extends to Galactic dense cores undergoing high mass star-formation (e.g., Wu et al., 2005). Lada et al. (2012) argue that such linear correlation is a fundamental relation for SFR and dense gas, and the molecular gas with densities above cm-3 should follow this linearity. Linear correlations have also been found in other dense gas tracers with similar or higher (e.g., HCO+=10, HNC =32, CS =54), in both Galactic dense cores and galaxies (e.g., Schenck et al., 2011; Ma et al., 2012; Reiter et al., 2011; Wang et al., 2011).
| Distance | Band | Typeg | ||||||||||
| Source Name | (Mpc) | () | (K km s-1 ) | (K km s-1 ) | (K km s-1 ) | (106K km s-1 pc2) | (106K km s-1 pc2) | (106K km s-1 pc2) | (m) | |||
| IC 1623 | 82.4 | 49.0 | 0.9 | 0.9 | 0.90.2 | 66 | 62 | 6215 | 0.65 | 1.29 | 100 | SF |
| NGC 1068 | 14.4 | 20.4 | 1.00.2 | 5.00.2 | 2.70.2 | 2.50.5 | 10.70.4 | 5.80.4 | 0.16 | 1.16 | 70 | AGN |
| NGC 1365 | 18.3 | 10.5 | 0.60.2 | 1.70.2 | 2.90.2 | 2.20.7 | 5.90.7 | 10.00.7 | 0.25 | 1.16 | 70 | AGN |
| NGC 1808 | 12.3 | 6.92 | 0.6 | 2.50.2 | 2.20.2 | 1.0 | 3.90.3 | 3.40.3 | 0.46 | 1.29 | 100 | AGN |
| NGC 2903 | 10.6 | 2.57 | 0.9 | 0.9 | 0.9 | 1.1 | 1.0 | 1.0 | 1.0 | – | – | SF |
| NGC 3256 | 44.3 | 57.5 | 0.80.2 | 1.10.2 | 2.80.2 | 456 | 224 | 564 | 0.34 | 1.29 | 100 | SF |
| NGC 3627 | 11.0 | 2.88 | 0.7 | 0.80.2 | 0.70.2 | 1.0 | 1.00.3 | 0.90.3 | 0.08 | 1.29 | 100 | AGN |
| NGC 3628 | 11.0 | 2.14 | 0.50.2 | 0.90.2 | 2.50.2 | 1.2 | 1.10.4 | 3.10.4 | 0.23 | – | 850 | SF |
| NGC 4039 | 25.0 | 9.33 | 1.2 | 0.7 | 0.90.3 | 8.2 | 4.5 | 5.81.8 | 0.04 | 1.29 | 100 | SF |
| NGC 4418 | 29.5 | 9.33 | 1.20.2 | 3.00.2 | 1.20.2 | 11.52.0 | 26.82.0 | 8.91.8 | 1.0 | – | – | AGN |
| NGC 4945 | 3.8 | 2.82 | 7.30.3 | 23.40.3 | 9.90.3 | 1.20.05 | 3.60.05 | 4.50.05 | 0.40 | 1.29 | 100 | AGN |
| IRAS13120-5453 | 128.3 | 178 | 0.9 | 2.00.3 | 1.60.3 | 106 | 33030 | 26530 | 1.0 | – | – | SF |
| IRAS13242-5713 | 38.9 | 31.6 | 1.80.3 | 4.30.3 | 3.50.3 | 305 | 675 | 545 | 0.64 | 1.29 | 100 | SF |
| NGC 6240 | 107 | 70.8 | 0.7 | 1.30.2 | 2.40.2 | 99 | 18930 | 26020 | 1.0 | – | – | SF |
| IRAS17578-0400 | 61.1 | 24.5 | 0.9 | 1.50.3 | 0.9 | 36.6 | 57.010 | 34 | 1.0 | – | – | SF |
| IRAS18293-3413 | 77.4 | 64.6 | 0.9 | 0.9 | 1.60.3 | 58.6 | 55 | 11620 | 1.0 | – | – | SF |
| NGC 7469 | 71.6 | 46.8 | 0.9 | 0.9 | 1.00.2 | 33.5 | 30 | 3710 | 1.0 | – | – | AGN |
| NGC 7552 | 19.5 | 8.91 | 0.60.2 | 1.30.2 | 2.40.2 | 1.30.4 | 5.10.4 | 9.40.4 | 0.59 | 1.29 | 100 | SF |
| NGC 7771 | 63.0 | 26.9 | 0.9 | 0.9 | 0.9 | 40 | 36 | 36 | 0.55 | 1.29 | 100 | SF |
| Mrk 331 | 80.9 | 33.9 | 0.9 | 1.10.2 | 0.9 | 43 | 6013 | 40 | 1.0 | – | – | AGN |
| NGC 253a | 3.47 | 3.45 | – | – | – | 0.35a | 8.91b | 7.71.0b | 0.18 | 1.33 | 100 | SF |
| IC 342b | 3.93 | 1.08 | – | – | – | 0.05a | 0.80.2c | – | 0.05 | 1.33 | 100 | SF |
| Arp 220c | 79.9 | 162.2 | – | – | – | 190 d | 950190 | 17040 d | 1.0 | – | – | SF |
| HE2-10d | 16.4 | 0.6 | – | – | – | 0.21a | – | – | 0.29 | 1.33 | 100 | SF |
| MRK 231e | 180.8 | 340 | – | – | – | – | 550110e | 18823f | 1.0 | – | – | AGN |
For gas tracers with higher than HCN =10, the slopes of the - correlations are controversial. Krumholz & Thompson (2007) argue that the mean densities in different types of galaxies and of the tracer change the slopes. Numerical simulations predict decreasing slopes against increasing , because of sub-thermal excitation conditions (i.e., Narayanan et al., 2008; Juneau et al., 2009). Observations of HCN, HCO+, and CS (typically, 32) have been used to support these and show sub-linear correlations (e.g., Baan et al., 2008; Bussmann et al., 2008; Graciá-Carpio et al., 2008), where HCN =32 has a slope of 0.8, following the prediction quite well (Bussmann et al., 2008). Up to date, only few detections of higher- transitions of the above species have been reported (i.e., Knudsen et al., 2007; Jackson et al., 1995; Greve et al., 2009; Bayet et al., 2009; Wilson et al., 2008).
To better probe the densest molecular gas in galaxies, and to test the predictions for higher tracers, we therefore performed a survey of CS =76, HCN =43, and HCO=43 in 20 nearby actively star-forming galaxies with the Atacama Pathfinder EXperiment (APEX) 12-m telescope222This publication is based on data acquired with the Atacama Pathfinder Experiment (APEX). APEX is a collaboration between the Max-Planck-Institut für Radioastronomie, the European Southern Observatory, and the Onsala Space Observatory.. With the advent of the Herschel space telescope, we are able to obtain beam-matched IR luminosities in nearby galaxies, and to compare them with data from single dish telescopes. In this letter, we summarize our findings and compare them with the results from Galactic studies. We adopt flat cosmology parameters ( =0.27, =0.73, and =71 km s-1 Mpc-3; Spergel et al., 2007).
2. SAMPLE, OBSERVATIONS and DATA REDUCTION
We selected 20 galaxies from the Infrared Astronomical Satellite (IRAS) Revised Bright Galaxy Sample (Sanders et al., 2003), with 100 Jy, and declination . In the analysis, we also include data from literature (Jackson et al., 1995; Knudsen et al., 2007; Papadopoulos, 2007; Wilson et al., 2008; Greve et al., 2009; Bayet et al., 2009), which were mostly observed with the James Clerk Maxwell Telescope (JCMT) with a beam-size (Full Width Half Power; FWHP) of 14′′. The sample encompasses galaxies with from to , including nearby normal galaxies, starbursts, and Ultra Luminous Infrared Galaxies (ULIRGs; ), with about half containing Active Galactic Nuclei (AGNs). Table 1 lists the targets with integrated intensity, distance, and luminosities.
Our observations were performed in 2011 April and August with the Atacama Pathfinder Experiment (APEX) on the Chajnantor Plateau in Chile, in good ( 0.6 mm) to median ( 1 mm) weather conditions. In total we spent 30 hours telescope time on this project. The First Light APEX Submillimeter Heterodyne receiver (FLASH) was employed to observe CS =76, HCN =43 and HCO=43 simultaneously, with dual sidebands. Typical system temperatures were 180 - 240 K. The Fast Fourier Transform Spectrometer back-ends led to a bandwidth of 4 GHz for each sideband, with a channel spacing of 0.2 MHz. The beam-size is at 342 GHz.
All observations were performed in a wobbler switching mode. Beam throws range between 2′ and 4′, according to the target size. Every 15 minutes we made a chopper wheel calibration. The focus was determined on Saturn or Jupiter every 3–6 hours. Pointing was checked once per hour, resulting in a typical uncertainty of 2-3′′ (R.M.S.). Including overhead, we spent 1.5 hour on each galaxy. Typical R.M.S. noise levels are 0.1 mK at 20 km s-1 velocity resolution. Although the sideband separation is better than 10 dB, there are still some CO =32 images presented in the upper sideband. Fortunately these CO images do not mix with our HCN spectra.
All data were reduced with the CLASS package in GILDAS333http://www.iram.fr/IRAMFR/GILDAS. We checked the line profiles of low- HCN or CO transitions in the literature and set the baseline ranges accordingly. Linear baselines were subtracted after inspecting each spectrum. We qualified spectra by comparing the measured noise and the theoretical noise before and after 4 times of boxcar smooth. About 5% of the spectra were discarded during the qualification.
We converted the antenna temperatures () to the main beam brightness temperatures ( ), using . The adopted forward hemisphere efficiency and beam efficiency are 0.95 and 0.73, respectively. The flux uncertainty was estimated to be 15%. We derived the line luminosity () following Solomon et al. (1992).
3. RESULTS AND DISCUSSION
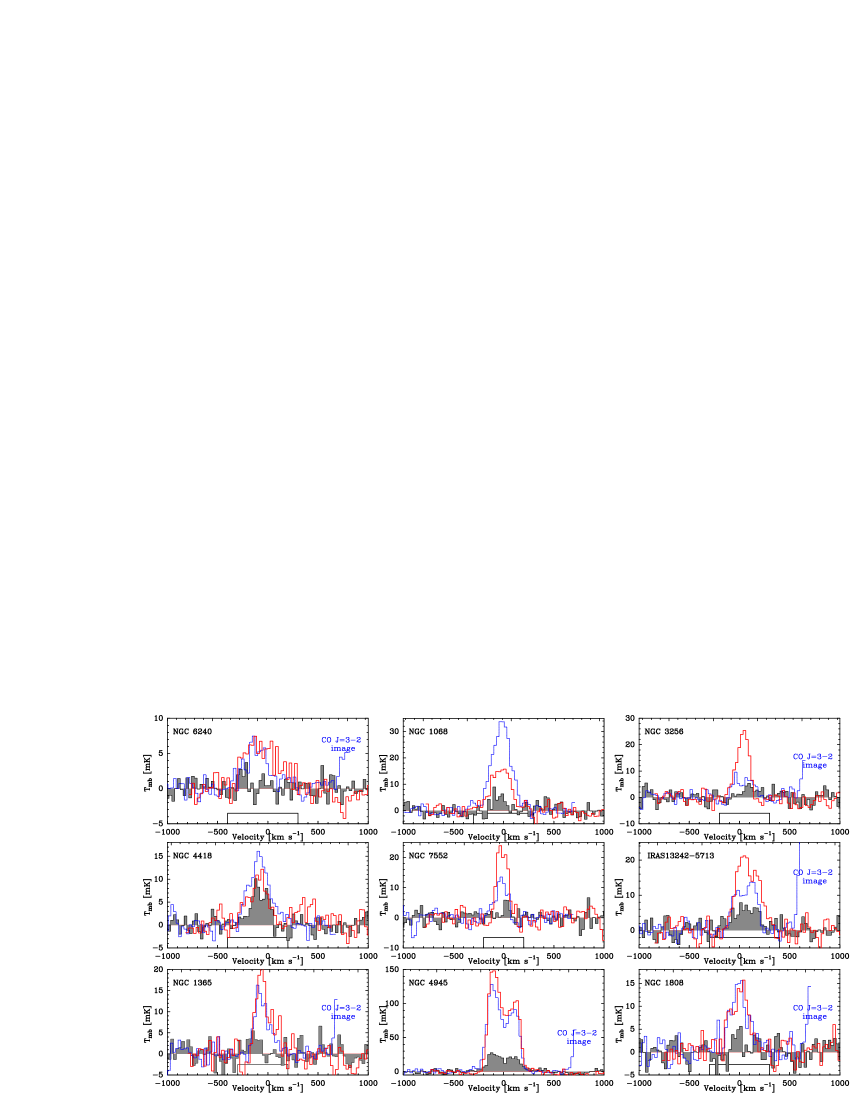
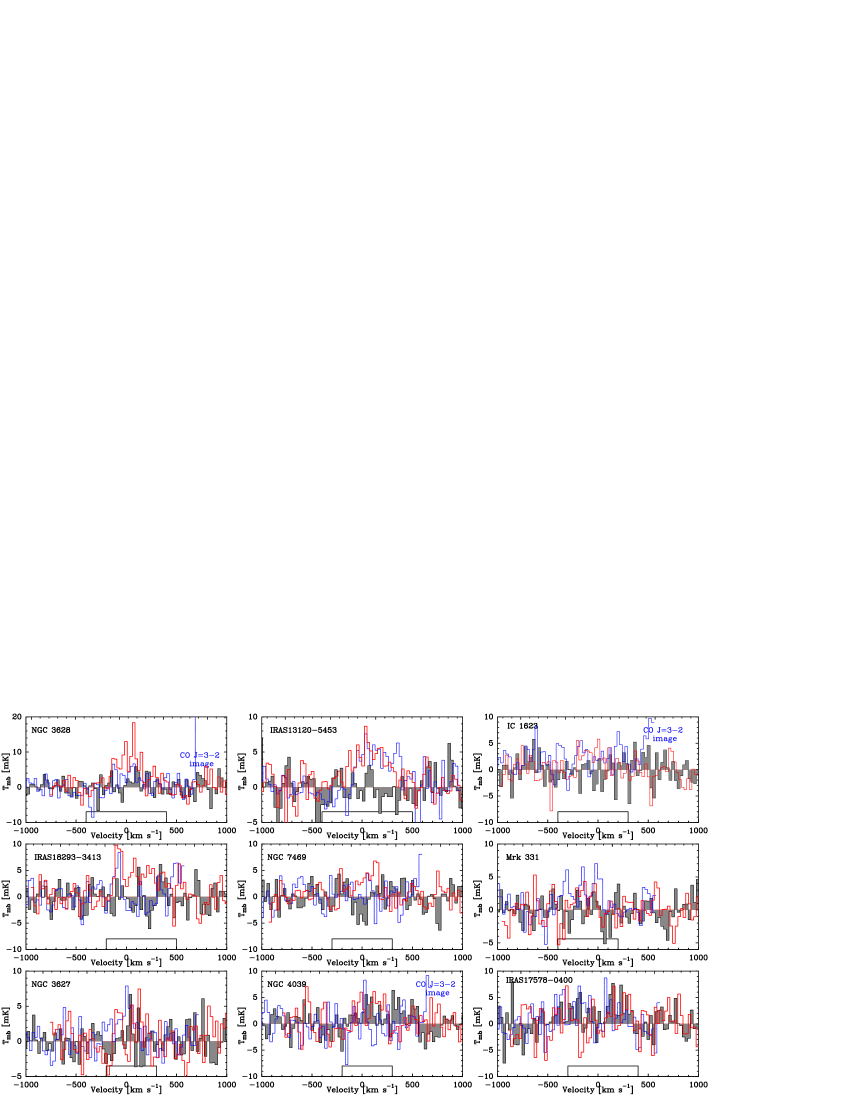
We detected 8, 14, and 16 ( 3 ) galaxies in CS =76, HCN =43, and HCO=43, respectively. Most of them are strong detections of HCN and HCO+ ( 4 ), while Mrk 331, NGC 7469 and NGC 4039 show marginal detections in HCO=43 ( 3 ). Upper limits (3 ) are derived for the non-detections. Fig. 1 shows the spectra of strong detections of HCO=43, and Fig. 2 shows the spectra of weak detections of HCO=43. NGC 7771 and NGC 2903 has only non-detections, so we do not show their spectra. Combining data from the literature we construct samples containing 14, 17, and 17 detected galaxies for CS =76, HCN =43, and HCO=43, respectively.
Total IR (TIR; 8-1000m) luminosity (Sanders et al., 2003) is adopted as a proxy of SFR. However, the molecular lines are obtained only in small beam-sizes ( 14′′ – 18′′), which only pick up a certain portion of the IR luminosity for a whole galaxy. This is particularly problematic for nearby galaxies and starbursts because of their large radii (up to a few arcmins). If this effect was neglected, one would systematically overestimate the IR emission or underestimate the dense gas emission at the low luminosity end of the - correlations, while the ULIRGs are not affected due to their small angular sizes of gas emission.
We decide to measure the IR emission within the submm beam-size, rather than to adopt the IR luminosities of the entire galaxies. We download Herschel444Herschel is an ESA space observatory with science instruments provided by European-led Principal Investigator consortia and with important participation from NASA. PACS 100 m, 70 m (when 100 m is not available) images from the Herschel Science Archive (HSA), and they are processed to level 2.5 in the pipeline. NGC 3628 does not have Herschel data, so we adopt archival images of SCUBA 850 m instead. Using these IR data, we perform aperture photometry with the submm beam-size and with the whole galaxy. The background radii are selected by eye from the outside of galaxies to the edge of the images. Some nearby galaxies are downloaded from the Key Insights on Nearby Galaxies (KINGFISH) project, and similar to their photometry results (Dale et al., 2012), the impact of using 10% larger or smaller aperture areas is a median difference of less than 3% on the flux densities for all wavelengths. The IR luminosity within the beam-size is:
where is the IR luminosity of the entire galaxy, is the ratio of flux densities within the beam-size of single dish (SD) telescope to that measured in the whole galaxy, and is the aperture correction factor for the beam-sizes. The final error comprises errors of photometry (5%), the point source assumption (10%), the flux calibration error (5%), and the error of tracing TIR with a chromatic IR band (10%) (e.g., Galametz et al., 2013). In the end we account 20% as a conservative uncertainty for .
3.1. The - Correlations
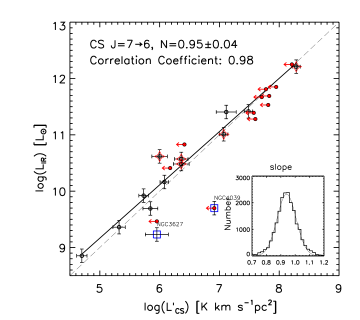
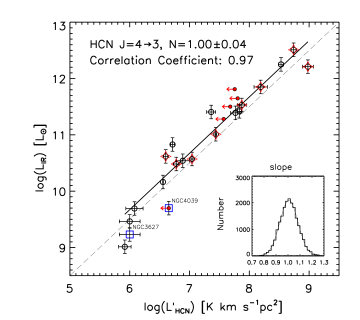
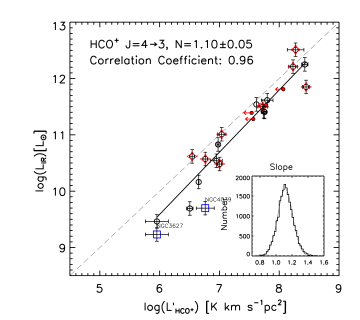
Figure 3 presents the - correlations. All
detections are included in the fitting except for NGC 4039 and NGC 3627,
because the regions covered by their APEX beams are not active in star
formation as indicated from their IR images. In the linear regression we assume
Gaussian independent variables, and account for the errors in both and
. Upper limits are not adopted in the fitting. The -
correlations extend from the nuclear regions of nearby normal galaxies to
ULIRGs, covering a range of 2.5 decades. We adopt publicly
available IDL routines MPFIT (Markwardt, 2009) for the linear least-squares
fit and LINMIX_ERR (Kelly, 2007) for the Bayesian regression. The best
linear least-squares fits with uncertainties are listed below, with
indicating the correlation coefficient:
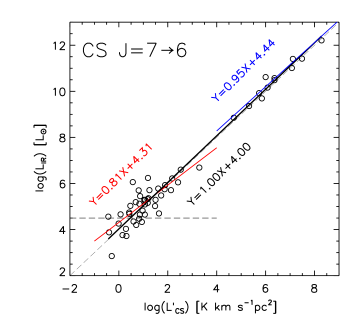
In the Bayesian regressions, we present the posterior distributions of possible slopes in the insets of Figure 3, and obtain error estimates by fitting the distributions with Gaussian profiles. These fittings give slopes of 0.940.07, 1.010.07, and 1.120.9 for CS =76, HCN =43, and HCO=43, respectively. These are consistent to the linear least-squares fit. Both correlations of - and - have slopes very close to unity, while the - correlation shows a slight super-linear slope. The slopes of HCN and HCO+ are much higher than those predicted by Narayanan et al. (2008) and Juneau et al. (2009). Although they did not predict CS =76, the high of CS =76 makes it far from the predicted trend too. We also fitted the correlations with our APEX data only, and obtained slopes of 0.980.15, 0.980.05, and 1.080.05, which are very close to the results fitted with the combined data.
Alternatively, we fitted the correlations without the beam-matching correction, and obtained slopes (N) and correlation coefficients () to be: N=0.710.08 and =0.89 for CS =76, N=0.770.05 and =0.94 for HCN =43, and N=0.940.10 and =0.92 for HCO=43, respectively. The shallower slopes (sub-linear) and worse correlations indicate that the beam-matching correction has a significant effect in the fitting. On the other hand it should be emphasized that, with the beam-matching correction we are studying the central 14′′-18′′ regions in the nearby galaxies (except for the maps of HCN =43 and HCO=43 in NGC 253), rather than the whole galaxies.
At =100K, HCN =43, HCO=43, and CS =76 have of cm-3 , cm-3 , and cm-3 (see Sect 1), respectively. These tracers pick up the densest part of the molecular cores, and trace only a small amount of the total dense gas mass involved in star-formation. The linear slopes found in the high- HCN and CS tend to support the proposed correlations for gas tracers with higher than cm-3 (Lada et al., 2012).
Comparing with the neutral HCN and CS molecules, the molecular ion HCO+ is more sensitive to the average ambient electron abundance , because of the protonation reaction:
The high electron abundance is likely to reduce efficiently. Considering the impacts of the CR ionization (Papadopoulos, 2007), the turbulent diffusion (Xie et al., 1995), and the AGN illumination, HCO+ is likely deficit when being exposed to the extreme physical conditions prevailing at the high luminosity end, i.e., ULIRGs. Such effect could increase the slopes of the -correlations in galaxies.
3.2. Comparison between Galactic Cores and Galaxies
Wu et al. (2010) measured the - correlation in individual Galactic dense cores with high mass star formation. Their best fit yields a slope of 0.8 with a large uncertainty because of the significant scatter in the data and the limited range of infrared luminosities they have at their disposal. In the bottom right of Figure 3, we plot their Galactic cores and our galaxies together. Combining both samples, we find a highly linear correlation,
with a correlation coefficient of 0.98. This correlation is remarkably similar to that derived for HCN 0 by Wu et al. (2005), though CS =76 has much higher excitation requirements. The linear correlation between and holds over an IR luminosity range of about eight orders of magnitude.
The linearity of the (dense gas)—SFR correlation was interpreted as a “fundamental unit” of star formation on different physical scales, thus both SFR and dense gas mass are simply piled up by adding in more units (e.g., Wu et al., 2005). Recently it was found that once the studied gas content is denser than a density threshold, SFR does not depend on the exact value of the gas density, but depends on the total mass of the dense gas (e.g., Lada et al., 2012). In such a context the near-linearity in the correlation in nearby galaxies (e.g., Bigiel et al., 2008; Schruba et al., 2012) is likely caused by a constant / fraction.
The gas densities probed by the three lines are beyond the highest average densities in starbursts (Krumholz & Thompson, 2007), and they are also one to two orders of magnitude higher than the threshold density for star-formation ( cm-3 ; e.g., Parmentier et al., 2011; Lada et al., 2012). We find that all gases with densities cm-3 are linearly correlated with SFR, which indicates that the SFR in the dense gas is not likely affected by the free-fall time scale (), because . If - correlations are linear for all dense gases, the shorter for the denser gas would not keep - linear. Indeed, the gas content traced by HCN =10 has 10 times longer than that traced by HCN =43, but they do show both linear correlations with the SFR. The non-linear correlations found in the K-S law are likely caused by the different fractions of dense gas to total gas in different types of galaxies, rather than the free-fall timescales (Lada et al., 2012). Actually, the K-S law with a slope of 1.4 is likely not a fundamental physical relation, as the non-linear slope found for H2+H i , seen in the very tenuous gas, is related to the relative amounts of dense gas and dust directly being involved in star formation and other gas being too diffuse and diluted to have anything to do with massive star formation.
3.3. AGN Contamination to the IR Emission
About half of the galaxies in our sample are hosting AGNs, in particular the ULIRGs. Compared to the near- and mid IR bands, the far- and total-IR are well correlated and are thus less contaminated by the AGNs emission (e.g., U et al., 2012; Juneau et al., 2009). Some AGNs, however, can still contribute significantly to the bolometric luminosity in ULIRGs (e.g., Veilleux et al., 2009). For the most extreme case, Mrk 231, the estimated AGN contribution is 70%, and the SFR indicated from the IR emission should be 0.5 dex lower in the - correlations (e.g., Veilleux et al., 2009). For the rest galaxies, the AGN contamination should be much less (10%) for LIRGs () and nearby Seyferts, where star-formation is expected to dominate over IR emission. Unfortunately the IR emission for most AGN-host galaxies have not been decomposed, so that we could not deduce the IR luminosity by , where is the fraction of the IR luminosity due to star-formation. Overall, we do not find significant changes in the correlations if we remove AGNs from our samples. This may be due to the small size of our sample, or the fact that most AGN-hosting galaxies are not strongly contaminated by AGNs.
In conclusion, we present a survey of three dense gas tracers (CS =76, HCN =43, and HCO=43) in 20 nearby galaxies observed with the APEX 12-m telescope. Combining with data from literature and after a beam-matching correction for nearby galaxies, we find linear - correlations for CS =76 and HCN =43, and a slightly super-linear slope for . These results are consistent with those found in HCN =10 (i.e., Gao & Solomon, 2004a, b) and CS =54 (i.e., Wang et al., 2011; Wu et al., 2010), but contradictory to the predictions in Bussmann et al. (2008) and Juneau et al. (2009). We also find that the linear - correlation can be traced across eight orders of luminosity magnitude, down to Galactic cores. If the beam-matching corrections are not applied for nearby galaxies, however, the slopes are significantly sub-linear. Future ALMA surveys of more dense gas tracers as well as other transitions over large samples of galaxies are necessary to consolidate the above findings and ensure that, apart from the vagaries of HCO+ chemistry, the simplest (dense gas)-SFR empirical relation is indeed true.
References
- Baan et al. (2008) Baan, W. A., Henkel, C., Loenen, A. F., Baudry, A., & Wiklind, T. 2008, A&A, 477, 747
- Bayet et al. (2009) Bayet, E., Aladro, R., Martín, S., Viti, S., & Martín-Pintado, J. 2009a, ApJ, 707, 126
- Bigiel et al. (2008) Bigiel, F., Leroy, A., Walter, F., et al. 2008, AJ, 136, 2846
- Bussmann et al. (2008) Bussmann, R. S., Narayanan, D., Shirley, Y. L., et al. 2008, ApJ, 681, L73
- Dale et al. (2012) Dale, D. A., Aniano, G., Engelbracht, C. W., et al. 2012, ApJ, 745, 95
- Evans (2008) Evans, II, N. J. 2008, in Astronomical Society of the Pacific Conference Series, Vol. 390, Pathways Through an Eclectic Universe, ed. J. H. Knapen, T. J. Mahoney, & A. Vazdekis, 52
- Galametz et al. (2013) Galametz, M., Kennicutt, R. C., Calzetti, D., et al. 2013, MNRAS,431,1956
- Gao & Solomon (2004a) Gao, Y. & Solomon, P. M. 2004a, ApJS, 152, 63
- Gao & Solomon (2004b) Gao, Y. & Solomon, P. M. 2004b, ApJ, 606, 271
- Graciá-Carpio et al. (2008) Graciá-Carpio, J., García-Burillo, S., Planesas, P., Fuente, A., & Usero, A. 2008, A&A, 479, 703
- Greve et al. (2009) Greve, T. R., Papadopoulos, P. P., Gao, Y., & Radford, S. J. E. 2009, ApJ, 692, 1432
- Jackson et al. (1995) Jackson, J. M., Paglione, T. A. D., Carlstrom, J. E., & Rieu, N.-Q. 1995, ApJ, 438, 695
- Juneau et al. (2009) Juneau, S., Narayanan, D. T., Moustakas, J., et al. 2009, ApJ, 707, 1217
- Kelly (2007) Kelly, B. C. 2007, ApJ, 665, 1489
- Kennicutt (1998) Kennicutt, Jr., R. C. 1998, ApJ, 498, 541
- Knudsen et al. (2007) Knudsen, K. K., Walter, F., Weiss, A., et al. 2007, ApJ, 666, 156
- Krumholz & Thompson (2007) Krumholz, M. R. & Thompson, T. A. 2007, ApJ, 669, 289
- Lada et al. (2012) Lada, C. J., Forbrich, J., Lombardi, M., & Alves, J. F. 2012, ApJ, 745, 190
- Liu & Gao (2012) Liu, L. & Gao, Y. 2012, Science in China G: Physics and Astronomy, 55, 347
- Ma et al. (2012) Ma, B., Tan, J. C., & Barnes, P. J. 2012, ArXiv e-prints
- Markwardt (2009) Markwardt, C. B., 2009, ASPC, 411, 251
- Narayanan et al. (2008) Narayanan, D., Cox, T. J., Shirley, Y., et al. 2008, ApJ, 684, 996
- Papadopoulos (2007) Papadopoulos, P. P. 2007, ApJ, 656, 792
- Parmentier et al. (2011) Parmentier, G., Kauffmann, J., Pillai, T., & Menten, K. M. 2011, MNRAS, 416, 783
- Reiter et al. (2011) Reiter, M., Shirley, Y. L., Wu, J., et al. 2011, ApJS, 195, 1
- Sanders et al. (2003) Sanders, D. B., Mazzarella, J. M., Kim, D.-C., Surace, J. A., & Soifer, B. T. 2003, AJ, 126, 1607
- Schenck et al. (2011) Schenck, D. E., Shirley, Y. L., Reiter, M., & Juneau, S. 2011, AJ, 142, 94
- Schöier et al. (2005) Schöier, F. L., van der Tak, F. F. S., van Dishoeck, E. F., & Black, J. H. 2005, A&A, 432, 369
- Schruba et al. (2012) Schruba, A., Leroy, A. K., Walter, F., et al. 2012, AJ, 143, 138
- Solomon et al. (1992) Solomon, P. M., Radford, S. J. E., & Downes, D. 1992, Nature, 356, 318
- Spergel et al. (2007) Spergel, D. N., Bean, R., Doré, O., et al. 2007, ApJS, 170, 377
- U et al. (2012) U, V., Sanders, D. B., Mazzarella, J. M., et al. 2012, ApJS, 203, 9
- Veilleux et al. (2009) Veilleux, S., Rupke, D. S. N., Kim, D.-C., Genzel, R., et al. 2009, ApJS, 182, 628
- Wang et al. (2011) Wang, J., Zhang, Z., & Shi, Y. 2011, MNRAS, 416, L21
- Wilson et al. (2008) Wilson, C. D., Petitpas, G. R., Iono, D., et al. 2008, ApJS, 178, 189
- Wu et al. (2005) Wu, J., Evans, II, N. J., Gao, Y., et al. 2005, ApJ, 635, L173
- Wu et al. (2010) Wu, J., Evans, II, N. J., Shirley, Y. L., & Knez, C. 2010, ApJS, 188, 313
- Xie et al. (1995) Xie, T., Allen, M., & Langer, W. D. 1995, ApJ, 440, 674