A Mid-Infrared Search for Substellar Companions of Nearby Planet-Host Stars
Abstract
Determining the presence of widely separated substellar-mass companion is crucial to understand the dynamics of inner planets in extrasolar planetary systems (e.g. to explain their high mean eccentricity as inner planets are perturbed by the Kozai mechanism). We report the results of our Spitzer/Infrared Array Camera (IRAC) imaging search for widely separated (10 – 25′′) substellar-mass companions for 14 planet-host stars within 15 pc of the Sun. Using deep 3.6 and 4.5 m observations in subarray mode, we found one object in the field of 47 UMa with [3.6][4.5] color similar to a T5 dwarf, which is, however, unlikely to share common proper motion with 47 UMa. We also found three objects with brown-dwarf-like [3.6][4.5] color limits in the fields of GJ 86, HD 160691, and GJ 581, as well as another in the field of HD 69830 for which we have excluded common proper motion. We provide model-based upper mass limits for unseen objects around all stars in our sample, with typical sensitivity to 10 MJ objects from a projected separation of 50 to 300 au from the parent star. We also discuss our data analysis methods for point-spread-function subtraction, image co-alignment, and artifact subtraction of IRAC subarray images.
Subject headings:
infrared: stars — methods: data analysis — planetary systems — stars: low-mass, brown dwarfs1. Introduction
Large bodies in the periphery of planetary systems have the potential to wreak havoc on the orbits of inner planets through secular interactions. naoz11 posit this effect to be responsible for the migration of hot Jupiters; marzari02 describe how planet-planet scattering can result in moderately eccentric planetary orbits; and takeda05 demonstrate how Kozai-type interactions (kozai62) can result in highly eccentric planet orbits, inward of a large planet or brown dwarf.
Given that conventional planet formation models, including both core accretion (pollack96) and gravitational instability (boss97), describe planets forming in mostly circular, well-aligned circumstellar disks, it is important to explain why the mean eccentricity of discovered exoplanets is currently 0.19111http://exoplanet.eu, as of Oct 7, 2013, with many of the highest eccentricities found in single-planet systems (78% with are single planets). If secular effects involving a massive companion are responsible, these companions may be observable, if they have not yet been ejected from the system. ford08 conclude that most planet scattering instabilities should occur on timescales comparable to the planet formation timespan, but do acknowledge that triple planet systems in certain configurations could potentially be quasi-stable on timespans from to years, so it is not impossible to have planet ejection occur in an old system.
gizis01 found brown dwarf companions au from the primary, and luhman07 found HD 3651B, a brown dwarf orbiting 476 au from a star with an eccentric planet. However, the same formation models mentioned above do not explain how such a massive companion could form so far from the parent star: that far-separated substellar companions and highly eccentric planets both exist deserves explanation. One such explanation is that all objects form close to their parent stars and end up in their current configurations through scattering events (boss06, nagasawa11).
Whether causing havoc or not, widely separated companion brown dwarfs are interesting in their own right, as relatively few are known: of the 99211footnotemark: 1 substellar-mass companion objects discovered, only 36 (all with mass ) are farther than 10 au from their parent, and 21 of those lie between 10-300 au. In part, this is a selection effect: the timescales necessary to find these objects with either radial velocity (RV) or transit methods are prohibitive, and all of the aforementioned brown dwarfs have been detected by direct imaging. Ground-based direct imaging searches have been successful in finding gas giant companions (e.g. carson13, marois10, chauvin05 and neuhauser05), but have lower sensitivity to the coolest T- and Y-dwarfs (which have distinctive [3.6][4.5] colors) because of telluric absorption in the thermal infrared. Space telescopes get around this problem, and WISE has been successful in finding many field T- and Y-dwarfs (kirkpatrick11), but is less sensitive to brown dwarfs around stars because of the high contrast ratios involved. Studies like bergfors13, ginski12, and roell12 have searched for stellar-mass companions to planet-host stars, but are generally not sensitive to brown-dwarf-mass objects.
The inner working angle of any direct-imaging companion search is limited by the brightness of the parent star compared to its companion. At optical wavelengths, this is determined by the contrast ratio between the parent star’s emission and the companion’s reflected light. This can be problematic at close angular distances or if the starlight saturates the detector. However, the contrast ratio in the infrared (e.g. at 3.6 m), where thermal emission dominates over reflected light, is much more manageable. This lower ratio opens up the possibility of searching for planetary mass companions with advanced Point Spread Function (PSF) subtraction techniques, provided that the PSF is both stable and well spatially sampled. For these reasons, we have used the InfraRed Array Camera (IRAC, fazio04) onboard the Spitzer Space Telescope (werner04) to search for companions around 14 nearby stars. Using IRAC gives the added advantage of being able to characterize T-dwarfs, in particular, using their characteristically red [3.6]-[4.5] color due to methane absorption bands (burrows03).
This work builds on our previous IRAC low-mass companion searches (e.g. marengo06, marengo09, carson11), which have resulted in the discovery of two brown dwarf companions (luhman07), including a T7.5 companion of the exoplanet host star HD 3651. In marengo09, in particular, we have developed the same technique used in the work presented here, adopting IRAC shorter frame-time subarray observing mode. This allows us to reduce the primary star saturation and the area with high PSF-subtraction residuals, narrowing our inner working angle from 20′′ to 5′′. Building on this previous work, we used IRAC’s subarray mode to probe for companions at separations of 25 to 350 au (for a star 15 pc distant) around a sample of 14 nearby planet host stars.
2. Target selection and Observations
Because so few brown dwarf companions to exoplanetary systems are known, it would be equally interesting to find a perturbing brown dwarf companion as to find one around an exoplanet system that does not exhibit abnormal eccentricity, or likewise one that is bound to a system known to already have another brown dwarf companion. Therefore, we selected 14 target stars to observe (Table 1) with only the criteria that they be located within 15 pc from the sun and have exoplanets detected by radial velocity. This 15 pc distance restriction was chosen to provide the best inner working angle, equivalent to a few tens of au from the target star, and an outer working angle of a few hundreds of au (due to the subarray field of view): a range in which perturbing companions acting through the Kozai mechanism are expected. Target stars range in age from 0.1 to Gyr, estimated from various factors including rotational periods, magnetic activity, galactic velocity, and emission lines (for more information, see individual notes at the bottom of Table 1).
| Target | Dist(pc) | Age(Gyr) | Sp. Type | Planet eccentricities (closest to farthest) and notes |
|---|---|---|---|---|
| SCR J1845-6357 | ababfootnotemark: | ccfootnotemark: | M8.5Vababfootnotemark: | MJ T6 companion closer than 4.5 auajajfootnotemark: |
| GJ 876 | zzfootnotemark: | ddfootnotemark: | M5.0Vadadfootnotemark: | 0.2070.055, 0.255910.00003, 0.03240.0013, 0.0550.012eefootnotemark: |
| GJ 581 | aeaefootnotemark: | fffootnotemark: | M5Vadadfootnotemark: | 0.0310.014, 0.070.06, 0.2050.08, 0.320.09ggfootnotemark: |
| GJ 849 | zzfootnotemark: | hhfootnotemark: | M3.5Vadadfootnotemark: | 0.040.02iifootnotemark: |
| GJ 436 | aeaefootnotemark: | jjfootnotemark: | M3.5Vadadfootnotemark: | 0.150.012kkfootnotemark: |
| GJ 86 | zzfootnotemark: | llfootnotemark: | G9Vafaffootnotemark: | 0.0460.004, 1.7′′ WD binarymmfootnotemark: |
| HD 3651 | zzfootnotemark: | llfootnotemark: | K0Vagagfootnotemark: | 0.630.04, T-dwarf companionnnfootnotemark: alalfootnotemark: |
| 55 Cnc | zzfootnotemark: | qqfootnotemark: | G8Vaaaafootnotemark: | , 0.01590.008, 0.053, 0.0002, 0.0250.03rrfootnotemark: ssfootnotemark: |
| HD 69830 | zzfootnotemark: | oofootnotemark: | G8+Vahahfootnotemark: | 0.10.04, 0.130.06, 0.070.07, debris diskoofootnotemark: , 10′′ candidate M companionamamfootnotemark: |
| HD 147513 | zzfootnotemark: | 0.4akakfootnotemark: | G1Vakakfootnotemark: | 0.260.05ppfootnotemark: , possible 5360 au WD binaryppfootnotemark: |
| ups And | zzfootnotemark: | ttfootnotemark: | F9Vaiaifootnotemark: | 0.0130.016, 0.24, 0.274, 0.005360.00044uufootnotemark: vvfootnotemark: |
| 47 UMa | zzfootnotemark: | aafootnotemark: | G1Vaaaafootnotemark: | 0.0320.014, , bbfootnotemark: |
| HD 160691 | zzfootnotemark: | llfootnotemark: | G3IV-Vahahfootnotemark: | 0.1720.04, 0.06660.0122, 0.1280.017, 0.09850.0627xxfootnotemark: |
| 51 Peg | zzfootnotemark: | aafootnotemark: | G2.5IVaaaaafootnotemark: | hot Jupiter with wwfootnotemark: |
Note. — (a) fuhrmann97 (b) gregory10 (c) kasper07 (d) correia10 (e) rivera10 (f) selsis07 (g) forveille11 (h) butler06 (i) bonfils12 (j) torres07 (k) deming07 (l) saffe05 (m) queloz00 (n) fischer03 (o) lovis06 (p) mayor04 (q) vonbraun11 (r) demory12 (s) fischer08 (t) fuhrmann98 (u) curiel10 (v) barnes11 (w) marcy97 (x) pepe07 (y) 2mass (z) vanleeuwen07 (aa) montes01 (ab) deacon05 (ac) faherty09 (ad) jenkins09 (ae) ESA97 (af) torres06 (ag) vanbelle09 (ah) gray06 (ai) Abt 2009 (aj) biller06 (ak) mamajek08 (al) luhman07 (am) tanner10
Among the selected targets, there are 5 M, 1 K, 7 G, and 1 F stars. All are hosts to planets detected by radial velocity (eccentricities listed in Table 1), with the exception of GJ 436, whose planet was discovered by transit. HD 69830 also has a debris disk (beichman05) and candidate M-dwarf companion (tanner10). GJ 86 is binary with a white dwarf (2′′; mugrauer05), and SCR J1845-6357, itself a brown dwarf, has a T-dwarf companion detected by direct imaging at a separation of 1.2′′ (biller06). Both companions are below the resolving power of IRAC. HD 147513 is also binary with a white dwarf (mayor04), which, at a projected separation of 5360 au, is outside our field of view. Nine of the targets have at least one planet with , which may be an indication of the presence of a perturbing companion. GJ 876 has two high-eccentricity planets inward of a 2.3 MJ planet, which may be an example of the type of secular interactions we are exploring (lee02).
Included in the sample is HD 3651, whose planet has the highest eccentricity of our sample (e=0.63, fischer03), and around which we previously discovered a T-dwarf companion at a projected separation of 480 au (43′′, see luhman07). This system may be an example of the type of secular interactions we seek, although Anglada-Escudé et al. (2010) refit the RV data of HD 3651 and claim that instead of one high-eccentricity planet, there are likely two lower-eccentricity (e=0.060.20 and e=0.040.20) planets in a 2:1 period commensurability.
Similarly, And c and d have high eccentricities (e=0.24, e=0.274, barnes11), which curiel10 explains as due to a 3:1 resonance between And d and e. And e has a mostly circular orbit, so an external perturber may not be necessary to explain the dynamics of this system.
Finally, GJ 436 has one planet with moderate eccentricity (e=0.15, deming07). This eccentricity was revalidated by wang11 and attributed by maness07 to an unseen 22.5ME object 0.0285 au from the star. If that object exists, we would not be able to resolve it.
Ten of our targets were previously observed with IRAC (patten05) to search for brown dwarf companions at large separation (projected separation of 100 to 1500 au). As these observations had frame times of 30 sec, they heavily saturated the primary star, limiting our inner working angle to 20′′ from the target (see marengo09). For this reason we chose to observe our target stars in subarray mode, allowing for dramatically shorter exposure times and restricting saturation to the innermost one or two pixels of the brightest sources.
Our observations were executed between Sept 2007 and Aug 2008 (PID 40976), and were modeled on our previous observations of Eridani and Fomalhaut (PID 30754, marengo09), adapted to the lower brightness of the selected targets. We selected frame times for K, G, and F stars were 0.1 seconds (0.08 sec integration time), and 0.4 sec (0.32 sec integration time) for M stars. Each subarray image is 3232 pixels, 1.22′′/pix, and is composed of 64 exposures repeated for each dither position. We used the standard IRAC nine-point Reuleaux dither pattern to obtain non-redundant spatial sampling to build up a total integration time of 921.6 sec per target, with 5 or 20 images (320 or 1280 exposures) per pointing for the 0.4 and 0.1 sec exposures, respectively. The large number of exposures was required to increase the signal-to-noise ratio of potential companions. The total overlap area of the exposures is .
Only 3.6 m and 4.5 m observations were needed because T- and Y-dwarfs have characteristically red [3.6][4.5] colors, due to the presence of methane absorption bands near 3.3 m (burrows03). The total integration time was set to allow the detection of 5 Gyr old, 5 MJ planetary mass bodies at 10 pc from the Sun, based on the predicted photon noise from the PSF of the primary star (marengo09). This was our goal, but we had to compromise for an integration time that resulted in lower sensitivity. Once the PSF was subtracted, however, the detection limit in the innermost 5′′ was not photon noise, but rather the residual noise from subtracting the PSF (see Figure 1 in marengo09). Outside of 5′′, these residuals diminish and electronic artifacts dominate the noise profile. This issue was already encountered in marengo09. In this work we have improved our artifact removal technique significantly in order to reach higher sensitivity.
3. Data Analysis
As the goal of this project is the detection of faint companions around bright stars, our data reduction procedure is designed to combine the individual exposures into a single high-dynamic-range final image, while suppressing the light from the primary star with an accurate PSF subtraction. Other direct imaging searches have employed the LOCI algorithm (lafreniere07) or principal component analysis (soummer12; Amara & Quanz 2012) for PSF subtraction. Both of these methods use PSF segmentation to compensate for instabilities in the PSF by using a library of PSFs produced with a large number of roll angles. We have an insufficient number (only one) of roll angles to use these methods. Furthermore, the thermal stability of IRAC’s PSF makes them less necessary, and electronic artifacts are the strongest source of noise, above the PSF subtraction residual noise in most of our field of view. Instead, our data reduction technique builds upon the work of marengo09. We started from Basic Calibrated Data (BCD) images from the Spitzer Heritage Archive, processed with the IRAC Pipeline version S18.18.0. We then wrote our own custom procedure to combine the nine individual frames from each dither position into a final image, for each star, in each IRAC band. Standard mosaicing procedures are not suitable for our targets because, due to the small field of view of the subarray fields, the lack of background stars in the individual BCDs prevents accurate World Coordinate System (WCS) alignment of individual frames by the IRAC pipeline coordinate refining routine. As a consequence, mosaics made with the standard Spitzer Science Center MOPEX software (MOPEX) would be blurred.
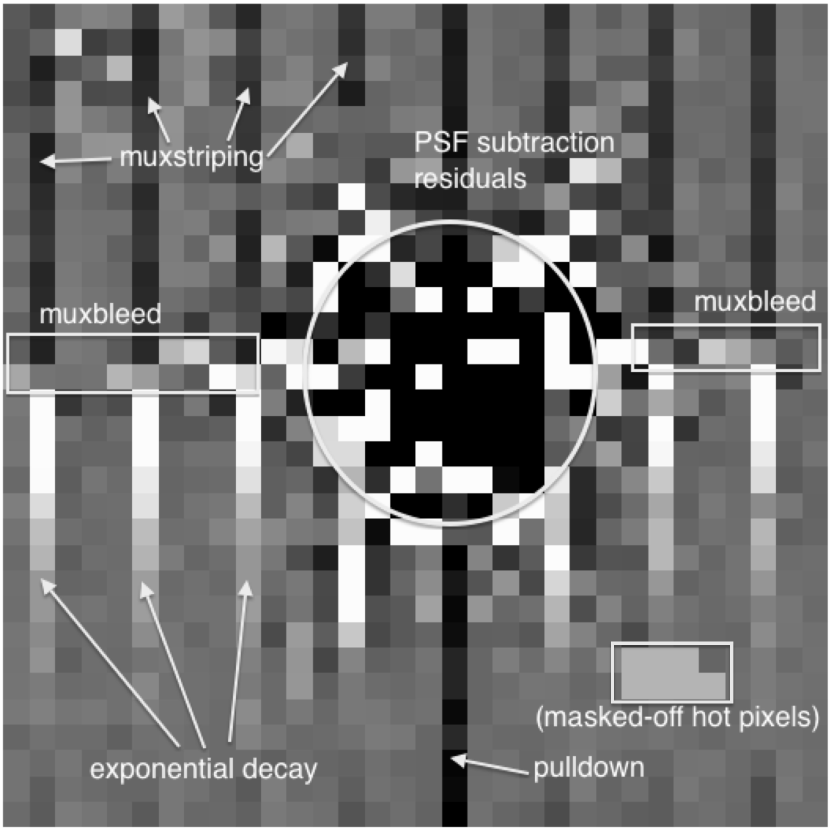
As mentioned in Section 2, for subarray, electronic artifacts dominate the noise profile of PSF-subtracted images outside of approximately from the center of the PSF. These electronic artifacts (shown in Figure 1; details provided in Section 3.2) are produced by bright stars falling on the detector array. The response of the array to bright sources differs from pixel to pixel, so these artifacts need to be characterized and removed in situ, before the nine dither positions are shifted and co-added for sub-sampling.
Two different PSF subtractions were necessary. The first was performed to remove the light from the central bright star in order to better characterize the electronic artifacts. Once characterized, the artifacts were removed from the BCDs, allowing a second, cleaner PSF subtraction to be performed to characterize the stars and search for companions. The IRAC PSF is stable, but position dependent, differing in shape across the focal plane due to light-path geometry, with the most extreme differences near the edges, where the subarray field is located. Because electronic artifact characterization requires a precise PSF subtraction at each dither position, and since there is not a reliable, high S/N ratio Spitzer IRAC PSF available for subarray mode, we created our own PSF for each star, using the other stars in our sample, on a per-dither-position basis.
3.1. Image Alignment and First PSF Subtraction
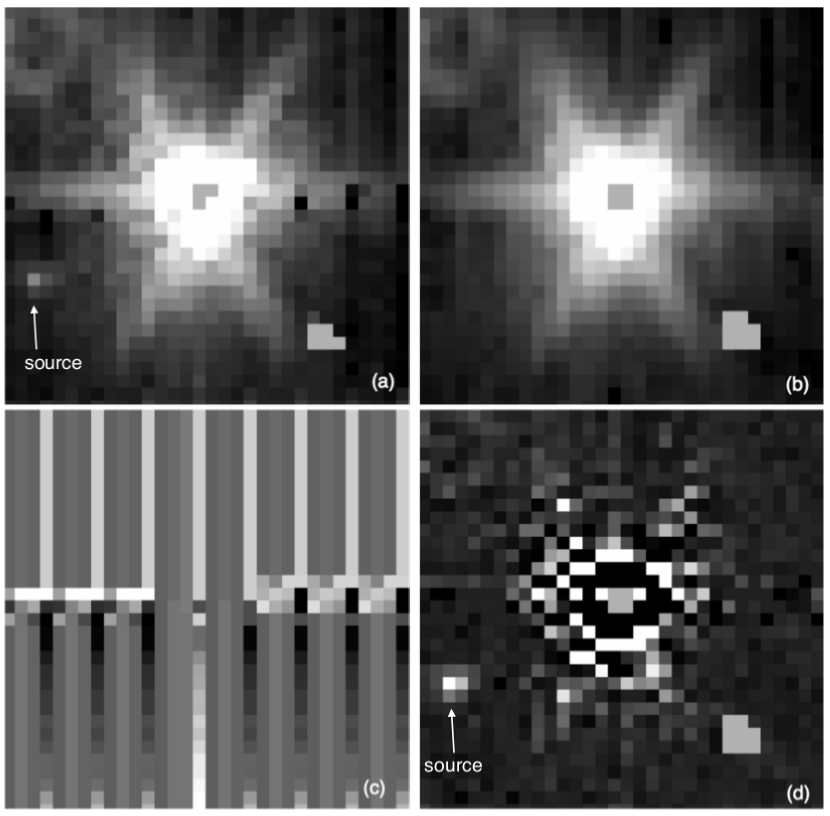
Figure 2 demonstrates our data reduction procedure. In order to characterize, pixel by pixel, the pattern of the electronic artifacts, we subtracted the PSF from each BCD image (Figure 2, panel a) on the original 3232-pixel grid. In marengo09, we used a PSF made from archival data (PID 30666), but this was not ideal due to the different dither pattern used in those observations. For this analysis, we created a PSF for each dither position from the other images in our data set. Each image was aligned and stacked at the pixel size of the original 3232 subarray grid to create a PSF (Figure 2, panel b) for each frame.
IRAC starts to become non-linear at 10,000 and 12,000 DN in bands 1 and 2, respectively (monson12), so we masked off any pixels higher than 99% of those threshold values. The FWHM of IRAC’s 3.6 m PSF is 1.66′′, or 1.36 native pixels; assuming the core to be Gaussian, a 0.1-pixel alignment error affects up to 11% of the image flux. The WCS coordinate uncertainty for our images is on the order of 1′′, roughly 0.8 pixels, making the WCS coordinates provided with the frames too imprecise for sub-pixel alignment of the individual frames. As previously mentioned, WCS coordinates could not be refined due to a lack of field objects in the subarray images. A simple 2-D centroid of each image was also inadequate for alignment purposes: the PSF core changes shape even for small shifts of the stars on the pixel grid, due to IRAC under-sampling, pixel-phase effects, and position-dependent focus of the camera (hora08). Instead, we calculated the stationary points of the numerical gradient of the core of the PSF (its not-saturated part) along three evenly spaced (120 degrees) axes and used the intersection of those gradients as the center coordinate for each image, giving a typical alignment precision (average error) in 3.6 m of 0.0027′′ and 0.0028′′ in 4.5 m. For comparison, using a centroid for alignment of a 1.22′′/pix image produced an average error of 0.07′′ in 3.6 m and 4.5 m. And was too saturated for this technique to work and required manual adjustment.
Using these coordinates to align the images together, we created a PSF for each dither position of each star out of the other twelve star images in our data set (omitting the star itself and 55 Cnc, which has strong horizontal artifacts and was therefore not included in any PSF). We normalized each star image to the target image by finding a multiplicative scale factor and a pedestal offset between them. The scale factor was initially estimated as the ratio of the total fluxes of the two images (this would be incorrect to use as a final value because saturation and field star light differ among images), while the initial offset was set to zero. Using these initial values, we calculated the slope of the radial profile of the difference of the two images. A subtraction with perfect normalization would have zero slope, and the slope is linearly related to the scale factor. After two more scale factor “best guesses”, their respective subtraction slopes were used as the basis for a linear regression to calculate the final scale factor between the two images. Using this scale factor, we performed a similar calculation to obtain the linear offset between each image and the target. The resulting aligned, normalized frames were stacked together. Any pixels with values greater than above the median were discarded, and the mean of the remaining pixels became the PSF for that dither position of that target star (Figure 2, panel b). By scaling our model PSF to have the same IRAC flux as Vega, we were able to use this same technique to calculate the photometry of each of our target stars (results given in Table 2).
| Star | [J] | [H] | [K] | Date Observed | [3.6] | [4.5] |
|---|---|---|---|---|---|---|
| SCR J1845-6357**footnotemark: | 9.54 | 8.97 | 8.51 | 2007-10-22 | 7.8900.006 | 7.8540.017 |
| GJ 876 | 5.93 | 5.35 | 5.01 | 2007-12-23 | 4.8060.016 | 4.7670.008 |
| GJ 581 | 6.71 | 6.10 | 5.84 | 2007-09-08 | 5.6180.003 | 5.5760.004 |
| GJ 849 | 6.51 | 5.90 | 5.59 | 2007-11-25 | 5.4370.005 | 5.4270.006 |
| GJ 436 | 6.90 | 6.32 | 6.07 | 2008-06-16 | 5.9090.005 | 5.8710.008 |
| GJ 86**footnotemark: | 4.79 | 4.25 | 4.13 | 2007-11-14 | 4.1160.004 | 4.1580.004 |
| HD 3651 | 4.55 | 4.06 | 4.00 | 2008-08-21 | 3.9460.007 | 3.9680.004 |
| HD 69830 | 4.95 | 4.36 | 4.17 | 2007-11-25 | 4.1470.006 | 4.1920.004 |
| HD 14751 | 4.41 | 4.03 | 3.93 | 2007-09-13 | 3.9040.006 | 3.9090.003 |
| 47 UMa | 3.96 | 3.74 | 3.75 | 2007-12-28 | 3.5820.008 | 3.5920.004 |
| 55 Cnc | 4.77 | 4.27 | 4.02 | 2007-11-24 | 4.0810.012 | 4.1170.006 |
| ups And | 3.18 | 2.96 | 2.86 | 2008-03-09 | 2.8400.008 | 2.8580.005 |
| 51 Peg | 4.66 | 4.23 | 3.91 | 2007-12-26 | 3.9500.007 | 3.9670.005 |
| HD 160691 | 4.16 | 3.72 | 3.68 | 2007-09-13 | 3.5790.005 | 3.6020.003 |
Note. — Stars marked with an (*) are binaries, with separations below our resolution. The photometry given is the combined photometry of both members.
3.2. Electronic Artifact Characterization and Second PSF Subtraction
After subtracting the dither-position-dependent PSF, electronic artifacts become visible in each frame. There are several effects, shown in Figure 1. “Muxstripe” is a “jail-bar” pattern caused by excess charge in a pixel (from a bright source) unbalancing the multiplexer (readout) channel pedestals. This is superimposed with a repeating decay pattern in the lower half of the image. “Muxbleed” is a horizontal bleeding of charge along the row(s) and readout channel(s) containing excess-charge pixels. “Pulldown” is a central-column bias shift caused by a pixel with excess charge. We characterized these effects in sequence by creating and subtracting a correction matrix of each artifact before moving to the next: first, we masked off a circle with radius out to 10% saturation from the center of the PSF in order to reduce the PSF subtraction residuals that get included in our calculations, then removed each artifact type in turn.
The muxstripe is a difference in pedestal value per multiplexer channel (every fourth column of the image is read by a different channel), affecting the top and bottom of the image (above and below the bright source) differently. Similarly, the muxbleed affects every fourth pixel of each of the 3 rows surrounding the core of a bright source differently. Both of these effects are characterized by the median value of the group of affected pixels, which we evaluated and then assigned to the corresponding area in the correction matrix. For example, to characterize the segment of the muxstripe in the bottom of the image in the first multiplexer channel, the median of all of the pixels comprising columns 0, 4, 8, …, 28 from rows 0 through the row containing the central star was assigned to the correction matrix in those locations. This was done similarly for the other channels and for the muxbleed. This matrix was then subtracted from the PSF-masked image, to prepare for the next artifact to be removed.
The decay artifact does not occur in every image, nor every readout channel, but when it occurs, it again affects every fourth column of the lower half (below the bright source) of the image similarly. Previously (marengo09), we had removed this artifact by fitting an exponential or linear function to each affected column, separately. We discovered, however, that the artifacts are better removed by assuming the pattern to be the same exponential function in every affected column and subtracting the median of the pixels in each row of those columns. Affected readout channels were flagged manually and the median of each row in those columns was saved as a new correction matrix. This matrix was subtracted from the muxbleed/muxstriped-removed image.
The pulldown always occurs in the same column as the core of the target star, and is different above and below the star. When the core of the target star falls within 0.25 pixels of the boundary between pixels, the pulldown occurs on two adjacent columns. We modeled the pulldown as the median of the column(s) containing the target star, top and bottom separately, then saved it as a third correction matrix.
At this point, we added the previous three correction matrices together to obtain a complete matrix of the pixel-dependent electronic artifacts in each BCD (result shown in Figure 2, panel c). Subtracting this matrix from the PSF-subtracted image gives us a visual check to show all artifacts have been removed (Figure 2, panel d).
To mitigate contamination from residual artifacts in our PSFs, we subtracted the artifact correction matrix for each image from its BCD and remade new PSFs from the result. Because all pixel dependency had been removed, and because all stars were observed with the same dither pattern, the individual dither images could then be co-added to create sub-sampled images and PSFs. We co-added the artifact-cleaned images at subsampling (/pix), then created a PSF for each star using the process described in Section 3.1 using the other sub-sampled images (again omitting 55 Cnc and the star itself). With nine spatially distinct dither positions, each pixel can be sub-sampled into at most nine (33) sub-pixels, so after subtracting each star’s model PSF from its final mosaic, we rebinned the images back to sub-sampling () for analysis (Figures 3 & 4).
Combining these images with those from PID 30666, we created and released a /pix subarray PSF, available at the Spitzer Science Center website.
3.3. Source detection and photometry
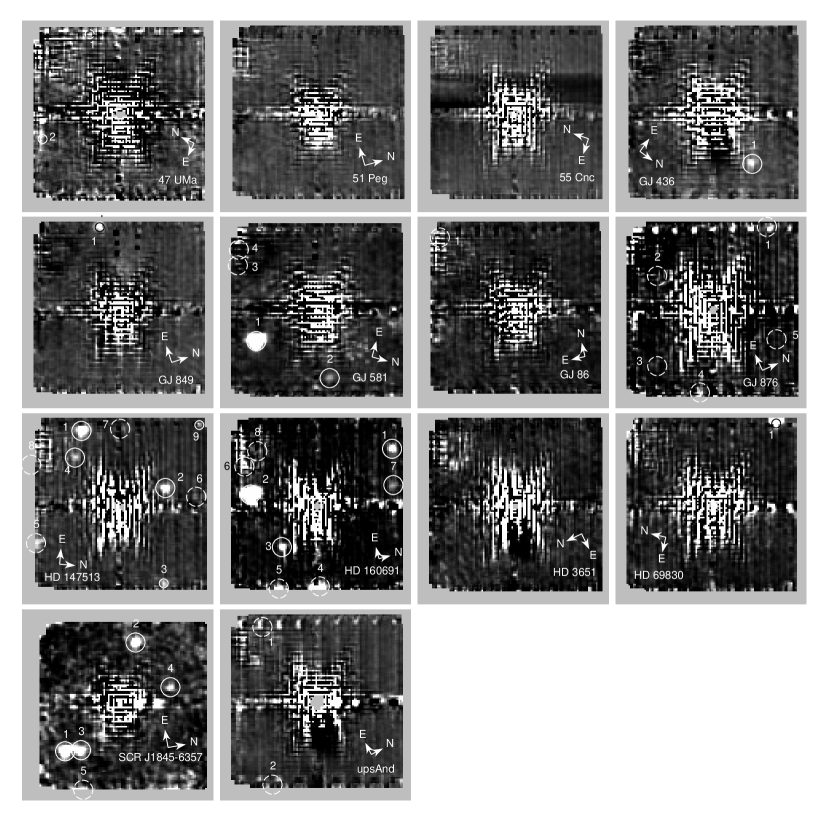
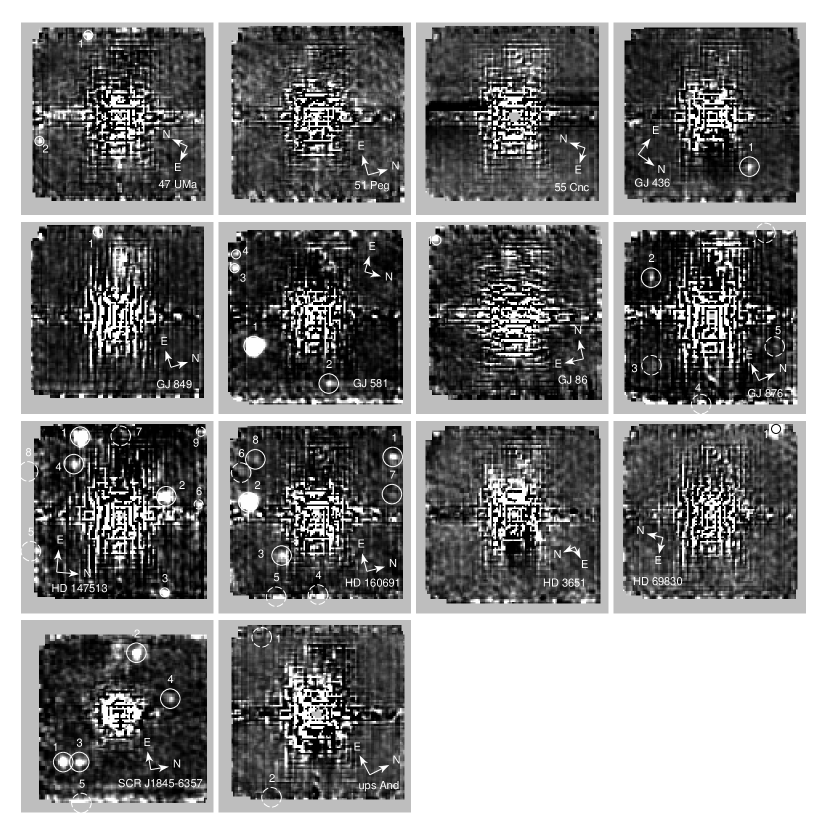
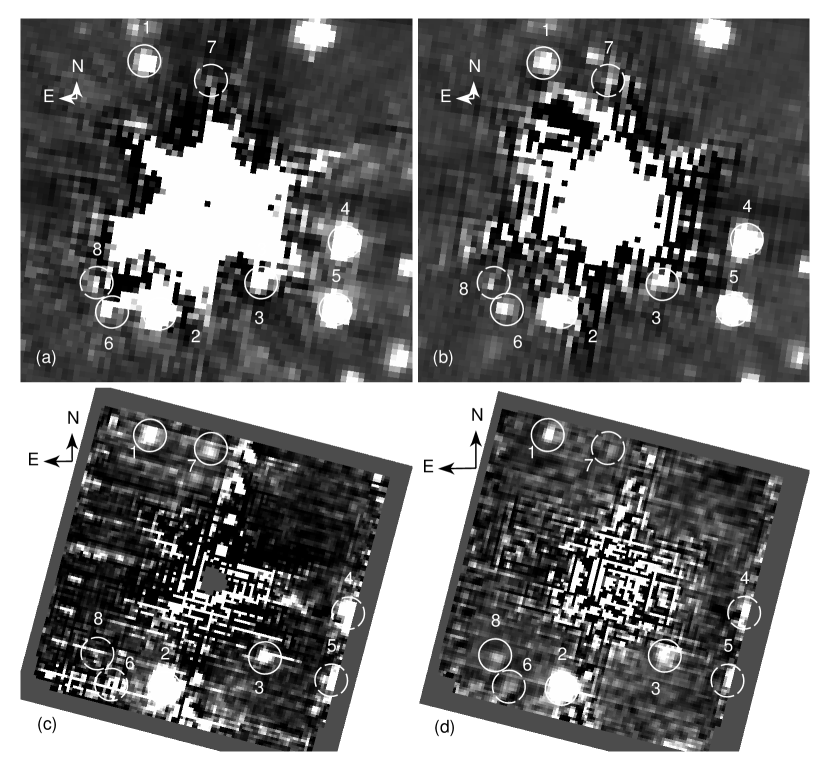
Once the PSF and electronic artifacts are removed and the images are co-added, other sources become readily visible (see Figures 3 & 4). Given the small number of sources in each image, we visually inspected each and measured the photometry of every area that seemed brighter than the background, using a custom procedure based on DAOPHOT. We used an aperture radius of two IRAC pixels (2.44′′) where possible, or one (1.22′′) for sources near the edge of the final images. Sky annuli were chosen to fit the background while avoiding excessive PSF subtraction noise for the typical source, and had an inner radius of 3.17′′ (1.59′′) with an outer radius of 5.12′′ (2.56′′) for the larger (smaller) apertures. Aperture corrections were calculated as the difference in magnitudes between the flux inside each aperture listed above versus the flux inside a 10-IRAC-pixel aperture placed on a Vega-scaled PSF. These corrections in 4.5 m are mag for the larger aperture, mag for the smaller. Any source calculated to have a local signal-to-noise ratio less than 3 was rejected. All sources detected in 3.6 m and 4.5 m are shown Figures 3 and 4, respectively. Table LABEL:sourcephot shows the aperture-corrected photometry of all detected sources in the frame of each target star. For sources detected in only one band, the limiting magnitude at that location in the other band is given as a photometric upper limit. Four objects (47 UMa-1, HD 160691-8, GJ 86-1, and GJ 581-3) have potential colors that can be as red as a T5 or later brown dwarf, due to non-detections in 3.6 m.
The subarray field of view is too small for the analysis pipeline to perform automatic pointing refinement. No subarray frames had sufficient 2MASS sources to perform manual astrometric calibration, and our observations were taken before the “peak up” function was available. Therefore, the accuracy by which the WCS coordinates are known is limited by Spitzer’s star tracker, plus pointing drift, which is especially important for short exposures like subarray mode, and jitter; the combination of these is on the order of 1′′. We performed relative astrometry on each source by computing its centroid and calculating the distance and position angle relative to the centroid of the central source (Table LABEL:sourcephot). Because the PSF is pixelated and has internal structure, the centroid can converge in a slightly different location depending on the subsampling of the PSF due to the source falling on different parts of a pixel. To calculate the error of our relative astrometry, we randomly shifted our 0.24′′/pix model PSF 1000 times, each time rebinning to 0.407′′/pix and comparing the known shift to the difference in measured centroids. The average of the resulting distribution is 0.05 pixels, or 0.02′′. This represents the best-case radial distance error for high signal-to-noise, isolated sources. For more crowded, dim sources, the convergence point of the centroid also depends on the initial guess. To calculate this error, we randomly picked 1000 starting locations within a radius of 2.1 pixels (half the FWHM of IRAC’s band 2 at 0.407′′/pix) around each source, and calculated the centroid using a box size of 6 pix. This produced a distribution of between 1 and 6 “centroids.” We report the center of the distribution as the source position and the RMS spread as the initial-guess error. This error was on the order of 0.1′′ and was added in quadrature with the PSF-discretization error to find our total relative astrometry error, reported per source in Table LABEL:sourcephot.
3.4. Full-frame Analysis
To supplement and confirm our subarray results, we performed follow-up photometry for all stars that had full-frame images available in the Spitzer Heritage Archive (listed in “full” columns of Table LABEL:sourcephot). These observations were performed with 30-second frame times and 5 Gaussian dithers. We used IRACproc to create mosaics and subtract the target stars’ PSFs, then we performed aperture photometry. To isolate the typical source from artifacts and other sources of noise, we used a 2.83′′ aperture radius, with a sky annulus from 2.83′′ to 4.72′′ on all sources visible within the subarray-equivalent field of view. We restricted our analysis to this region because everything outside the subarray field of view in the full frame images had already been discounted by a previous proper motion search for widely separated companions without PSF subtraction (patten05).
Several sources detected in subarray images were found to have counterparts in the full-frame images, including sources near the edge of the subarray frame that we originally thought to be noise (see sources at the edges of HD 160691, HD 147513, and SCR J1845-6357). Some sources appearing in full-frame images were below the sensitivity of the subarray images. As expected, sources detected near the target star in subarray were overwhelmed by PSF residual noise in the full-frame images, notably HD 147513-2, SCR J1845-6357-2, and GJ 876-7. Figure 5 shows a comparison of objects seen in the subarray field of view between subarray and full-frame images for one parent star.
Taking the lowest-error photometry in each band from either subarray or full frame, and assuming all of these sources to be at the same distance as their parent star, we plotted their [3.6][4.5] color versus 4.5 m absolute magnitude (see Figure 6) to compare with model substellar-mass objects of various temperatures (burrows02) and previously detected L and T dwarfs (patten06).

4. Sensitivity
We calculated sensitivity limits for each of our targets as a function of projected distance from the central star. Our photometric sensitivity at any location within an image is limited by the local noise level around that point. The noise level within the frame is generally highest at the location of the target star and decreases radially outward, but with azimuthal deviations due to PSF spikes and other features. We generated azimuthally averaged sensitivity curves, giving the Noise-Equivalent Flux Density (NEFD) for given radial distances from the target star (Figures 7 and 8). We calculated the NEFD in each point of the PSF-subtracted image as the total RMS noise flux over an aperture with diameter equal to the FWHM of the stellar PSF (1.66′′ for 3.6 m, 1.72′′ for 4.5 m). Overlaid on these plots are the estimated magnitudes of planets with different masses, derived from non-irradiated extrasolar planet models with a given age from burrows02, scaled to the distance of the primary star. The only models available from burrows02 for ages comparable to our objects are 1, 3, and 5 Gyr, so we chose the model age closest to the age of each star. For ages greater than 5 Gyr, we used the 5 Gyr model, though this underestimates the mass of potential companions. The age we used for the model is listed with the star’s estimated true age above each plot.


Also available were the BT-SETTL models by Allard et al. (2011), which have a greater range of available ages, but much higher lower limit of MJ for all but the youngest isochrones, making them insufficient to match our sensitivity. We compared the Burrows and Allard models for the same object age and found they give comparable magnitudes for a given object mass. For the smallest BT-SETTL object available for the 10 Gyr isochrone, 63 MJ, the difference in 4.5 m model magnitude from 5 to 10 Gyr is 0.42. Less-massive objects should have lost more of their primordial heat by the time they reach 5 Gyr old, thus they would be expected to dim by less than this amount over the following 5 Gyr, so we feel confident that we are not significantly overestimating our mass sensitivity for objects older than 5 Gyr.
Our best sensitivity occurs for nearby, young systems like SCR J1845-6357, where we detected no 5 MJ objects at projected separations between 25-80 au from its parent, and GJ 876, for which our limit is of a 6 MJ object at projected separations from 50-100 au. For the older, more distant stars like And, 55 Cnc, and 51 Peg, we detected no objects greater than 25 MJ between projected separations of roughly 200-300 au, with the caution that our mass model sensitivity is overestimated for systems older than 5 Gyr. Our lower-limit sensitivity around the remaining stars varies from 7 to 15 MJ in the range of projected separations of 50 to 250 au.
5. Color-Selected Companion Candidates
5.1. 47 UMa-1
47 UMa has three previously confirmed RV planets of roughly Jupiter mass (gregory10). The outermost, 47 UMa d, has the highest eccentricity of the three (e=0.16). This suggested eccentricity level is difficult to explain without an external perturber. Our subarray observations revealed 47 UMa-1, a source that appears in 4.5 m only, and has upper limit colors ([3.6]-[4.5] and M[4.5]=14.7) comparable to a brown dwarf at the distance of the primary. If the object is a bound companion, it would be located at a projected separation of 300 au (22′′) from 47 UMa. If it is not bound, its color indicates it may be a background red giant or galaxy (reiter14; stern07).
We found archival full frame observations of 47 UMa, performed Apr 20, 2004 as part of PID 347513231. 47 UMa-1 was detected in the full-frame images but is unfortunately directly on top of a strong pulldown artifact in both bands. Full frame photometry confirms this object to be more than a magnitude red in [3.6]-[4.5]. Assuming it to be at the same distance as 47 UMa gives it [3.6]-[4.5] vs. M[4.5] coordinates matching a T5 dwarf, with a model mass of (see Figure 6).
Another full-frame observation of 47 UMa (4.5 m only) was made Dec 23, 2008 (PID 332319740), so we attempted to verify common proper motion. We measured the proper motion of 118 sources surrounding 47 UMa to compare to the motion of source 1 and the expected position change of the primary over the 4.67 years between the two observations (Figure 9). The measured position change of 47 UMa-1 is more than 3 from that expected of 47 UMa, making it unlikely to be a co-moving companion.

The other source in the same frame, 47 UMa-2, was affected too much by artifacts in both full frame archival epochs to obtain reliable photometry or proper motion. Undetected objects at projected separations between 200-350 au are constrained to have a model dependent mass less than 15 MJ, with the caveat that we used the 5 Gyr model for this 7.4-Gyr-old star.
5.2. HD 160691-8
The four known RV planets of the HD 160691 system all have e0.1 (pepe07). koriski11 noted that this system has a 2/1 period commensurability, which could indicate mean motion resonance, which in turn could explain the eccentricities of the system without invoking an external body. We found one source, HD 160691-8, with only an upper limit color, potentially similar to a T7 dwarf with mass near 25 MJ. If a bound companion, it would be located at a projected separation of 300 au (21′′) from HD 160691. In the full-frame images taken Sept 9, 2004 (PID 240828495), this source lies directly on top of PSF spike residuals (see Figure 5), so we were not able to calculate its full-frame photometry.
We found a model-dependent upper mass limit of 25 MJ for unseen objects at a projected distance between 200 and 400 au from the primary.
5.3. GJ 581-3
Of the four known RV planets around GJ 581, the outermost two, GJ 581d and GJ 581e, have e=0.205 and e=0.32, respectively (forveille11). baluev12 claims that the existence of planet d is questionable but confirms b, c, and e. Planet e is the least massive of the four (respectively, they are 0.05 MJ, 0.017 MJ, 0.019 MJ, and 0.0061 MJ), so it may be likely that some earlier scattering event led to its current orbit.
If GJ 581-3 is a bound object, its 4.5 m flux implies it would be a Y dwarf, with model mass of 7-10 MJ, located at a projected separation of 150 au (23′′) from GJ 581. We found no objects with mass between projected separations of 75-150 au from the primary. Our mass limits for this star are underestimates: our oldest mass model was 5 Gyr and this star has an age of 8.5 Gyr. GJ 581 had no available archival full-frame observations.
5.4. GJ 86-1
GJ 86 has one marginally detected source in the very corner (26′′ from center) of the 4.5 m subarray frame. This source is not detected at 3.6 m, due to strong PSF-subtraction residuals caused by the IRAC filter “ghost.” Nevertheless, the limiting sensitivity at that location ([3.6]14.94) implies a color [3.6]-[4.5]0.9. If the source is a bound companion at the distance of the primary, its 4.5 m magnitude and color limit would be consistent with a T7 dwarf. However, the high level of noise, even in the 4.5 m frame, suggests the source to be a spurious detection. We attempted to measure full-frame photometry of GJ 86-1, but both its WCS-coordinate location and where it would be if it shared common proper motion with GJ 86 are overwhelmed by the pulldown in the full frame.
5.5. HD 69830-1
The only source detected near HD 69830 is cut off at the edge of the frame. Its estimated photometry puts it at the [3.6]-[4.5] color boundary between stars and T-dwarfs (Figure 6). There were no full-frame archival observations of this object in order to obtain better IRAC photometry, but it does have 2MASS photometry available. HD 69830 has visibly moved between the 2MASS epoch and our observations taken in Nov 2007, but HD 69830-1 has not, so they do not share common proper motion.
tanner10 reported a candidate M companion around HD 69830, with relative coordinates (pointing angle, separation) of -152.5, 9.99′′ and K=15.46. Assuming its K magnitude to be similar to [3.6], this object is just below our sensitivity at that position (see Figure 7).
6. Discussion and Summary
Using the combined photometry from our subarray images and the available archival full-frame images, we found four potentially interesting candidates: one with matching brown dwarf colors and three objects with compatible [3.6][4.5] color lower limits. In absence of common proper motion confirmation, we are unable to determine if these candidates are true companions, or unrelated background quasars or mass-losing giants (see stern07; reiter14 for typical colors of background red sources). This ambiguity could, in principle, be resolved by acquiring JHK photometry (see marengosanchez09), albeit new near-IR data capable of detecting these objects would also likely provide accurate astrometry, sufficient to test for common proper motion.
We presented details of our PSF- and artifact-subtraction procedure, in which we were able to automatically co-align images within 0.0027′′ for purposes of PSF subtraction and effective removal of electronic artifacts. As anticipated, subarray observations allowed a smaller inner working angle than full-frame observations of the same field of view, which were dominated by PSF subtraction residuals.
For all stars, we calculated upper limits on unseen T- or Y-dwarfs within the mass and projected semi-major axis ranges given in Figures 7 and 8. Outside of 10′′ from most sources, our sensitivity is in the range of 10 MJ. Our best sensitivity is for close, young stars like GJ 849 (5 MJ) and SCRJ 1849-6357 (). Our worst sensitivity (25 MJ) was for And due to its brightness: artifacts overwhelmed the image.
We could not confirm the existence of any new wide planetary or brown dwarf companions around the stars in our sample. We have ruled out a section of parameter space, but there is a degeneracy for perturbers between mass and semi-major axis. It is still possible for less-massive companions closer than our inner working angle to exist (ongoing systematic searches with new ground-based adaptive optics systems will explore the remaining parameter space), or there could be some other reason for the measured high eccentricities of planets in those systems.
Follow up observations are necessary for HD 160691-8, GJ 86-1, and GJ 581-3 to obtain 3.6 m photometry and check for common proper motion. If the candidates are confirmed, numerical simulations will be necessary to determine whether they can account for the high eccentricities of planets in their respective systems.
References
- Abt (2009) Abt, H. A. 2009, ApJS, 180, 117A.
- Allard et al. (2011) Allard, F., Homeier, D., & Freytag, B. 2011, ASP Conference Series, 448, 91.
- Amara & Quanz (2012) Amara, A. & Quanz, S. 2012, MNRAS, 427, 2, 948.
- Anglada-Escudé et al. (2010) Anglada-Escudé, G., Ló˝́pez-Morales, M., & Chambers, J. E. 2010, ApJ, 709, 168. \par\@@lbibitem{ashby09}\NAT@@wrout{5}{2009}{Ashby et al.}{}{Ashby et al. (2009)}{ashby09}\lx@bibnewblock Ashby, M. L. N., Stern, D., Brodwin, M., et al. 2009, ApJ, 701, 428. \par\@@lbibitem{baluev12}\NAT@@wrout{6}{2012}{Baluev}{}{Baluev (2012)}{baluev12}\lx@bibnewblock Baluev, R. V. Accepted 2012, MNRAS. \par\@@lbibitem{barnes11}\NAT@@wrout{7}{2011}{Barnes et al.}{}{Barnes et al. (2011)}{barnes11}\lx@bibnewblock Barnes, R., Greenberg, R., Quinn, T., McArthur, B., & Benedict, F. 2011, ApJ, 726, 71. \par\@@lbibitem{beichman05}\NAT@@wrout{8}{2005}{Beichman et al.}{}{Beichman et al. (2005)}{beichman05}\lx@bibnewblock Beichman, C. A., Bryden, G., Gautier, T. N., et al. 2005, ApJ, 626, 2, 1061. \par\@@lbibitem{bergfors13}\NAT@@wrout{9}{2013}{Bergfors et al.}{}{Bergfors et al. (2013)}{bergfors13}\lx@bibnewblock Bergfors, C., Brandner, W., Daemgen, S., et al. 2013, MNRAS, 428, 182. \par\@@lbibitem{biller06}\NAT@@wrout{10}{2006}{Biller et al.}{}{Biller et al. (2006)}{biller06}\lx@bibnewblock Biller, B., Kasper, M., Close, L., Brandner, W., & Kellner, S. 2006, ApJ, 641, L141. \par\@@lbibitem{bonfils12}\NAT@@wrout{11}{2012}{Bonfils et al.}{}{Bonfils et al. (2012)}{bonfils12}\lx@bibnewblock Bonfils, X., Delfosse, X., Udry, S., et al. 2012, arXiv:1111.5019v2. \par\@@lbibitem{boss97}\NAT@@wrout{12}{1997}{Boss}{}{Boss (1997)}{boss97}\lx@bibnewblock Boss, A. P. 1997, Science, 276, 5320. \par\@@lbibitem{boss06}\NAT@@wrout{13}{2006}{Boss}{}{Boss (2006)}{boss06}\lx@bibnewblock Boss, A. P., 2006, ApJ, 637, L137. \par\@@lbibitem{burrows02}\NAT@@wrout{14}{2002}{Burrows et al.}{}{Burrows et al. (2002)}{burrows02}\lx@bibnewblock Burrows, A., Burgasser, A. J., Kirkpatrick, J. D., et al. 2002, ApJ, 573, 394. \par\@@lbibitem{burrows03}\NAT@@wrout{15}{2003}{Burrows et al.}{}{Burrows et al. (2003)}{burrows03}\lx@bibnewblock Burrows, A., Sudarsky, D., & Lunine, J. I. 2003, ApJ, 596, 587. \par\@@lbibitem{butler06}\NAT@@wrout{16}{2006}{Butler et al.}{}{Butler et al. (2006)}{butler06}\lx@bibnewblock Butler, R. P., Johnson, J. A., Marcy, G. W., et al. 2006, PASP, 118, 850, 1685. \par\@@lbibitem{carson11}\NAT@@wrout{17}{2011}{Carson et al.}{}{Carson et al. (2011)}{carson11}\lx@bibnewblock Carson, J., Marengo, M., Patten, B.M., et al. 2011, ApJ, 743, 141. \par\@@lbibitem{carson13}\NAT@@wrout{18}{2013}{Carson et al.}{}{Carson et al. (2013)}{carson13}\lx@bibnewblock Carson, J., Thalmann, C., Janson, M., et al. 2013, ApJ, 763, 2, L32. \par\@@lbibitem{chauvin05}\NAT@@wrout{19}{2005}{Chauvin et al.}{}{Chauvin et al. (2005)}{chauvin05}\lx@bibnewblock Chauvin, G., Lagrange, A. M., Zuckerman, B., et al. 2005, A&A, 438, 3, L29. \par\@@lbibitem{correia10}\NAT@@wrout{20}{2010}{Correia et al.}{}{Correia et al. (2010)}{correia10}\lx@bibnewblock Correia, A., Couetdic, J., Laskar, J., et al. 2010, A&A, 511, A21. \par\@@lbibitem{curiel10}\NAT@@wrout{21}{2010}{Curiel et al.}{}{Curiel et al. (2010)}{curiel10}\lx@bibnewblock Curiel, S., Canto, J., Georgiev, L., Chavez, C., & Poveda, A. 2010, A&A, 525, A78. \par\@@lbibitem{deacon05}\NAT@@wrout{22}{2005}{Deacon et al.}{}{Deacon et al. (2005)}{deacon05}\lx@bibnewblock Deacon, N. R., Hambly, N. C., & Cooke, J. A. 2005, A&A, 435, 363D. \par\@@lbibitem{deming07}\NAT@@wrout{23}{2007}{Deming et al.}{}{Deming et al. (2007)}{deming07}\lx@bibnewblock Deming, D., Harrington, J., Laughlin, G., et al. 2007, ApJ, 667, L199. \par\@@lbibitem{demory12}\NAT@@wrout{24}{2012}{Demory et al.}{}{Demory et al. (2012)}{demory12}\lx@bibnewblock Demory, B. O., Gillon, M., Seager, S., et al. 2012, ApJ, 751, L28. \par\@@lbibitem{ESA97}\NAT@@wrout{25}{1997}{ESA}{}{ESA (1997)}{ESA97}\lx@bibnewblock ESA 1997, VizieR Online Data Catalog, 1239, 0. \par\@@lbibitem{fazio04}\NAT@@wrout{26}{2004}{Fazio et al.}{}{Fazio et al. (2004)}{fazio04}\lx@bibnewblock Fazio, G. G., Hora, J. L., Allen L. E., et al. 2004, ApJS, 154, 10. \par\@@lbibitem{faherty09}\NAT@@wrout{27}{2009}{Faherty et al.}{}{Faherty et al. (2009)}{faherty09}\lx@bibnewblock Faherty, J.K., Burgasser, A.J., Cruz, K.L., et al. 2009, AJ, 137, 1F. \par\@@lbibitem{fischer03}\NAT@@wrout{28}{2003}{Fischer et al.}{}{Fischer et al. (2003)}{fischer03}\lx@bibnewblock Fischer D., Butler P., Marcy G., et al. 2003, ApJ, 590, 1081. \par\@@lbibitem{fischer08}\NAT@@wrout{29}{2008}{Fischer et al.}{}{Fischer et al. (2008)}{fischer08}\lx@bibnewblock Fischer, D., Marcy, G., Butler, P., et al. 2008, ApJ, 675, 790. \par\@@lbibitem{ford08}\NAT@@wrout{30}{2008}{Ford \& Rasio}{}{Ford \& Rasio (2008)}{ford08}\lx@bibnewblock Ford, E. B. & Rasio, F. A. 2008, ApJ, 686, 621. \par\@@lbibitem{forveille11}\NAT@@wrout{31}{2011}{Forveille et al.}{}{Forveille et al. (2011)}{forveille11}\lx@bibnewblock Forveille, Th., Bonfils, X., Delfosse, X., et al. 2011, arXiv:1109.2505v1. \par\@@lbibitem{fuhrmann97}\NAT@@wrout{32}{1997}{Fuhrmann et al.}{}{Fuhrmann et al. (1997)}{fuhrmann97}\lx@bibnewblock Fuhrmann, K., Pfeiffer, M., & Bernkopf, J., 1997, A&A, 326, 1081. \par\@@lbibitem{fuhrmann98}\NAT@@wrout{33}{1998}{Fuhrmann et al.}{}{Fuhrmann et al. (1998)}{fuhrmann98}\lx@bibnewblock Fuhrmann, K., Pfeiffer, M., & Bernkopf, J., 1998, A&A, 336, 942. \par\@@lbibitem{ginski12}\NAT@@wrout{34}{2012}{Ginski et al.}{}{Ginski et al. (2012)}{ginski12}\lx@bibnewblock Ginski, C., Mugrauer, M., Seeliger, M., & Eisenbeiss, T. 2012, MNRAS, 421, 2498. \par\@@lbibitem{gizis01}\NAT@@wrout{35}{2001}{Gizis et al.}{}{Gizis et al. (2001)}{gizis01}\lx@bibnewblock Gizis, J. E., Kirkpatrick, J. D., Burgasser, A., et al. 2001, ApJ, 551, L163. \par\@@lbibitem{gray06}\NAT@@wrout{36}{2006}{Gray et al.}{}{Gray et al. (2006)}{gray06}\lx@bibnewblock Gray, R. O., Corbally, C. J., Garrison, R. F., et al. 2006, AJ, 132, 161G. \par\@@lbibitem{gregory10}\NAT@@wrout{37}{2010}{Gregory et al.}{}{Gregory et al. (2010)}{gregory10}\lx@bibnewblock Gregory, P. C. & Fischer, D. A., 2010, MNRAS, 403, 731G. \par\@@lbibitem{hinz06}\NAT@@wrout{38}{2006}{Hinz et al.}{}{Hinz et al. (2006)}{hinz06}\lx@bibnewblock Hinz, P. M., Heinze, A. N., Sivanandam, S., et al. 2006, ApJ, 653, 2, 1486. \par\@@lbibitem{hora08}\NAT@@wrout{39}{2008}{Hora et al.}{}{Hora et al. (2008)}{hora08}\lx@bibnewblock Hora, J. L., Carey, S., & Surace, J. 2008, PASP, 120, 1233. \par\@@lbibitem{hubeny07}\NAT@@wrout{40}{2007}{Hubeny \& Burrows}{}{Hubeny \& Burrows (2007)}{hubeny07}\lx@bibnewblock Hubeny, I. & Burrows, A. 2007, ApJ, 669, 1248. \par\@@lbibitem{jenkins09}\NAT@@wrout{41}{2009}{Jenkins et al.}{}{Jenkins et al. (2009)}{jenkins09}\lx@bibnewblock Jenkins, J. S., Ramsey, L. W., Jones, H. R. A., et al. 2009, ApJ, 704, 975. \par\@@lbibitem{kasper07}\NAT@@wrout{42}{2007}{Kasper et al.}{}{Kasper et al. (2007)}{kasper07}\lx@bibnewblock Kasper, M., Biller, B. A., Burrows, A., et al. 2007, A&A, 471, 2. \par\@@lbibitem{kirkpatrick11}\NAT@@wrout{43}{2011}{Kirkpatrick et al.}{}{Kirkpatrick et al. (2011)}{kirkpatrick11}\lx@bibnewblock Kirkpatrick, J. D., Cushing, M. C., Gelino, C. R., et al. 2011, ApJS, 197, 19. \par\@@lbibitem{koriski11}\NAT@@wrout{44}{2011}{Koriski \& Zucker}{}{Koriski \& Zucker (2011)}{koriski11}\lx@bibnewblock Koriski S. & Zucker S. 2011, ApJ, 741, L23. \par\@@lbibitem{kozai62}\NAT@@wrout{45}{1962}{Kozai}{}{Kozai (1962)}{kozai62}\lx@bibnewblock Kozai, Y. 1962, AJ, 67, 9. \par\@@lbibitem{lafreniere07}\NAT@@wrout{46}{2007}{Lafreni\`{e}re et al.}{}{Lafreni\`{e}re et al. (2007)}{lafreniere07}\lx@bibnewblock Lafrenière D., Marois C., Doyon R., Nadeau D., & Artigau E. 2007, ApJ, 660, 770. \par\@@lbibitem{lee02}\NAT@@wrout{47}{2002}{Lee \& Peale}{}{Lee \& Peale (2002)}{lee02}\lx@bibnewblock Lee, M.H. & Peale, S.J. 2002, ApJ, 567, 596. \par\@@lbibitem{lovis06}\NAT@@wrout{48}{2006}{Lovis et al.}{}{Lovis et al. (2006)}{lovis06}\lx@bibnewblock Lovis, C., Mayor, M., Pepe, F., et al. 2006, Nature, 441, 305. \par\@@lbibitem{luhman07}\NAT@@wrout{49}{2007}{Luhman et al.}{}{Luhman et al. (2007)}{luhman07}\lx@bibnewblock Luhman, K. L., Patten, B. M., Marengo, M., et al. 2007, ApJ, 654, 570. \par\@@lbibitem{macintosh03}\NAT@@wrout{50}{2003}{Macintosh et al.}{}{Macintosh et al. (2003)}{macintosh03}\lx@bibnewblock Macintosh, B. A., Becklin, E. E., Kaisler, D., Konopacky, Q., & Zuckerman B. 2003, ApJ, 594, 1, 538. \par\@@lbibitem{MOPEX}\NAT@@wrout{51}{2005}{Makovoz \& Khan}{}{Makovoz \& Khan (2005)}{MOPEX}\lx@bibnewblock Makovoz, D., & Khan, I. 2005, in ASP Conf. Ser. 132, Astronomical Data Analysis Software and Systems XIV, ed. P. L. Shopbell, M. C. Britton, & R. Ebert (San Francisco: ASP). \par\@@lbibitem{mamajek08}\NAT@@wrout{52}{2008}{Mamajek and Hillenbrand}{}{Mamajek and Hillenbrand (2008)}{mamajek08}\lx@bibnewblock Mamajek, E. E. & Hillenbrand, L. A. 2008, ApJ, 687, 2, 1264. \par\@@lbibitem{maness07}\NAT@@wrout{53}{2007}{Maness et al.}{}{Maness et al. (2007)}{maness07}\lx@bibnewblock Maness, H. L., Marcy, G. W., Ford, E. B., et al. 2007, PASP, 119, 90. \par\@@lbibitem{marcy97}\NAT@@wrout{54}{1997}{Marcy et al.}{}{Marcy et al. (1997)}{marcy97}\lx@bibnewblock Marcy, G., Butler, P., Williams, E., et al. 1997, ApJ, 481, 926. \par\@@lbibitem{marcy05}\NAT@@wrout{55}{2005}{Marcy et al.}{}{Marcy et al. (2005)}{marcy05}\lx@bibnewblock Marcy, G., Butler, R. P., Fischer, D., et al. Progress of Theoretical Physics Supplement, 158, 24. \par\@@lbibitem{marengo06}\NAT@@wrout{56}{2006}{Marengo et al.}{}{Marengo et al. (2006)}{marengo06}\lx@bibnewblock Marengo, M., Megeath, S. T., Fazio, G. G., et al. 2006, ApJ, 647, 1437. \par\@@lbibitem{marengo09}\NAT@@wrout{57}{2009}{Marengo et al.}{}{Marengo et al. (2009)}{marengo09}\lx@bibnewblock Marengo, M., Stapelfeldt, K., Werner, M. W., et al. 2009, ApJ, 700, 1647. \par\@@lbibitem{marengosanchez09}\NAT@@wrout{58}{2009}{Marengo \& Sanchez}{}{Marengo \& Sanchez (2009)}{marengosanchez09}\lx@bibnewblock Marengo, M. & Sanchez, M. 2009, AJ, 38, 63. \par\@@lbibitem{marois10}\NAT@@wrout{59}{2010}{Marois et al.}{}{Marois et al. (2010)}{marois10}\lx@bibnewblock Marois, C., Zuckerman, B., Konopacky, Q. M., Macintosh, B., & Barman, T. 2010, Nature, 468, 1080. \par\@@lbibitem{marzari02}\NAT@@wrout{60}{2002}{Marzari \& Weidenschilling}{}{Marzari \& Weidenschilling (2002)}{marzari02}\lx@bibnewblock Marzari, F. & Weidenschilling, S. J. 2002, Icarus, 156, 2. \par\@@lbibitem{mayor04}\NAT@@wrout{61}{2004}{Mayor et al.}{}{Mayor et al. (2004)}{mayor04}\lx@bibnewblock Mayor, M., Udry, S., Naef, D., et al. 2004, A&A, 415, 391. \par\@@lbibitem{metchev03}\NAT@@wrout{62}{2003}{Metchev et al.}{}{Metchev et al. (2003)}{metchev03}\lx@bibnewblock Metchev, S. A., Hillenbrand, L. A., & White, R. J. 2003, ApJ, 582, 1102. \par\@@lbibitem{monson12}\NAT@@wrout{63}{2012}{Monson et al.}{}{Monson et al. (2012)}{monson12}\lx@bibnewblock Monson, A. J., Freedman, W. L., Madore, B. F., et al. 2012, ApJ, 759, 146. \par\@@lbibitem{montes01}\NAT@@wrout{64}{2001}{Montes et al.}{}{Montes et al. (2001)}{montes01}\lx@bibnewblock Montes, D., Lopez-Santiago, J., Galvez, M. C., et al. 2001, MNRAS, 328, 45M. \par\@@lbibitem{M}\NAT@@wrout{65}{}{}{}{(65)}{M}\lx@bibnewblockugrauer & Neuhä˝̈user(2005)]mugrauer05 Mugrauer, M. & Neuhäuser, R. 2005, MNRAS, 361, L15. \par\@@lbibitem{mugrauer06}\NAT@@wrout{66}{2006}{Mugrauer et al.}{}{Mugrauer et al. (2006)}{mugrauer06}\lx@bibnewblock Mugrauer, M., Seifahrt, A., Neuhäuser, R., & Mazeh, T. 2006, MNRAS, 373, 1, L31. \par\@@lbibitem{nagasawa11}\NAT@@wrout{67}{2011}{Nagasawa \& Ida}{}{Nagasawa \& Ida (2011)}{nagasawa11}\lx@bibnewblock Nagasawa, M., & Ida, S. (2011). ApJ, 742, 72. \par\@@lbibitem{naoz11}\NAT@@wrout{68}{2011}{Naoz et al.}{}{Naoz et al. (2011)}{naoz11}\lx@bibnewblock Naoz, S., Farr, W. M., Lithwick, Y., Rasio, F. A., & Teyssandier, J. 2011, Nature, 473, 187. \par\@@lbibitem{neuhauser05}\NAT@@wrout{69}{2005}{Neuh\"{a}user et al.}{}{Neuh\"{a}user et al. (2005)}{neuhauser05}\lx@bibnewblock Neuhä user, R., Guenther, E. W., Wuchterl, G., et al. 2005, A&A, 435, L13. \par\@@lbibitem{oppenheimer01}\NAT@@wrout{70}{2001}{Oppenheimer et al.}{}{Oppenheimer et al. (2001)}{oppenheimer01}\lx@bibnewblock Oppenheimer, B. R., Golimowski, D. A., Kulkarni, S. R., et al. 2001, ApJ, 121, 2189. \par\@@lbibitem{patten05}\NAT@@wrout{71}{2005}{Patten et al.}{}{Patten et al. (2005)}{patten05}\lx@bibnewblock Patten, B. M., Luhman, K. L., Hora, J. L., et al. 2005, Protostars and Planets V, Proceedings of the Conference held October 24-28, 2005, in Hilton Waikoloa Village, Hawai’i. LPI Contribution No. 1286, p.8042. \par\@@lbibitem{patten06}\NAT@@wrout{72}{2006}{Patten et al.}{}{Patten et al. (2006)}{patten06}\lx@bibnewblock Patten, B. M., Stauffer, J. R., Burrows, A., et al. 2006, ApJ, 651, 1, 502. \par\@@lbibitem{pepe07}\NAT@@wrout{73}{2007}{Pepe et al.}{}{Pepe et al. (2007)}{pepe07}\lx@bibnewblock Pepe, F., Correia, A., Mayor, M., et al. 2007, A&A, 462, 769. \par\@@lbibitem{pollack96}\NAT@@wrout{74}{1996}{Pollack et al.}{}{Pollack et al. (1996)}{pollack96}\lx@bibnewblock Pollack, J. B., Hubickyj, O., Bodenheimer, P., et al. 1996, Icarus, 124, 190. \par\@@lbibitem{queloz00}\NAT@@wrout{75}{2005}{Queloz et al.}{}{Queloz et al. (2005)}{queloz00}\lx@bibnewblock Queloz, D., Mayor, M., Weber, L., et al. 2005, A&A, 354, 99. \par\@@lbibitem{reiter14}\NAT@@wrout{76}{2014}{Reiter et al.}{}{Reiter et al. (2014)}{reiter14}\lx@bibnewblock Reiter, M., Marengo, M., Hora, J. L. & Fazio, G. G. 2014, ApJ, submitted. \par\@@lbibitem{rivera10}\NAT@@wrout{77}{2010}{Rivera et al.}{}{Rivera et al. (2010)}{rivera10}\lx@bibnewblock Rivera, E., Laughlin, G., Butler, P., et al. 2010, ApJ, 719, 890. \par\@@lbibitem{roell12}\NAT@@wrout{78}{2012}{Roell et al.}{}{Roell et al. (2012)}{roell12}\lx@bibnewblock Roell, T., Neuhäuser, R., Seifahrt, A., & Mugrauer, M. 2012, A&A, 542, 92. \par\@@lbibitem{saffe05}\NAT@@wrout{79}{2005}{Saffe et al.}{}{Saffe et al. (2005)}{saffe05}\lx@bibnewblock Saffe, C., Gomez, M., & Chavero, C. 2005, A&A, 443, 609. \par\@@lbibitem{selsis07}\NAT@@wrout{80}{2007}{Selsis et al.}{}{Selsis et al. (2007)}{selsis07}\lx@bibnewblock Selsis, F., Kasting, J., Levrard, B., et al. 2007, A&A, 476, 1373. \par\@@lbibitem{2mass}\NAT@@wrout{81}{2006}{Skrutskie et al.}{}{Skrutskie et al. (2006)}{2mass}\lx@bibnewblock Skrutskie, M. F., Cutri, R. M., Stiening, R., et al. 2006, AJ, 131, 1163. \par\@@lbibitem{soummer12}\NAT@@wrout{82}{2012}{Soummer et al.}{}{Soummer et al. (2012)}{soummer12}\lx@bibnewblock Soummer, R., Pueyo, L., & Larkin, J. 2012, ApJ, 755, L28. \par\@@lbibitem{stern07}\NAT@@wrout{83}{2007}{Stern et al.}{}{Stern et al. (2007)}{stern07}\lx@bibnewblock Stern, D., Kirkpatrick, J. D., Allen, L. E., et al. 2007, ApJ, 663, 677. \par\@@lbibitem{takeda05}\NAT@@wrout{84}{2005}{Takeda \& Rasio}{}{Takeda \& Rasio (2005)}{takeda05}\lx@bibnewblock Takeda, G. & Rasio, F.A. 2005, ApJ, 627, 1001. \par\@@lbibitem{tanner10}\NAT@@wrout{85}{2010}{Tanner et al.}{}{Tanner et al. (2010)}{tanner10}\lx@bibnewblock Tanner, A. M., Gelino, C. R., & Law, N. M. 2010, PASP, 122, 896, 1195. \par\@@lbibitem{torres06}\NAT@@wrout{86}{2006}{Torres et al.}{}{Torres et al. (2006)}{torres06}\lx@bibnewblock Torres, C. A. O., Quast, G. R., Da Silva, L., et al. 2006, A&A, 460, 695T. \par\@@lbibitem{torres07}\NAT@@wrout{87}{2007}{Torres}{}{Torres (2007)}{torres07}\lx@bibnewblock Torres, G. 2007, ApJ, 671, L65. \par\@@lbibitem{vanleeuwen07}\NAT@@wrout{88}{2007}{Van Leeuwen}{}{Van Leeuwen (2007)}{vanleeuwen07}\lx@bibnewblock Van Leeuwen, F. 2007, A&A, 474, 653V. \par\@@lbibitem{vanbelle09}\NAT@@wrout{89}{2009}{Van Belle \& Von Braun}{}{Van Belle \& Von Braun (2009)}{vanbelle09}\lx@bibnewblock Van Belle, G.T. & Von Braun, K. 2009, ApJ, 694, 1085V. \par\@@lbibitem{vonbraun11}\NAT@@wrout{90}{2011}{von Braun et al.}{}{von Braun et al. (2011)}{vonbraun11}\lx@bibnewblock von Braun, K., Boyajian, T. S., Brummelaar, T. A. T., et al. 2011, ApJ, 740, 49. \par\@@lbibitem{wang11}\NAT@@wrout{91}{2011}{Wang \& Ford}{}{Wang \& Ford (2011)}{wang11}\lx@bibnewblock Wang, J., & Ford, E. 2011, MNRAS, 418, 1822. \par\@@lbibitem{werner04}\NAT@@wrout{92}{2004}{Werner et al.}{}{Werner et al. (2004)}{werner04}\lx@bibnewblock Werner, M. W., Roellig, T. L., Low, F. J., et al. 2004, ApJS, 154, 1. \par\@@lbibitem{wittenmyer13}\NAT@@wrout{93}{2013}{Wittenmyer et al.}{}{Wittenmyer et al. (2013)}{wittenmyer13}\lx@bibnewblock Wittenmyer, R., Wang, S., Horner, J., et al. 2013, ApJS, 208, 2. \par\@@lbibitem{wright09}\NAT@@wrout{94}{2009}{Wright et al.}{}{Wright et al. (2009)}{wright09}\lx@bibnewblock Wright, J., Upadhyay, S., Marcy, G., et al. 2009, ApJ, 693, 1084. \par\par\endthebibliography \par\par\par\par\par\par\par\par\par\par\par\par\par\par\LTX@newpage\begin{landscape} \par\begin{table} \@@toccaption{{\lx@tag[ ]{{3}}{Photometry of detected sources}}}\@@caption{{\lx@tag{{Table 3}}{Photometry of detected sources}}} {\begin{tabular}[\hline\cr\hline\cr\lx@intercol\hfilParent star\hfil\lx@intercol &\lx@intercol\hfilRef num\hfil\lx@intercol &\lx@intercol\hfilRA\hfil\lx@intercol &\lx@intercol\hfilDec\hfil\lx@intercol &\lx@intercol\hfilRad\hfil\lx@intercol &\lx@intercol\hfilPA\hfil\lx@intercol &\lx@intercol\hfilJ\hfil\lx@intercol &\lx@intercol\hfilH\hfil\lx@intercol &\lx@intercol\hfilK\hfil\lx@intercol &\lx@intercol\hfilSub[3.6]\hfil\lx@intercol &\lx@intercol\hfilSub[4.5]\hfil\lx@intercol &\lx@intercol\hfilFull[3.6]\hfil\lx@intercol &\lx@intercol\hfilFull[4.5]\hfil\lx@intercol \\ \hline\crGJ~{}876&1&22:53:18.216&-14:15:32.80&26.5$\pm$0.2${}^{\prime\prime}$&122.2$\pm$0.1$\arcdeg{}$&–&–&–&–&–&17.08$\pm$0.27&$>19.37$\\ GJ~{}876&2&22:53:18.254&-14:16:04.80&17.5$\pm$0.3${}^{\prime\prime}$&212.9$\pm$1.3$\arcdeg{}$&–&–&–&–&16.60$\pm$0.27&16.64$\pm$0.20&16.50$\pm$0.26\\ GJ~{}876&3&22:53:16.760&-14:16:14.49&20.7$\pm$0.4${}^{\prime\prime}$&291.8$\pm$0.6$\arcdeg{}$&–&–&–&–&–&17.25$\pm$0.29&17.09$\pm$0.37\\ GJ~{}876&4&22:53:16.049&-14:16:07.01&21.8$\pm$0.4${}^{\prime\prime}$&327.4$\pm$0.3$\arcdeg{}$&–&–&–&–&–&16.71$\pm$0.29&16.41$\pm$0.27\\ GJ~{}876&5&22:53:16.296&-14:15:45.50&17.5$\pm$0.3${}^{\prime\prime}$&34.4$\pm$0.3$\arcdeg{}$&–&–&–&$>18.38$&$>17.83$&14.92$\pm$0.13&17.01$\pm$0.32\\ HD~{}147513&1&16:24:02.914&-39:11:46.43&26.5$\pm$0.2${}^{\prime\prime}$&205.2$\pm$0.6$\arcdeg{}$&13.06&12.84&13.20&13.07$\pm$0.10&13.19$\pm$0.13&13.16$\pm$0.04&13.12$\pm$0.05\\ HD~{}147513&2&16:24:01.805&-39:11:23.93&13.4$\pm$0.2${}^{\prime\prime}$&123.4$\pm$0.2$\arcdeg{}$&–&–&–&13.85$\pm$0.10&13.64$\pm$0.12&–&–\\ HD~{}147513&3&16:23:59.686&-39:11:22.02&27.7$\pm$0.1${}^{\prime\prime}$&28.2$\pm$0.3$\arcdeg{}$&13.10&13.18&14.31&14.76$\pm$0.21&15.04$\pm$0.32&14.75$\pm$0.10&14.74$\pm$0.12\\ HD~{}147513&4&16:24:02.338&-39:11:47.15&19.5$\pm$0.1${}^{\prime\prime}$&218.0$\pm$0.4$\arcdeg{}$&–&–&–&15.05$\pm$0.22&14.91$\pm$0.22&–&–\\ HD~{}147513&5&16:24:00.295&-39:11:55.39&24.4$\pm$0.1${}^{\prime\prime}$&306.7$\pm$0.4$\arcdeg{}$&–&–&–&–&–&13.96$\pm$0.04&13.97$\pm$0.08\\ HD~{}147513&6&16:24:01.641&-39:11:16.38&19.4$\pm$0.4${}^{\prime\prime}$&104.7$\pm$0.8$\arcdeg{}$&–&–&–&$>15.59$&$>15.19$&15.21$\pm$0.17&15.27$\pm$0.19\\ HD~{}147513&7&16:24:03.070&-39:11:36.31&26.4$\pm$0.2${}^{\prime\prime}$&182.6$\pm$0.5$\arcdeg{}$&–&–&–&–&–&15.53$\pm$0.17&15.40$\pm$0.17\\ HD~{}147513&8&16:24:02.031&-39:11:59.26&26.4$\pm$0.4${}^{\prime\prime}$&245.9$\pm$1.1$\arcdeg{}$&13.57&15.18&14.80&–&–&15.01$\pm$0.12&15.18$\pm$0.15\\ HD~{}147513&9&16:24:03.240&-39:11:16.37&34.5$\pm$0.2${}^{\prime\prime}$&147.0$\pm$0.1$\arcdeg{}$&–&–&–&15.40$\pm$0.28&$>15.52$&15.17$\pm$0.11&14.99$\pm$0.13\\ 47~{}UMa&1&10:59:26.441&+40:26:05.10&25.5$\pm$0.1${}^{\prime\prime}$&37.6$\pm$0.4$\arcdeg{}$&–&–&–&$>15.54$&14.69$\pm$0.25&15.45$\pm$0.15&14.40$\pm$0.10\\ 47~{}UMa&2&10:59:28.980&+40:26:04.88&23.6$\pm$0.1${}^{\prime\prime}$&139.5$\pm$0.1$\arcdeg{}$&–&–&–&15.12$\pm$0.24&15.24$\pm$0.35&$>18.25$&15.92$\pm$0.34\\ HD~{}160691&1&17:44:09.617&-51:49:42.35&27.1$\pm$0.2${}^{\prime\prime}$&123.8$\pm$0.2$\arcdeg{}$&12.83&13.07&14.54&14.59$\pm$0.15&14.49$\pm$0.23&14.70$\pm$0.09&14.53$\pm$0.11\\ HD~{}160691&2&17:44:09.403&-51:50:20.54&19.7$\pm$0.1${}^{\prime\prime}$&232.9$\pm$0.4$\arcdeg{}$&–&–&–&12.03$\pm$0.04&12.15$\pm$0.06&12.13$\pm$0.03&12.15$\pm$0.04\\ HD~{}160691&3&17:44:07.754&-51:50:16.37&17.3$\pm$0.3${}^{\prime\prime}$&318.1$\pm$0.1$\arcdeg{}$&–&–&–&14.54$\pm$0.15&14.81$\pm$0.24&14.66$\pm$0.07&15.05$\pm$0.14\\ HD~{}160691&4&17:44:06.403&-51:50:09.53&33.4$\pm$0.1${}^{\prime\prime}$&352.0$\pm$0.1$\arcdeg{}$&–&–&–&–&–&12.99$\pm$0.03&13.03$\pm$0.04\\ HD~{}160691&5&17:44:06.667&-51:50:19.21&32.5$\pm$0.1${}^{\prime\prime}$&333.8$\pm$0.1$\arcdeg{}$&12.63&12.43&12.77&–&–&12.68$\pm$0.03&12.74$\pm$0.03\\ HD~{}160691&6&17:44:10.234&-51:50:20.17&28.8$\pm$0.4${}^{\prime\prime}$&212.2$\pm$1.1$\arcdeg{}$&–&–&–&–&–&15.13$\pm$0.12&15.53$\pm$0.17\\ HD~{}160691&7&17:44:08.602&-51:49:44.83&20.0$\pm$0.3${}^{\prime\prime}$&89.5$\pm$0.8$\arcdeg{}$&–&–&–&15.58$\pm$0.28&$>15.79$&–&–\\ HD~{}160691&8&17:44:10.481&-51:50:15.79&30.1$\pm$0.2${}^{\prime\prime}$&201.3$\pm$0.5$\arcdeg{}$&–&–&–&$>16.31$&15.17$\pm$0.25&–&–\\ SCR~{}J1845-6357&1&18:45:06.809&-63:57:59.44&27.4$\pm$0.2${}^{\prime\prime}$&324.7$\pm$0.1$\arcdeg{}$&–&–&–&15.73$\pm$0.11&15.80$\pm$0.16&15.88$\pm$0.14&15.88$\pm$0.19\\ SCR~{}J1845-6357&2&18:45:10.488&-63:57:36.86&33.6$\pm$0.2${}^{\prime\prime}$&168.4$\pm$0.2$\arcdeg{}$&–&–&–&16.23$\pm$0.14&15.90$\pm$0.16&16.51$\pm$0.18&16.26$\pm$0.22\\ SCR~{}J1845-6357&3&18:45:06.698&-63:57:55.51&26.8$\pm$0.2${}^{\prime\prime}$&333.6$\pm$0.2$\arcdeg{}$&–&–&–&16.18$\pm$0.14&16.43$\pm$0.21&16.26$\pm$0.16&16.18$\pm$0.24\\ SCR~{}J1845-6357&4&18:45:08.546&-63:57:30.38&13.7$\pm$0.2${}^{\prime\prime}$&105.7$\pm$0.5$\arcdeg{}$&–&–&–&17.48$\pm$0.27&17.28$\pm$0.32&17.10$\pm$0.25&17.03$\pm$0.35\\ SCR~{}J1845-6357&5&18:45:05.128&-63:57:56.62&48.7$\pm$0.4${}^{\prime\prime}$&344.4$\pm$0.6$\arcdeg{}$&–&–&–&–&–&16.45$\pm$0.18&16.44$\pm$0.25\\ GJ~{}86&1&02:10:29.273&-50:48:58.00&32.6$\pm$0.1${}^{\prime\prime}$&134.7$\pm$0.1$\arcdeg{}$&–&–&–&$>14.94$&14.85$\pm$0.29&–&–\\ $\upsilon$~{}And&1&01:36:49.806&+41:24:12.36&31.5$\pm$0.4${}^{\prime\prime}$&185.7$\pm$0.8$\arcdeg{}$&–&–&–&–&–&16.11$\pm$0.35&$>17.34$\\ $\upsilon$~{}And&2&01:36:46.562&+41:23:55.39&26.5$\pm$0.2${}^{\prime\prime}$&310.8$\pm$0.1$\arcdeg{}$&–&–&–&–&–&15.93$\pm$0.22&–\\ GJ~{}581&1&15:19:25.370&-07:43:34.50&17.8$\pm$0.2${}^{\prime\prime}$&312.6$\pm$0.1$\arcdeg{}$&14.75&14.12&13.87&13.61$\pm$0.04&13.48$\pm$0.05&n/a&n/a\\ GJ~{}581&2&15:19:25.109&-07:43:13.73&17.7$\pm$0.2${}^{\prime\prime}$&25.7$\pm$0.8$\arcdeg{}$&–&–&–&16.96$\pm$0.23&$>18.15$&n/a&n/a\\ GJ~{}581&3&15:19:26.614&-07:43:44.26&23.8$\pm$0.2${}^{\prime\prime}$&253.9$\pm$0.6$\arcdeg{}$&–&–&–&$>16.59$&16.36$\pm$0.29&n/a&n/a\\ GJ~{}581&4&15:19:26.796&-07:43:45.19&25.6$\pm$0.2${}^{\prime\prime}$&248.6$\pm$0.6$\arcdeg{}$&–&–&–&–&$>16.72$&n/a&n/a\\ GJ~{}849&1&22:09:42.319&-04:38:25.98&21.7$\pm$0.2${}^{\prime\prime}$&176.5$\pm$0.5$\arcdeg{}$&–&–&–&15.84$\pm$0.18&15.94$\pm$0.24&n/a&n/a\\ GJ~{}436&1&11:42:11.213&+26:42:32.33&16.4$\pm$0.2${}^{\prime\prime}$&69.9$\pm$0.9$\arcdeg{}$&–&–&–&16.31$\pm$0.15&16.62$\pm$0.24&n/a&n/a\\ HD~{}69830&1&08:18:22.421&-12:38:13.85&28.0$\pm$0.2${}^{\prime\prime}$&337.6$\pm$0.2$\arcdeg{}$&13.93&13.32&13.18&13.01$\pm$0.11\tablenotemark{*}&12.83$\pm$0.12\tablenotemark{*}&n/a&n/a\\ \\ \hline\cr]{}\end{tabular}} \par\vspace{4.5ex}\footnoterule\vspace{.5ex}{\footnotesize\par\vspace*{3ex}{\parbox{433.62pt}{\hskip8.00002ptNote. — (*)The source in the frame of HD69830 is cut off at the edge of the frame; its photometry is estimated.}\par}}\end{table} \par\LTX@newpage\end{landscape} \par\par\@add@PDF@RDFa@triples\par\end{document}