First Dynamic Computations of Synchrotron Emission from the Cygnus A Radio Cavity; Evidence for Electron Pair Plasma in Cavity
Abstract
Cosmic rays, thermal gas and magnetic fields in FRII radio cavities are assumed to come entirely from winds flowing from just behind the jet shocks. Combining analytic and computational methods, it is shown that the computed radio-electron energy distribution and synchrotron emissivity spectra everywhere in the Cygnus A radio cavity agrees with radio observations of the Cygnus A lobes. The magnetic field energy density is small everywhere and evolves passively in the post-shock wind. Most synchrotron emission arises in recent post-shock material as it flows back along the radio cavity wall. Because it experienced less adiabatic expansion, the magnetic field in this young backflow is larger than elsewhere in the radio lobe, explaining the observed radio synchrotron limb-brightening. The boundary backflow decelerates due to small cavity pressure gradients, causing large-scale fields perpendicular to the backflow (and synchrotron emission) to grow exponentially unlike observations. However, if the field is random on subgrid (sub-kpc) scales, the computed field reproduces both the magnitude and slowly decreasing radio synchrotron emissivity observed along the backflow. The radio synchrotron spectrum and image computed with a small-scale random field agree with VLA observations. The total relativistic energy density in the post-jet shock region required in computations to inflate the radio cavity matches the energy density of relativistic electrons observed in the post-shock region of Cygnus A. This indicates that the component in the jet and cavity that dominates the dynamical evolution is a relativistic pair plasma.
Subject headings:
galaxies: individual (Cygnus A), radio continuum: galaxies, X-rays: galaxies: clusters, hydrodynamics1. Introduction
Our recent 2D gas dynamical calculations of the remarkable FRII radio-X-ray source Cygnus A explicitly include the dynamical effects of both hot thermal gas and relativistic gas inside the radio cavity (Mathews & Guo 2010, 2012; MG10 and MG12 hereafter). Since the dynamics of relativistic, radio-synchrotron-emitting electrons are known, we now extend the results of MG12 by computing the radio synchrotron emission and magnetic flux throughout the radio cavity and compare with detailed VLA observations of Cygnus A.
Unlike all previous FRII computations, we do not explicitly compute the jet evolution, but instead assume that the energy that inflates the radio cavity enters via the well-observed post-jet shock region. It is assumed that all thermal, non-thermal and magnetic energy inside the radio cavity originates in this small region just behind the jet shock. This intensely energetic and possibly turbulent region is the source of a powerful wind that flows away in every direction except, we assume, upstream in the jet direction. With these assumptions, it is possible to compute the entire evolution of Cygnus A with a post-shock source region that moves out into the cluster gas; the jet is not explicitly computed. Avoiding the jets is convenient since sufficiently detailed observations of faint FRII jets do not currently exist while observations of the physical properties of the luminous post-shock regions are much better understood.
One of the chronic computational difficulties experienced by previous attempts to compute FRII dynamics, like those of Cygnus A, is the Kelvin-Helmholtz instability (KHI) that invariably occurs when gas, after leaving the jet post-shock region, is diverted to flow back in the anti-jet direction toward the cluster center as it inflates the radio cavity. The large velocity shear generated by this backflowing gas gives rise to KHIs that cause the computed cavity to become irregular in shape and to produce chaotic, irregular internal velocity fields. Neither of these attributes are observed in Cygnus A or are common in other FRII sources. Many or most FRII radio cavities have smoothly curved outer boundaries and observed radio-synchrotron ages that decrease in a smooth, monotonically fashion along the jet direction, showing no evidence that the interiors of radio cavities are scrambled by large scale KH-induced turbulence although turbulence on smaller scales is still possible. In particular, VLA observations of the radio cavity of Cygnus A reveal a very smooth, gently curved boundary that appears to be stable to KHI.
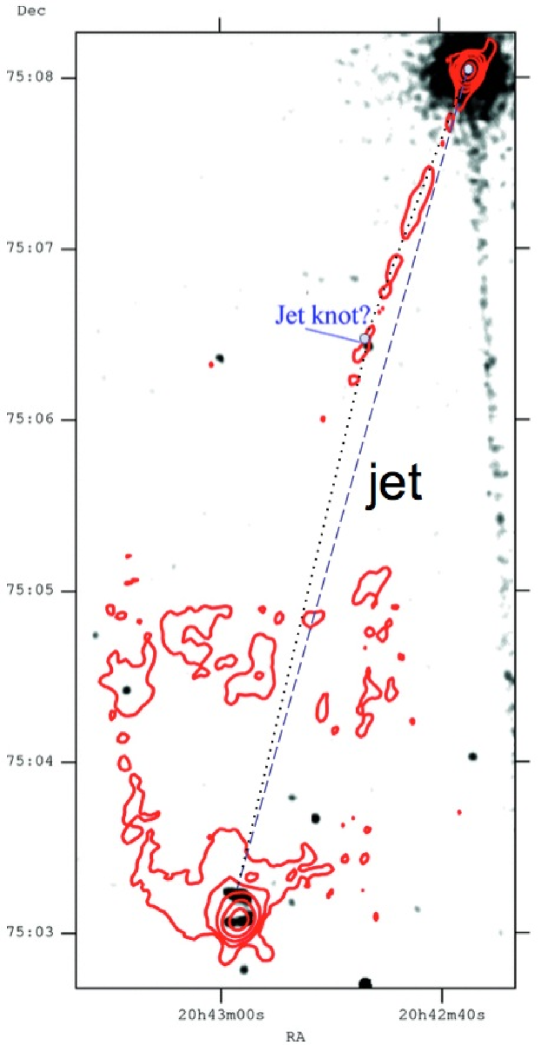
Computations driven by a moving post-shock source region allow us to reproduce a number of important radio and X-ray features observed inside the Cygnus A radio cavity. One of our most important results in MG12 is the realization that relativistic gas backflowing from the jet-shock is restricted to a rather narrow shell just adjacent to the outer boundary of the radio cavity. Since this flow carries with it the youngest, most energetic radio-emitting electrons and the largest fields, we conclude that radio synchrotron emission from the cavity arises mostly or exclusively from this boundary backflow. Although this radiating shell geometry has not been considered by most observers who interpret radio or inverse Compton X-ray emission from the radio lobe, edge-brightened radio synchrotron emission has indeed been verified in Cygnus A by Carvalho et al. (2005) and in other FRII sources by Daly et al. (2010).
The KHI in the boundary backflow must be damped. This can be accomplished either with a magnetic field along the flow direction or by adding a small viscosity. In MH12 we adopted viscous damping and this choice is further supported in the discussion in Section 2 below. Viscous damping arises naturally from the entrainment of a small amount of cluster gas into the rapid backflow. Entrainment also decelerates the low-inertia, thermally relativistic backflow, but most of the backflow deceleration is due to a small negative radial pressure gradient inside the cavity. (The gradient is small because of the large scale height of hot cavity gas in the cluster gravity field.) In turn, the deceleration significantly amplifies large scale magnetic fields in the backflow that are not parallel to the backflow velocity.
Observations of Cygnus A indicate that magnetic energy densities throughout the cavity region are less than the combined energy densities of local thermal and non-thermal gas components, and this is the assumption made in MG12. Consequently, the Lorentz term does not appear in the equation of motion, i.e. the large scale magnetic field is not strong enough to influence the flow of gas or relativistic plasma, and the frozen-in magnetic field evolves passively as it flows from the post-shock region into the radio cavity. This passivity allows us to explore the effects of various field morphologies in the boundary backflow using a post-processing procedure based on the same gasdynamical evolution described in MG12.
The radio-synchrotron emission throughout the radio cavity in Cygnus A is completely determined by the energy distribution of relativistic synchrotron electrons observed in the post-shock region between energy and . In Section 3 we describe how simple analytic solutions can be used to translate this post-shock energy spectrum to an evolved spectrum anywhere anywhere in the lobe and in particular along the boundary backflow.
Another new result discussed in MG12 is that the small regions of luminous radio and X-ray emission near the tips of the jets, often referred to as “hotspots”, are more complex than previously recognized. These kpc-sized regions of intense radio synchrotron emission in FRII sources are not in general located at the energetic jet-shock source regions described above, but in arc-shaped regions just ahead along the jet direction where the post-shock wind first crashes against dense (shocked) cluster gas and is powerfully compressed. In Cygnus A radio and synchrotron-self Compton X-ray emission just behind the jet shock is much weaker than from the bright arc about 1.5 kpc ahead. Nevertheless, the post-shock region is certainly the hottest spot in the radio cavity, i.e. the hottest spot is not the observed “hotspot”. Fortunately, in at least one very powerful FRII source it is possible to observe X-radiation from both spot regions (Erlund et al. 2010), so a new terminology is needed to distinguish between the post-shock and compressed arc-shaped regions. VLA observers describe significant radio structure in and near the hotspots (e.g. Black et al. 1992 and Leahy et al. 1997) and occasionally suggest a spatial distinction between the jet termination shock and bright radio emission, but it is unclear how these features relate to the spatial distinction we discuss here for which we provide a dynamical model.
In MG12 we chose to refer to the (typically fainter) post-shock region as the “hotspot” and the observationally brightest region as the “offset”. Here we drop the use of “hotspot” altogether and unambiguously refer to the post-shock region as the “shock spot” and to the more luminous arc-shaped wind compression offset ahead as the “bright spot”.
Detailed hydrodynamic modeling for Cygnus A such as we describe in MG12 and discuss here at length, requires considerable computing and analysis and therefore must be restricted to a small set of well-chosen parameters such as the core-hotspot distance, the age, the magnetic field, jet luminosity, initial properties of the cluster gas in which the event occurred, etc. Among the best known parameters is the physical size of Cygnus A from core to hotspots, determined from its redshift with km s Mpc-1, is about 60 kpc with 1 kpc per arcsecond (e.g. Wilson, Smith & Young 2006). We adopt an age of 10 Myrs for Cygnus A which can be determined from the spectral evolution of the radio continuum (e.g. Machalski, Chyzy, Stawarz & Koziel 2007) who find 10.4 1.6 Myrs using equipartition fields or from the size and strength of the bow shock and a simple self-similar evolutionary model in the cluster atmosphere ( Myrs from Wilson, Smith & Young 2006). Other previous estimates of the age do not differ significantly from our chosen value, 10 Myrs (e.g. Begelman & Cioffi 1989; Carilli et al. 1991; Kaiser Alexander 1999). The average rate that cosmic ray energy is supplied to the radio cavity by the jet is approximately ergs s-1 (e.g. Wilson, Smith & Young 2006). Our assumed value of refers only to the single radio lobe we calculate, so the total power is . However, this power is sufficient to inflate radio cavities to volumes only about half that observed in each Cygnus A cavity after 10 Myrs. Consequently, in §6 below we consider a second hydrodynamic model with ergs s-1 that does reproduce the observed cavity volume. Magnetic field strengths measured by combining radio and X-ray observations are independent of equipartition assumptions and expected to be reasonably accurate, but they are computed with simpler cavity emission geometries than we describe here. Yaji et al. (2010) determine a (presumably uniform) field of 20 G in the Cygnus A radio cavity by comparing radio synchrotron emission with inverse Compton X-ray emission upscattered from the microwave background and synchrotron-self Compton (SSC) X-rays produced by upscattered synchrotron emission. Their analysis (especially for SSC) depends on the geometric morphology of the synchrotron-emitting region which Yaji et al. (2010) assume is uniform throughout the radio lobe. This differs considerably from the edge-brightened radio lobe emission we describe in MG12. Nevertheless, until a new data analysis is performed using our model, we adopt 20 G as a reference “observed” value for the radio lobe field. Our adopted field in the bright spot, about 220G, taken from Stawarz et al. (2007), is less dependent on global dynamical models. Overall, uncertainties in these key Cygnus A parameters, and the dynamical models we compute from them, are likely to be dominated more by systematic errors due to inadequate underlying assumptions than by statistical observational errors.
2. Summary of Computed Dynamical Models for Cygnus A
Our computations of radio synchrotron emission from Cygnus A rely largely on hydrodyamic models discussed in MG10 and MG12. For this reason it is useful to briefly summarize the assumptions and results in those papers.
We consider the self-consistent dynamics of a two-component fluid: thermally (but not kinematically) relativistic cosmic rays (CRs) and hot gas having energy densities and respectively. The pressures of these two fluids are related to the energy densities by and respectively where and . CR pressure gradients communicate momentum to the gas by means of small magnetic fields frozen into the gas that are otherwise dynamically insignificant; Alfvén speeds are generally small compared to typical gas velocities. The magnetic energy density inferred from radio and X-ray observations of the Cygnus A radio lobes is smaller than by factors of 10-600 (Hardcastle & Croston 2010; Yaji et al. 2010). Observed fields in the radio lobe are small, only G (Yaji et al. 2010). Even the much larger magnetic fields observed in Cygnus A bright spots, G, indicate that is several times smaller than , the energy density of synchrotron-radiating CR electrons alone (Stawarz et al. 2007). Consequently, for the approximate computations discussed here we ignore the Lorentz force on the gas and regard the magnetic field as passively moving with the hot gas velocity.
The equations we consider are:
| (1) |
| (2) |
| (3) |
| (4) |
| (5) |
| (6) |
| (7) |
These equations are solved in 2D axisymmetric cylindrical coordinates, appropriate for the very symmetric X-ray image of Cygnus A (MG12).
In equation (3) we omit a term for radiative losses from the thermal gas component – this is justified by the remarkably short age of the Cygnus A event, only 10 Myrs. Equation (4) for the integrated CR energy density does not include CR diffusion nor do we include loss terms due to synchrotron or inverse Compton emission, since strongly radiating CRs are a small fraction of the total CR energy density required to inflate Cygnus A. A mass conservation equation for the relativistic CR particles is unnecessary because of their negligible rest mass.
The viscous stress tensor appearing in both the momentum and internal energy equations is proportional to the (assumed constant and isotropic) viscosity . These terms are provided in cylindrical coordinates in the Appendix of MG12. We assume a classical Navier-Stokes form for the viscous terms, but it must be emphasized that the physical nature of (turbulent or particle) transport processes in relativistic, weakly magnetic plasmas are very poorly understood (Schekochihin et al. 2010).
In our 2D computations, the gasdynamical evolution of Cygnus A is entirely driven by an outflowing wind from the moving shock spot source region immediately behind the termination shock of the jet. The mean velocity of the shock spot is determined by its distance from the cluster core and the approximate age of Cygnus A, . For simplicity we assume this mean velocity is also the instantaneous velocity (e.g. O’Dea et al. 2009). The shock spot velocity is maintained by an acceleration source term in equation 2, see MG12 for details. Our Cygnus A computations are the first to adopt shock spot-driven gasdynamics; the jet is not explicitly included in the calculation but its momentum and energy determine those of the shock spot. Shock spot-driven flows are preferred because the physical properties of the much fainter jets remain uncertain while flow variables in the shock spot can be found from those observed in the relatively nearby bright spot (Section 3.3).
All magnetic field and cosmic rays inside the radio cavity are assumed to originate in the shock spot wind. The cosmic ray source term in equation (4) where cm3 is the shock spot volume and erg s-1 is the approximate energy supply required to inflate the radio cavity to its present volume. After each time step the magnetic field in the shock spot is reset to a fixed value consistent with synchrotron self-compton (SSC) X-ray observations in the nearby bright spot region (Stawarz et al. 2007). The assumed constancy of during the Cygnus A evolution will need to be verified by future FRII observations. The shock spot wind is also assumed to continuously provide a small admixture of non-relativistic plasma onto which the magnetic field can be frozen, as represented by the term in equation (1). Non-relativistic gas is thought to arrive in the jet, entrained from low-entropy cluster gas that flows up along the Cygnus A symmetry axis (MG12). The amount of non-relativistic gas entering the shock spot is very uncertain since it cannot be directly observed.
Equation (5) describes the advection of , the product of the local gas density and the exit time from the shock spot (in Myrs). At any point inside the cavity the time at which the local gas exited the shock spot can be found from . The age of cosmic ray electrons at every grid zone inside the cavity is Myr where 10 Myr is the current time.
The powerful shock spot wind moves out in all directions, but we assume it is unable to move upstream into the oncoming jet. By this means, material in the shock spot is endowed with a net forward momentum acquired from the incident jet. The subsequent flow of the shock spot wind, confined and shaped by the dense wall of (shocked) cluster gas on all sides, moves to the cavity surface then back along the surface at high velocity. The shock spot wind transforms into a “boundary backflow” that moves in the anti-jet direction just along the outer boundary of the radio cavity. Most of the radio synchrotron emission in the Cygnus A cavity comes from recently shock spot-energized electrons in this boundary backflow. The observed radio synchrotron emission is in fact mostly confined to this backflowing shell (Carvalho et al. 2005). The backflow rapidly decelerates due to the small negative radial pressure gradient inside the cavity. At a distance kpc from Cygnus A center, about 5 kpc back from the bright spot, the backflow velocity is km s-1, but the velocity drops to km s-1 at kpc and decreases further beyond (see Tables 1 and 2 below).
The high velocity of the boundary backflow relative to the surrounding gas generates a strong KH instability that has appeared in all previous FRII calculations (e.g. Hodges-Kluck & Reynolds 2011 and Huarte-Espinosa et al. 2011). The KH instability eventually disrupts the surface of the radio cavity in ways that are inconsistent with many FRII radio images like Cygnus A which have radio cavities with relatively smooth outer boundaries. Even more troublesome are radio observations of the approximate spectral ages of synchrotron electrons which vary smoothly and monotonically, increasing along the backflow without the age mixing expected from KHI.
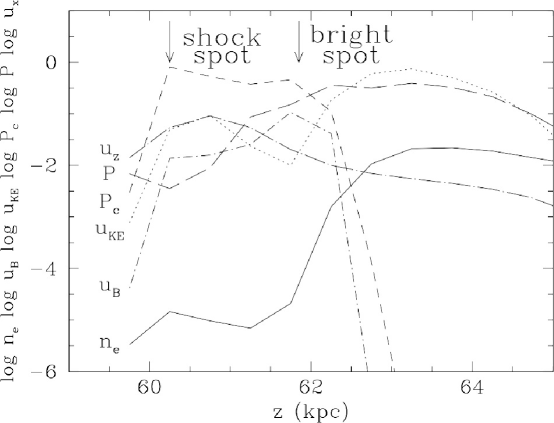
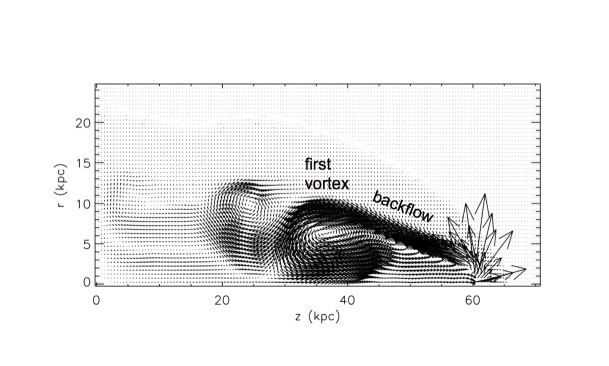
It is clear that the KH instability must be suppressed and this can be done most simply either with relatively strong magnetic fields along the backflow or with viscosity which we prefer. Figure 1 shows a superposition of many velocity vectors from MG12 for Cygnus A at time 10 Myrs without viscosity (top) and with a small viscosity (bottom), gm cm-1 s-1. The first onset of the KH instability indicates which surface of the boundary backflow is unstable, inner or outer. The top image in Figure 1 reveals that the KH-unstable backflow near , kpc is initially diverted inward toward the symmetry axis of the radio cavity. The anti-clockwise motion that results is in the same sense as the shear at the inner boundary, but opposite to the shear at the outer boundary. Evidently, the backflow first becomes KH unstable at its inner surface well inside the radio cavity. (Most previous discussions have assumed that the KH instability occurs at the radio cavity wall.)
As in Figure 1, all computed axisymmetric images of the Cygnus A radio cavity in MG12 are shaped like rockets with sharply pointed leading edges. However, radio observations of Cygnus A (e.g. Fig. 1 of MG12) and most or all other FRII radio lobes show a much more rounded blimp-shaped leading edge. As we discuss in MG12, this difference is probably due to the rapid and frequent random re-direction of the Cygnus A jet through small angles. Such deflections can arise during interactions with transverse gas density gradients in the filament of thermal cluster gas that moves along the the same jet axis. In our axisymmetric calculations a single active shock spot is constrained to move without deflection right along the symmetry axis ( direction). By comparison, in Cygnus A a multitude of simultaneously active shock spots located near the leading cavity boundary, each drive individual boundary backflows that converge into a single flow as they proceed back toward the cluster core. This results in a much more rounded cavity than those generated by a single shock spot. Radio cavity widths are therefore expected to exceed those in our axisymmetric calculations, particularly near the leading edge.
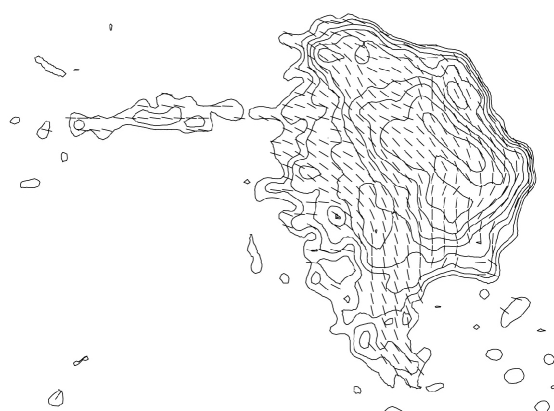
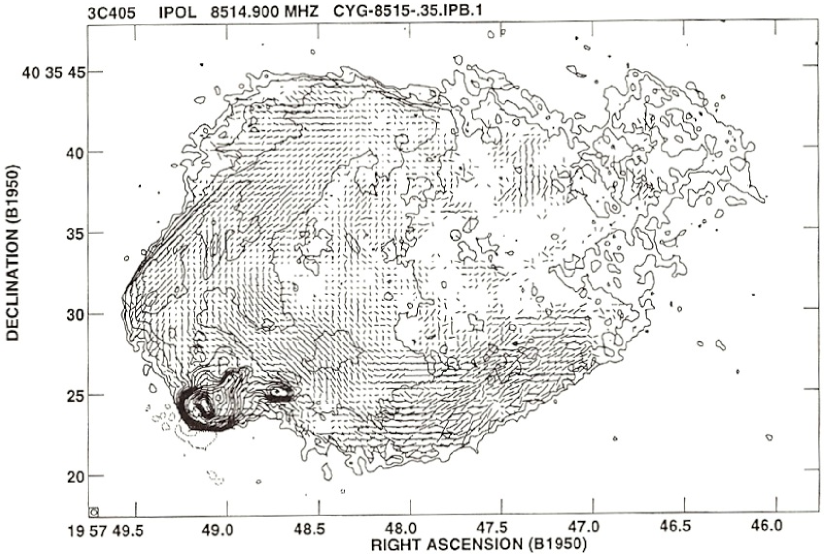
Figure 2 shows radio polarization observations at 43 GHz of the luminous northwestern bright spot A in Cygnus A at 0.2″resolution (Carilli et al. 1999). The unknown field morphology arriving in the jet provides the seed for the post-shock field which is compressed in the shock, becoming more aligned parallel to the shock surface and perpendicular to the jet direction. The post-shock field may be more disturbed than it appears and could be amplified by turbulence. A similar polarization pattern is observed in the southeastern bright spot D. The field alignment in bright spots could be consistent with a largely toroidal field, although substantial radial field components are also likely. However, Figure 3 shows that the polarization of the eastern radio cavity in Cygnus A is far from toroidal downstream from the shock spot. Deviations from pure axisymmetry can convert an initially toroidal field into poloidal, so the complex radio cavity field in Figure 3 can in principle have evolved from shock spots having (what appear to be) more ordered fields. Another source of non-axisymmetry are the frequent changes in the jet direction, as evidenced by multiple bright spots in Cygnus A and other FRIIs (see MG12 for a discussion). In any case, for simplicity and other computational reasons discussed below, in our gasdynamical calculations we initially consider only toroidal fields in the shock spot which, due to ideal axisymmetry, remain toroidal as they evolve downstream in the cavity.
The induction equation (6) for a toroidal field
| (8) |
automatically satisfies the solonoidal condition . This equation is linear in so the computed passive field can be rescaled to any desired initial value in the shock spot as long as the field energy is not dynamically important. According to equation (8) an initially uniform backflow field () grows exponentially as it decelerates in the -direction along the backflow (). Evidently, a radial field component would increase in a similar fashion, but would be much less affected by deceleration in the -direction.
To stabilize KHI in the backflow with magnetic forces, it is necessary that large scale fields in the direction of the backflow provide a Lorentz force that resists deformation at the shear interface. Toroidal fields have no effect on the KH instability. While the fields observed in Cygnus A are far too small to provide KH stabilization, it is useful to consider this case anyway considering the uncertainties involved. When the field is aligned with the flow, KH stabilization requires that the mean Alfvén speed across an interface exceed the change in the shearing flow velocity at the interface. As discussed in MG12, the Alfvén speed is much less than the computed radio cavity shear flows when is evaluated with G, the radio lobe field observed by Yaji et al. (2010), and the local density of non-relativistic gas in our computed flows. To stabilize the KHI, either would need to be about 10 times larger than G or the gas density would need to be about 100 times smaller (by reducing the rate of gas supply to the shock spot). However, if is much lower than the value adopted by MG12, the velocity of the shock spot wind and the backflow would increase considerably due to a much lower inertia. This would cause the apparent ages of synchrotron-emitting electrons in the Cygnus A backflow to appear younger than observed. These arguments, together with the apparent absence of large scale fields inside the radio cavity, sharply reduce the likelihood that KH can be successfully stabilized by magnetic fields222 Shock spot-driven FRII evolution introduces significant numerical challenges when poloidal fields ( and ) are included in the shock spot source. Most or all available standard MHD codes adopt the ”constrained transport” procedure in solving the induction equation (6). With constrained transport if the initial field is divergence-free, the computed field is guaranteed to remain divergence-free at later times to machine accuracy. For shock spot-driven hydrodynamics the difficulty maintaining arises when assumed shock spot fields move forward on the grid or need to be reset to constant or other time-varying values after each time step. This reset breaks the field continuity at the shock spot boundary, producing magnetic monopoles and non-zero . When monopoles are present the computed field may look physically acceptable and yet be significantly in error. One solution for this, enthusiastically recommended for users of the FLASH3 code, is to spatially diffuse non-zero throughout the entire grid, evidently minimizing the influence of magnetic monopoles at any particular location. .
We prefer KH stabilization with viscosity which contributes to the deceleration of the boundary backflow. Non-thermal jets moving through cluster gas appear to be decelerated by the entrainment of cluster gas (e.g. Bicknell 1994; Laing & Bridle 2002). Like the Cygnus A backflow, outward moving jets with internal energies dominated by relativistic particles have high energy density but very low momentum. Jet momentum is very sensitive to the decelerating inertia provided by small amounts of relatively stationary thermal gas that enters across FRI jet boundaries. Evidently entrainment can arise from a turbulent boundary layer at the jet-cluster interface, but the cores of jets also decelerate, implying that the entrained cluster gas continues to reduce momentum by viscosity as it diffuses toward the jet core. Viscosity must accompany entrainment. But the deceleration of the Cygnus A backflow differs from that in outflowing FRI jets and in fact most of the backflow deceleration is due to a small negative pressure gradient inside the cavity. (This is consistent with the finding in MG12 that the contribution of viscosity to backflow deceleration is small.) While the transport of non-relativistic cluster gas into jets or the Cygnus A boundary backflow may be due to complex plasma microinstabilities or turbulent activity, our computations adopt a standard Navier-Stokes formalism with uniform viscosity which we assume is adequate for now.
Some of the viscosity experienced by the computed backflow may have a numerical origin caused by the (unavoidable) numerical entrainment of cluster gas as the boundary backflow flows at an angle across the computational grid. Numerical entrainment may result from mixing and averaging gas between adjacent grid zones when the density gradient is not perpendicular to the grid zone boundary. This numerical effect may mimic the physical entrainment process and viscous deceleration that occurs in observed jets. However, in our computations numerical viscosity alone was insufficient to suppress KHI. To accomplish this it was necessary to explicitly include non-zero viscous terms in equations (2) and (3). Nevertheless, the higher density of entrained non-relativistic gas (and associated viscosity) near the cluster gas-backflow boundary helps to stabilize the backflow-cluster gas surface against KHI. This gradient of entrained cluster gas across the boundary backflow may explain why the KH instability in our calculation first appears in the internal boundary of the flow, not at the radio cavity-cluster gas interface.
3. Evaluation of the energy distribution and synchrotron emission from cosmic ray electrons
3.1. Evolution of the energy distribution
The number density of cosmic ray electrons with energy between and evolves according to
| (9) |
The energy decreases by expansion and by synchrotron plus inverse Compton (IC) losses
| (10) |
The first term on the right expresses the assumption that the expansion can be regarded as spatially uniform on small spatial scales. Local uniform expansion is plausible because the spatial density gradients are small in the Cygnus A cavity and both the shock spot wind and subsequent backflow velocities are subsonic. Consequently, we assume that the second term on the left in equation (9) can be approximated as and for uniform expansion the velocity divergence is simply .
In the second term of equation (10) is the characteristic energy loss time due to synchrotron emission in a magnetic field with energy density and inverse Compton (IC) losses by scattering cosmic microwave background (CMB) radiation , where is the redshifted radiation temperature and is the radiation constant. The rate of energy loss of each electron depends on its pitch angle so the pitch angle distribution must be known or assumed to compute the collective energy loss rate. Kardashev (1962) and Pacholczyk (1970) assume that the initial pitch angle distribution at time is isotropic and that each electron maintains this same pitch angle during its later evolution. However, most modern authors follow Jaffe & Perola (1973) and assume that the pitch angle distribution is continuously randomized by (poorly understood) wave-particle interactions on time scales that are shorter than other times of interest. It is implicitly assumed that pitch angles can be randomized without affecting or without introducing appreciable dissipative heating. In view of its physical plausibility we also adopt continuous pitch angle istropization where and the -averaged value of is
| (11) |
Ideally, when evaluating in a particular hydrodynamic grid zone in the radio cavity, the appropriate magnetic field is the time-averaged field experienced by electrons in this zone during their passage from the shock spot to the zone . This field could be determined by computing the mean field from a number of passive Lagrangian particles introduced in the shock spot. However, we avoid this complication here by simply adopting the local field in the backflow, . This approximation is expected to be quite good because the deceleration along the boundary backflow ensures that the mean time-averaged field seen by synchrotron-emitting electrons is dominated by the current field at any time.
With these simplifying assumptions the particle energy distribution equation (9) can be written as
| (12) |
This first order partial differential equation has been solved by integrating along its characteristic trajectories with solution
| (13) |
This particular solution333 This solution differs from that published by Kardashev (1962) in which is replaced with where is the time when the electrons first appear behind the shock. As (and ) . Times are irrelevant since they precede the emission history of the electrons in a given grid cell. is designed to match an initial condition with a single initial power law distribution . The evolution of due to expansion is represented by the first term and the second term describes the effects of radiative losses. The second term increases with time until when
| (14) |
To adapt this solution to our computed gasdynamical models for Cygnus A, we translate the time variation in the expansion term in using the relation for uniform expansion. Decreases in the gas density convert directly to a measure of time elapsed during uniform expansion in equation (13). Furthermore, so the time in the expansion part of the solution can be replaced with ,
| (15) |
Here is the current CR energy density in any cavity grid zone and is the energy density in the shock spot at the retarded time when the gas in this grid zone left the shock spot.
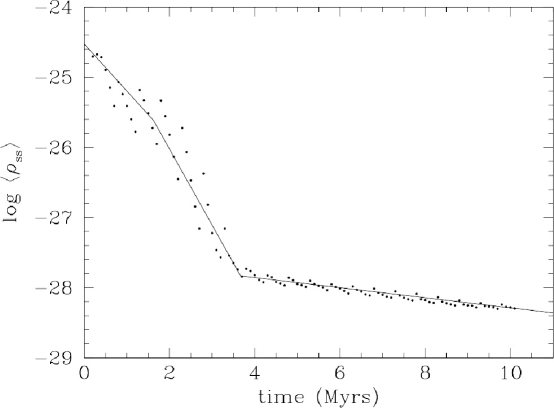
Figure 4 shows the variation of the mean energy density in the shock spot with computation time . By computation time we mean the time since the beginning of the Cygnus A event. Although the rate that cosmic ray energy is supplied to the moving shock spot remains constant in our dynamical calculations, the energy density decreases with time with the local cluster gas density. At early times, when the local cluster gas pressure is high, the energy density supplied to the shock spot in timestep cannot flow as rapidly away from the shock spot and the resulting is larger. At early times relativistic gas in the shock spot is inertially confined by the higher density and pressure in the ambient cluster gas. The solid line fit in Figure 4 is erg cm-3 where time is in Myrs. Likewise, although non-relativistic gas is continuously added to the shock spot at a uniform rate, the gas density in the shock spot decreases with time for the same reasons. The scatter in Figure 4 is due to numerical transients as the shock spot moves from one grid zone to the next.
The time factor in the radiative loss term of equation (15) is the ratio of the age of the cosmic rays in each grid zone (time since leaving the shock spot) divided by the computation time when the cosmic rays left the shock spot ,
| (16) |
The computation age of Cygnus A is currently 10 Myrs.
3.2. Evaluation of the local synchrotron emissivity spectrum
The synchrotron emissivity (erg cm-3 s-1) is given most simply by
| (17) |
where and is the number density of emitting electrons between and . The power emitted by a single electron
| (18) |
is assumed to be concentrated at a single frequency
| (19) |
is the non-relativistic gyrofrequency of an electron in the local field . Then
| (20) |
Assuming and combining these factors, the synchrotron spectrum is
| (21) |
where
| (22) |
3.3. Initial conditions in the shock spot
Stawarz et al. (2007) determined the energy spectrum of synchrotron-emitting cosmic ray electrons in the Cygnus A bright spots where the postshock wind first impacts the dense wall of (shocked) cluster gas ahead. (In Stawarz et al. (2007) the “bright spots” were referred to as “hotspots”.) The particle spectrum in the bright spots is described with a double power law with no detectable low energy cutoff:
| (23) |
where
| (24) |
| (25) |
where and and are almost the same for Cygnus A bright spots A and D and the average value of is cm-3.
Because of the spatial offset of the bright spot from the shock spot, the amplitude of the particle energy distribution and the field strength observed in the bright spot must be corrected to estimate shock spot values, and . This correction can be done using our dynamical model for Cygnus A (MG12) as shown in Figure 5. In making this correction, we consider volume-averaged corrections for the two shock spot zones and two similar adjacent zones (in the -direction) located at the bright spot. Figure 5 however only shows the correction for the innermost zone. Finally, we assume that the shape of the observed double power law is unchanged during its rapid flow from the shock spot to the offset bright spot ( yrs); this assumption is discussed further below.
scales with the total cosmic ray energy density, , using computed profiles from MG12 and from Stawarz et al. (2007). To map the evolution of cosmic rays from the shock spot to any grid zone in the radio cavity, in equations (24) and (25) must be replaced with . Similarly, the mean field estimated by Stawarz et al. (2007) in regions A and D, G, must be lowered to obtain the true shock spot value, G, again using MG12 gasdynamical results as shown for the innermost zone in Figure 5. The compressed field in the bright spot is significantly larger than that in the shock spot.
As the initial double power law energy distribution in the shock spot evolves as it flows into the radio cavity along the boundary backflow, the two power law cosmic ray populations both vary according to equation (13) and continue to intersect so
| (26) |
for and with and .
4. Radio synchrotron emission from toroidal field
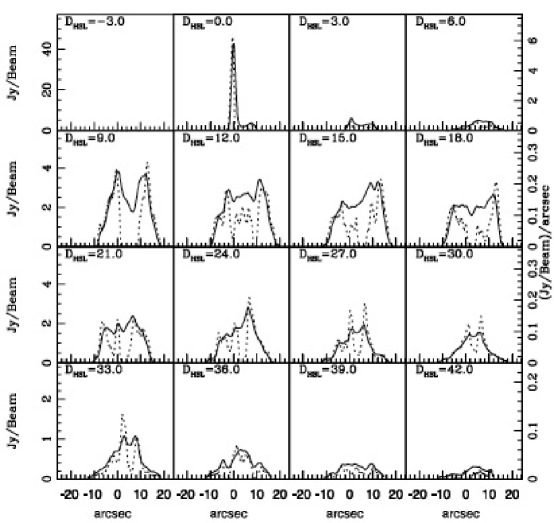
In this first test of the procedure described above we assume, as in MG12, that the magnetic field in the shock spot, and therefore in the radio cavity downstream, is purely toroidal. The objective is to reproduce the observed emissivity profiles (transverse to the Cygnus A symmetry axis) at GHz shown with dashed lines in Figure 6. These emissivity profiles across the full diameter of Cygnus A were found by Carvahlo et al. (2005) by cylindrical deconvolution of the flux profiles at each crossectional cut shown with solid lines in Figure 6. Each panel in Figure 6 is labeled with the distance measured in kpc from the Eastern bright spot kpc. The emissivity scale (in units of erg cm-3 Hz-1) is shown on the right in Figure 6. The spatial resolution of the VLA in Figure 6 is 1.36″at GHz which, at the convenient distance of Cygnus A, is about 1.36 kpc, comparable to about two computational grid zones in MG12.
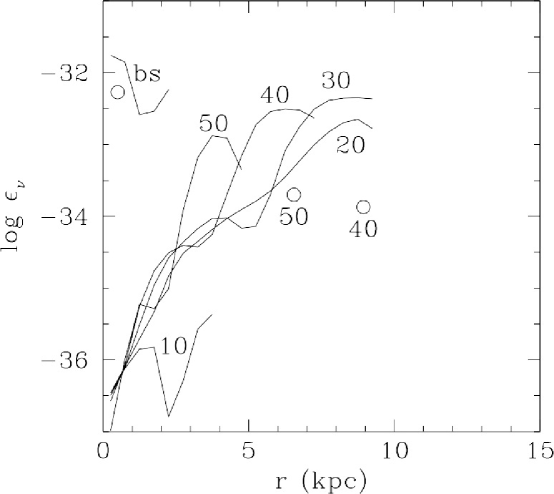
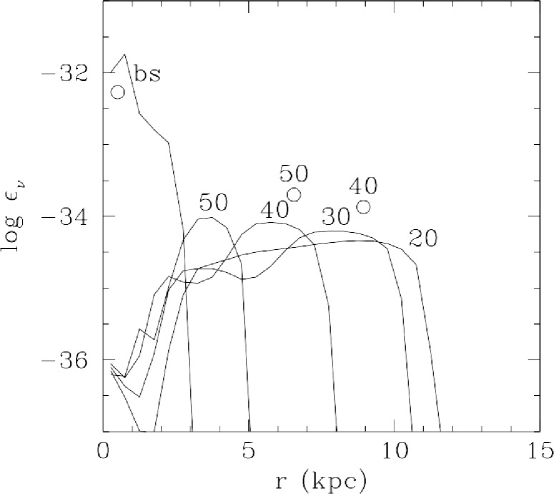
Figure 7 shows computed emissivity profiles at GHz in the spatially offset bright spot ”bs” at kpc and inside the radio cavity at , 40, 30, 20 and 10 kpc distant from the center of Cygnus A. The three open circles in Figure 7 are approximate peak observed emissivities from Figure 6 at , 50 and 40 kpc.
The observed peak emissivities at 50 and 40 kpc are displaced from the computed peaks in both the horizontal and vertical directions. The horizontal shift indicates that the observed width of the Cygnus A radio cavity at these large values of is somewhat larger than those in our gasdynamical model. Clearly, it would be easy to alter the width of the computed cavity by allowing the cosmic ray luminosity in the shock spot zones to increase with time. More likely, the computed width of the radio cavity near the shock spot is small because the shock spot is constrained to move exactly along the -axis. By comparison, as discussed in MG12, the jets in Cygnus A undergo abrupt changes in direction near the symmetry axis, causing the shock spot energy to be distributed more broadly than in our computation, i.e. redirected jets and their shock spots broaden the front surface of the cavity. For these reasons the horizontal shifts of peak GHz emissivity in Figure 7 are not a serious problem, easily corrected with a more detailed 3D computation.
More important is the emissivity mismatch in the vertical direction in Figure 7. Computed peak emissivities across the boundary backflow are 10-30 times larger than those observed in kpc. In addition, the computed backflow emissivity at GHz increases systematically from to 30 kpc, a trend noticed already in MG12, while the observed peak radio emissivity slowly decreases throughout this region (see Fig. 6). The increase in computed is largely due to the exponentially increasing toroidal magnetic field that accompanies backflow deceleration, (see MG12 for details). However, there is no observational evidence of magnetic field variation along the Cygnus A radio cavity (e.g. Yaji et al. 2010).
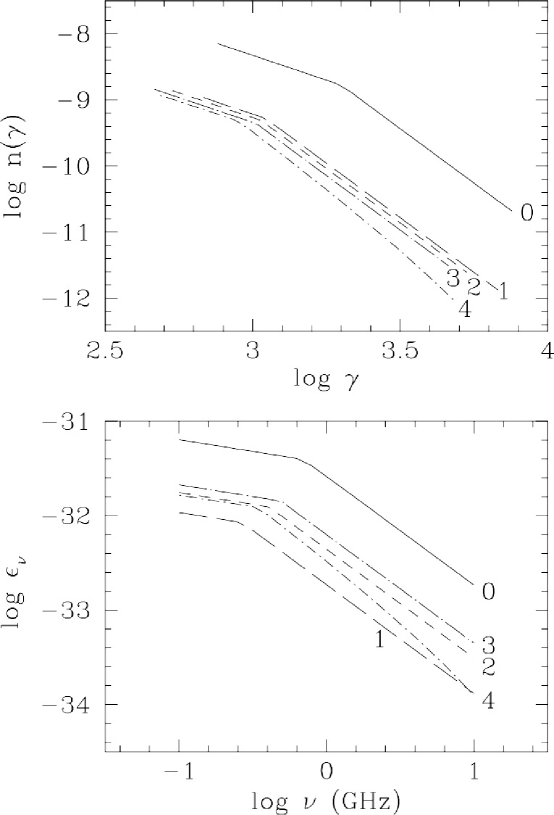
Figure 8 shows the detailed energy spectrum and emissivity in the shock spot (solid curves) and at four distances along the backflow. The downstream profiles labeled show and at the point of maximum 1.345 GHz emissivity further along the backflow. Table 1 lists the spatial coordinates of these positions () where the 1.345 GHz emissivity peaks for each value of . Also listed are the field strength, emissivity and backflow velocity all evaluated at . The right and left limits on in Figure 8 vary to match the fixed frequency range in the lower panel, but can be extrapolated beyond these ragged limits. While decreases as expected along the boundary backflow, the peak emissivity is non-monotonic. After leaving the shock spot the emissivity at increases from to 3 due to the increasing magnetic field. Profiles labeled show effects of radiative losses.
In summary, the synchrotron emission from a purely toroidal field does not provide a good match to observation. The computed field is everywhere much larger than the radio lobe field G observed by Yaji et al. (2010). The computed maximum magnetic field in the backflow G is comparable to the local energy density , violating our assumption of small Lorentz forces. Moreover, it is unlikely that this model can be saved by including poloidal field components in the shock spot source, assuming that the computational monopole problem discussed in footnote 1 could be overcome. Both radial and toroidal field components would be exponentially amplified in the decelecrating backflow. To avoid this amplification, these field components in the shock and bright spots would need to be converted almost entirely to a strong field along the backflow direction .
5. Radio synchrotron emission from random field
We now depart from the usual MHD procedure, in which the induction equation 6 is solved for the evolution of the magnetic field. Traditional MHD hydrocodes can only capture fields with structure no smaller than the computational grid. However, it is useful to consider fields that are random on scales smaller than the grid size, possibly due to turbulence or poorly understood plasma microinstabilities inside the radio cavity. Flux conservation requires that the energy density of a random magnetic field advects like relativistic fluid, with . The usual frozen-in condition expressed by the induction equation 6 requires that the field follow the flow velocity of non-relativistic gas inside the cavity. By contrast, a sub-grid random field follows the gas density, . 444 In the limit of very high computational grid resolution, not considered here, it should be possible to capture random fields using the induction equation and reproduce the dependence that we consider here.
A subgrid turbulent or otherwise tangled field has a number of attractive features. It is consistent with our assumption of continuous pitch angle isotropization. It is also consistent with KH damping by quasi-isotropic viscosity and cluster gas entrainment which imply that the small scale kinematics of momentum-carrying non-relativistic gas is random at some level. Numerical simulations of MHD turbulence in single phase fluids often indicate that an initially weak field grows in strength until it saturates at a value comparable with the thermal kinetic energy, but many details remain obscure (e.g. Brandenburg, Sokoloff & Subramanian 2012). Numerical simulations of turbulence in a two-fluid mixture of relativistic and non-relativistic gases (with ), the case of interest here, have not been performed to our knowledge. The relatively small field energy observed in the Cygnus A cavity suggests that turbulent saturation may occur when approaches the thermal energy density which is less than the total CR energy density . Under these circumstances the magnetic field would have sub-equipartition values in agreement with fields observed in many FRII lobes including Cygnus A.
Guided by these imponderables, we assume that the random, small-scale field inside the Cygnus A radio cavity at any position and time can be found from the local gas density,
| (27) |
Where G as determined above555 Equation (27) cannot be used to modify the field observed in the bright spot to find the shock spot field as we did with the toroidal field assumption. The problem is that equation (27) predicts that the two spots have about the same radio synchrotron emissivity which is inconsistent with observations of Cygnus A and other FRII sources. In view of this we imagine that quasi-toroidal fields parallel to the shock surface do exist in both spots as before, so that the toroidal corrected shock spot value of G also holds when the random field approximation (eqn. 27) applies further downstream. This is reasonable because the flow time from shock spot to bright spot ( yrs) is very short and the field morphology may not change much. Therefore we assume that the field experienced by most radio-emitting electrons in the wind-backflow inside the radio cavity rapidly becomes randomized after leaving the shock spot, possibly due to plasma microinstabilities. Relatively few of the cosmic ray electrons in the backflow actually pass though the bright spot; most escape directly from the shock spot in other directions without experiencing a strong bright spot compression. and is the shock spot gas density at the retarded time when it first emerged from the shock spot. The time dependence of is illustrated in Figure 9. Equation (27) is an idealized model that may not apply precisely to the compressed and aligned field in the shock spot. When a field described by equation (27) undergoes a one-dimensional compression, the field could in principle appear similar to the perpendicular field in Figure 2, but factors of order unity, not considered here, may be required to reconcile with the fully random field in the backflow.
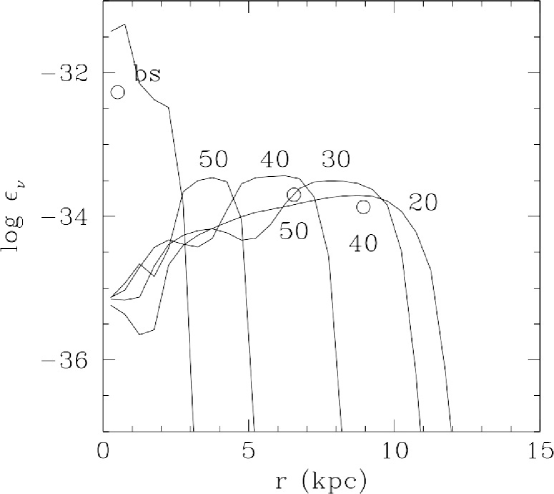
Figure 10 shows the observed and computed radio emissivity at 1.345 GHz for the random field. It is immediately seen that observed and computed emissivities agree quite well, differing by only 0.3 dex. Precise agreement could be achieved by modifying some of our assumptions and approximations. In addition, the slow downward trend of the maximum emissivity along the boundary backflow (decreasing ) is in excellent agreement with Cygnus A observations (Figure 6).
Table 2 lists the spatial coordinates of positions () of the 1.345 GHz emissivity peaks for each value of . Also listed are the field strength, emissivity and backflow velocity, each evaluated at . The field strength is nearly uniform along the backflow and the computed values are almost identical to the lobe field G observed by Yaji et al. (2010). Both these results provide excellent additional support for the random field model and indirect support for our assumptions of pitch angle scattering and viscosity.
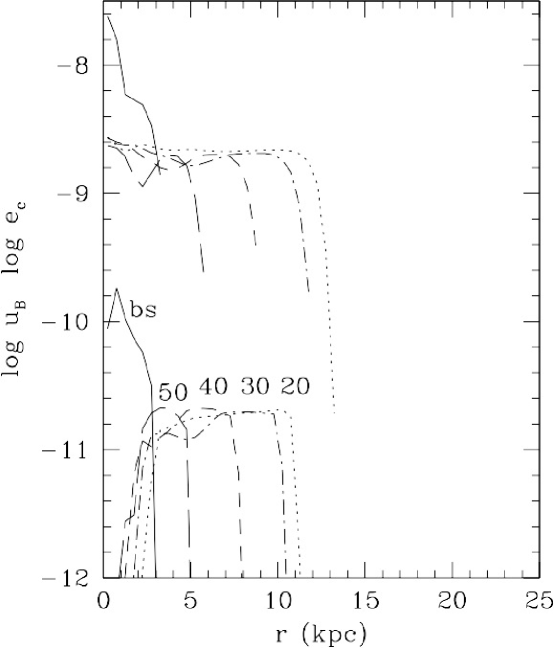
Profiles of the CR energy density and (random field) magnetic energy density in the -direction (at selected ) are shown in Figure 11. The spatial uniformity of across the lobe, required for pressure balance, by itself would suggest that the synchrotron emissivity from the Cygnus A lobes should be uniform, resulting in lobe limb-darkening not limb-brightening. However, synchrotron emission varies approximately as , therefore the peaks in seen in Figure 11 are critical to explain the observed limb-brightening. Concentrations of magnetic energy density near the lobe boundaries, particularly in the region kpc, occur in the rapidly moving boundary backflow of newly introduced electron CRs.
The declining magnetic field energy density at large in the -profiles in Figure 11 can be easily understood as lobe confinement near the lobe-cluster gas boundary, but the sharp decline in at small inside the lobe depends critically on the evolutionary history of the Cygnus A shock spot. Figure 9 shows that the gas density in the shock spot at early times can be several orders of magnitude larger than the typical lobe gas density computed at years, gm cm-3. Because of adiabatic expansion, the random magnetic field that entered the lobes from the shock spot at early times is lowered by a factor which is typically much less than unity. Since radio synchrotron emissivity varies as , this explains (i) why the field in older regions of the radio lobe closer to the jet axis is so small and (ii) why synchrotron emission near the center of the radio lobes is so much less than that in the boundary backflow where the field reduction factor is much closer to unity. A sharply increasing magnetic field strength (and radio emission) with distance from the jet axis appears to be a genetic feature regardless of the magnetic field morphology. For example, this feature is seen when a toroidal magnetic field is computed with the induction equation (cf. Fig. 6 in MG12). In both cases, magnetic field variations inside the radio lobes are essential in explaining radio lobe limb-brightening.
Figure 12 illustrates the detailed energy and emission spectra of radio-synchrotron emitting electrons at five positions of maximum along the boundary backflow listed in Table 2. The radio emissivity drops abruptly at kpc due to radiative losses. Most of the 1.345 GHz emission from the boundary backflow in Figure 12 behaves as expected, slowly decreasing with distance from the shock spot.
Finally, in Figure 3 we see a small radio polarization in the boundary backflowing region which is often roughly parallel to the local cavity boundary. Assuming random field morphology, this can be understood as a competition between the instabilities that randomize the field and stretching of the random field as a result of the local transverse velocity gradient perpendicular to the backflow. By this means, the shearing backflow is able to maintain a small apparent field along the flow direction, accounting for the backflow polarization seen in Figure 3.
6. A second dynamical model matching the currently observed cavity volume
As discussed in the Introduction, in choosing key parameters for the dynamical models of MG12 we did not attempt to slavishly duplicate all observed properties of Cygnus A. In this sense our computed models are semi-quantitative. Adopting an order-of-magnitude CR luminosity of erg s-1, the MG12 calculations generated a (single) cavity volume at time 10 Myrs which is only about 55 percent of the observed volume kpc3, determined from the measured size of a Cygnus A radio lobe assuming axisymmetry. To test the results of our synchrotron emissivity results, we re-calculated a second dynamical model in which erg s-1 for which after 10 Myrs, leaving all other initial parameters unchanged.
Figure 13 shows that this cavity-volume preserving model is able to fit the 1.345 GHz emissivity variations in the cavity just as well or better than the MG12 model shown in Figure 10. Sub-kpc random magnetic fields are assumed in both figures. Evidently our computed radio emissivities are rather insensitive to . Another feature of this second dynamical model with enhanced relativistic energy density in the shock spot is that the offset separation between the shock spot and bright spot has increased to 2.5 kpc.
7. Jet and cavity in Cygnus A are dominated by electron pairs
The fraction of cosmic ray electron pairs that contribute to inflating the Cygnus A cavity can be found by comparing the energy density of radiating relativistic electrons in the current shock spot (found from nearby bright spot observations) with the computed value of the total current cosmic ray energy density in the shock spot which includes both relativistic protons and electrons.
The total energy density of radiating relativistic electrons in the Cygnus A shock spot can be found from the current energy density observed by Stawarz et al. (2007) in the bright spot for which cm-3. Our dynamical models (as in Fig. 5) can be used to estimate how the density normalization coefficient varies between shock and bright spots: where volume-averaged values are determined for both shock spot grid zones and two similar grid zones at the bright spot.
The total energy density of radiating relativistic electrons in the Cygnus A shock spot is
| (28) |
where is given by equation (23) and the local value of at the shock spot is . Electron energy spectra in FRII sources typically have low energy cutoffs (e.g. Mocz et al. 2011). While no low energy cutoff has been observed in Cygnus A, it might have escaped detection if .
Using the fiducial Cygnus A dynamical model from MG12 and a correction from observations of the bright spot of , the total integrated shock spot energy density in electrons is erg cm-3 for . This range of electron energy densities is remarkably close to the current total relativistic energy density in the shock spot, erg cm-3 from Figure 4 required to inflate the Cygnus A cavity in the MG12 dynamical model for which erg s-1.
However, for a more accurate computation of we can use the second dynamical model with erg s-1 that reproduces the observed volume of the radio lobe cavity at time 10 Myrs. For this model the computed zone-averaged total cosmic ray energy density in the shock spot is erg cm-3 for the same range of and . By comparison, the total cosmic ray energy density computed for this dynamical model at time 10 Myrs is erg cm-3 from a figure analogous to Figure 4. For this solution the agreement is even closer, i.e. . Consequently, most or all of the relativistic particle energy inside the shock spot needed to inflate the cavity is contained in radiating electrons, i.e. the shock spot – and by extension the jet and radio cavity – are filled with a relativistic pair plasma.
This result is unaffected by the morphology of the field (toroidal or random) or by energy losses in the cavity due to synchrotron losses. Most of the contribution to the integral for comes from where the electron lifetime in the cavity exceeds the age of Cygnus A for G, the cavity field estimated by Yaji et al. (2010). Consequently, synchrotron losses are not expected to significantly degrade the cosmic ray energy density inside the radio cavity, and that was the assumption made in the gasdynamical computations.
Even a few relativistic protons in the shock spot having would disrupt the near equality found here. Each relativistic proton has a contribution to the integral for that is times that of a relativistic electron with the same energy. Because of the low energy slope of in the shock spot, low energy relativistic electrons do not dominate the energy density .
8. Foreflow synchrotron emission
The heavy line contours in the upper panel of Figure 14 show an image of the projected radio flux at 1.345 GHz from Cygnus A at 10 Myrs, , i.e. the computed emissivity integrated along the line of sight. erg s-1 is assumed. The virtual jet moves along the -axis from the left and shocks near kpc. In Figure 14 we assume that the quasi-toroidal fields observed in the shock spot maintain the same morphology when they are compressed in the nearby bright spot; the enhanced field accounts for the strong radio flux from the bright spot. Radiation from the bright spot comes from relativistic electrons with having . Consequently, the bright spot radio emissivity increases rapidly with the field strength, and increases rapidly toward the tip of the cavity (Fig. 5).
The light line contours in the upper panel of Figure 14 show which is proportional to the (so far unobserved) surface brightness of IC-CMB X-ray emission from up-scattered CMB photons. If the radio synchrotron image is simply approximated with , as in Figure 9 of MG12, the radio emission from the offset bright spot in the forward direction is coextensive with . However, in the upper panel of Figure 14 the radio synchrotron emission at 1.345 GHz drops off more rapidly than toward the leading tip of the cavity. The distance between peaks of 1.345 GHz and emission is only about 1 kpc.
A close examination reveals that this truncation of the 1.345 GHz image near the tip of the cavity is due to radiative losses, causing in the small tip region where contours extend further in the -direction than those for . In principle, the arc-shaped radio synchrotron emission from the bright spot may not always precisely define the cavity-cluster gas interface at all radio frequencies. Of course the details of this transition depend on assumptions made in Section 3. In any case, the total energy density of synchrotron-emitting electrons observed by Stawarz et al. (2007) in the bright spot may be slightly underestimated because of radiative losses.
9. Cygnus A at a later time
The proximity of shock and bright spots in the upper panel of Figure 14 definitely does not indicate that the distinction we make between these two regions is unnecessary or unphysical. To illustrate this, in the lower panel of Figure 14 we show the projected appearance of Cygnus A at 20 Myrs, twice its current age, assuming that the shock spot maintains its current properties (CR luminosity, velocity, magnetic field, etc.) in the future. Because of the negative gas density gradient in the Cygnus A cluster, the shock and bright spots are now offset by an easily observable 3 kpc. The bright spot radio display is also larger since the foreflowing shock spot wind evacuates a larger region as the density of the local cluster gas decreases. This is consistent with the observation that the size of FRII bright spots systematical increases with projected core-hotspot distance (Hardcastle, Alexander, Pooley & Riley 1998). Notice that at age 20 Myrs a small amount of radio emission at 1.345 GHz appears at the shock spot.
For an even more extreme example Figure 15 shows 1.4 GHz radio synchrotron (contours) and non-thermal X-ray (gray scale) emission observed in the FRII source 4C74.26 by Erlund et al. (2010). X-rays are observed from both the bright spot (SSC) and shock spot (X-ray synchrotron?) but the bright spot clearly dominates at radio frequencies. Both spots are elongated. In 4C74.26 the bright radio spot is in very low density gas 500 kpc from the center of its cluster and the physical separation between the shock and bright spots is 19 kpc. The dashed line shows one possibility for the jet trajectory needed to activate the observed shock spot, the dotted line shows another, The change in orientation between the X-ray shock spot (roughly perpendicular to the jet) and the X-ray bright spot indicates that the bright spot is formed as the jet strikes the radio cavity-cluster gas interface that is inclined to the jet direction.
10. Conclusions
Observations of the Cygnus A radio cavity indicate that the magnetic field is nowhere strong enough to directly influence the gas plus CR dynamics, . Nevertheless, the frozen-in field connects the dynamical motion of relativistic and non-relativistic components in our two-fluid hydrodynamical models of Cygnus A evolution (MG12). Because the magnetic field evolves passively with the post-shock hydrodynamic flow, a variety of different field evolution models can be investigated and compared with observation without re-computing the gasdynamics. The goal is to find transport properties, field morphologies, etc. that best fit detailed observations. By this means we hope to understand better the complex, poorly understood small scale physics in weakly magnetized plasmas dominated by relativistic energy density.
A new terminology is proposed that avoids use of the standard “hotspot” designation near the tips of FRII jets. The “shock spot” is the immediate post-shock region that serves as the source of a wind that transports cosmic rays, gas and magnetic field into the Cygnus A radio cavity. The ”bright spot” is the much more radio luminous region where the shock spot wind impacts against the dense (shocked) cluster gas just ahead.
The Kelvin-Helmholtz instability (KHI) in FRII radio lobes must be damped to match the smooth appearance of observed radio cavities and the monotonic variation of observed synchrotron spectral ages inside the cavity. It is unlikely that the KHI in Cygnus A can be stabilized by large-scale magnetic fields along the direction of the boundary backflow inside the radio cavity. For stability the Alfvén speed must exceed the velocity difference across the shearing layer. To achieve this in Cygnus A either (i) the magnetic field in this one direction must be times larger than the total field observed in the radio cavity or (ii) the density of non-relativistic gas must be 100 times smaller than assumed in the MG12 calculation. But the ultra-high backflow velocity at these ultra-low densities may cause the radio synchrotron ages in the cavity backflow to be smaller than observed.
If gas inside the radio lobe has a small viscosity, as we assume, the KHI can be damped without strong magnetic fields.
Radio lobe limb-brightening is due largely to the increased lobe magnetic field in the boundary backflow region. The wind that emanates from the shock spot carries non-relativistic gas, magnetic field and cosmic ray electrons, all of which flow back in the anti-jet direction along the radio lobe boundaries. The radio synchrotron emissivity depends on the product of the cosmic ray and magnetic energy densities, . However, if dominates the pressure in the radio lobes, as we assume, must be nearly uniform across (and throughout) the radio lobes to balance the pressure in the local external (shocked) cluster gas. Consequently, radio limb-brightening is not due to spatial variations in the CR electron density but instead to the varying magnetic field which is larger near the lobe boundaries.
Assuming a random sub-grid field morphology, the field anywhere in the lobe has adiabatically expanded from the value it had when it left the shock spot. But the field is frozen into the non-relativistic gas as it expands from the shock spot to a lower density in the observed lobe following . The current gas density in the lobe that arises in the shock spot wind is approximately uniform inside the lobe. By assumption, the field in the shock spot remains constant with time, but the shock spot gas density decreases dramatically as the lobe evolves into the cluster gas. Because of this, the field in the lobe varies as which increases with time during the lobe evolution and decreases with the age of the CRs. Therefore, the lobe field that emerged from the shock spot most recently (located in the boundary backflow) is larger than fields that entered the lobe at previous times. This enhances the field and synchrotron emissivity in the boundary backflow and explains the observed radio lobe limb-brightening. Evidently a similar argument also explains large-scale limb-enhanced magnetic fields and limb-brightening in lobes computed using the induction equation.
It is shown how the analytic expression for the evolution of radio synchrotron electrons due to uniform expansion and radiation losses can be adapted to estimate the electron energy distribution and specific radio synchrotron emissivity at every grid zone and time inside the radio cavity. These local functions are quite well determined from only three computed hydrodynamic arrays: gas density , magnetic field and the advected time since local synchrotron-emitting electrons left the post-shock region.
For the first time the local energy spectrum and the emissivity of radio-synchrotron electrons can be quantitatively computed throughout the radio cavity only from observations of the bright spot (when corrected to shock spot values) and simple assumptions about shock spot evolution over time.
Parameters describing the double power law observed in the Cygnus A bright spots need to be corrected to conditions in the nearby shock spot region. The shock spot is the source of electrons in the bright spot and the wind that inflates the radio cavity. This correction can be made from gasdynamical calculations.
When this correction is made, the total energy density of relativistic synchrotron electrons in the current shock spot matches the total relativistic energy density required to inflate the Cygnus A cavity to its current volume. This indicates that the relativistic fluid in radio cavities consists of electron pairs rather than a relativistic electron-proton plasma. A pure relativistic pair plasma (possibly with some entrained non-relativistic gas acquired during jet-gas interactions with the thermal filament) is physically attractive since it may be consistent with a purely electromagnetic origin of FRII jets (e.g. Blandford 2008).
The computed radio synchrotron emission from Cygnus A cavities having purely toroidal magnetic fields is a very poor fit to VLA observations. Boundary backflows decelerate due to small negative radial pressure gradients inside the lobes. During deceleration, the toroidal field grows exponentially, causing the synchrotron emissivity to increase unrealistically along the backflow. Toroidal fields rapidly grow to exceed the fields observed in the Cygnus A radio cavity. Evidently the radial component of the field , which is also transverse to the decelerating boundary backflow, would also increase in the same undesirable way along the backflow. This unfavorable outcome indicates that the usual MHD codes that solve the induction equation for the magnetic field on grid scales or larger are unlikely to provide realistic solutions inside radio cavities.
Consequently, we consider a field that is random on subgrid scales and which advects as . Such a field may result from small scale turbulence due to plasma instabilities. When saturated, the magnetic energy density may approach a low value comparable to the non-relativistic energy density which is generally less than the relativistic energy density . Random subgrid activity would also be consistent with the viscous transport of non-relativistic gas, a likely source of viscous KH damping. Using a simple model for , we find that the radio synchrotron emissivity inside the Cygnus A cavity can be fit quite well. is almost constant along the boundary backflow and has a value G that is almost identical to values observed in the radio cavity. The radio emissivity predicted by the random field model slowly decreases along the backflow, similar to VLA observations, with emissivities that quantitatively match these same observations.
If the jet and shock spot parameters remain fixed, the separation between the shock spot and bright spot increases with time, becoming about three times larger when Cygnus A is at twice its current age. This can be explained by the reduced cluster gas density at larger distances from the cluster core, allowing the shock spot wind to evacuate a larger local volume.
References
- (1)
- (2) Begelman, M. C., Cioffi, D. F., 1989, ApJ 345, L21
- (3)
- (4) Bicknell, G. V. 1994, ApJ, 422, 542
- (5)
- (6) Blandford, R., 2008, ASP Conf. Ser. vol. 386 p3, “Jets: Theory and Observation from Radio to Gamma Ray” eds. T. A. Rector and D. S. De Young.
- (7)
- (8) Brandenburg, A., Sokoloff, D., Subramanian, K., 2012, Space Sci. Rev. 169, 123
- (9) Black, A. R. S., Baum, S. A.,Leahy, J. P., Perley, R. A., Riley, J. M., Schemer, P. A. G. 1992, MNRAS, 256, 186
- (10)
- (11) Carilli, C. L., Perley, R. A., Rehear, J. W., Leahy, J. P., 1991, ApJ 383, 554
- (12)
- (13) Carilli, C. L. & Harris, D. E. 1996, Cygnus A (Cambridge: Cambridge Univ. Press), p. 180
- (14)
- (15) Carilli, C. L.; Kurk, J. D.; van der Werf, Paul P.; Perley, R. A.; Miley, G. K., 1999, AJ 118, 2581
- (16)
- (17) Carvalho, J. C., Daly, R. A., Mory, M. P., O’Dea, C. P. 2005, ApJ, 620, 126
- (18)
- (19) Daly, R. A., Kharb, P., O’Dea, C. P., Baum, S. A., Mory, M. P., McKane, J., Altenderfer, C., Beury, M., 2010, ApJS, 187, 1
- (20)
- (21) Erlund, M. C., Fabian, A. C., Blundell, K. M., Crawford, C. S., Hirst, P., 2010, MNRAS, 404, 629
- (22)
- (23) Hardcastle, M. J., Croston, J. H., 2010, MNRAS, 404, 2018
- (24)
- (25) Hardcastle, M. J., Alexander, P., Pooley, G. G., Riley, J. M., 1998, MNRAS, 296, 445
- (26)
- (27) Hodges-Kluck, E. J., Reynolds, C. S., 2011, ApJ 733, 58
- (28)
- (29) Huarte-Espinosa, M., Krause, M., Alexander, P., 2011, MNRAS 418, 1621
- (30)
- (31) Jaffe, W. J., Perola, G. C., 1973, A&A 26, 423
- (32)
- (33) Kaiser, C. R., Alexander P., 1999, MNRAS 305, 707
- (34)
- (35) Kardashev, N. S., 1962, Soviet Astronomy 6, 317
- (36)
- (37) Laing, R. A., Bridle, A. H. 2002, MNRAS 336, 1161
- (38) Leahy, J. P., Black, A. R. S., Sennett-Thorpe, J., Hardcastle, M. J., Commissary, S., Perley, R. A., Riley, J. M., Schemer, P. A. G., 1997, MNRAS, 291, 20
- (39)
- (40) Machalski, J., Chyzy, K. T., Stawarz, L., Koziel, D., 2007, 462, 43
- (41)
- (42) Mathews, W. G., Guo, F. 2012, ApJ, 755, 13 (MG12)
- (43)
- (44) Mathews, W. G., Guo, F. 2010, ApJ, 724, 1440 (MG10)
- (45)
- (46) Machalski, J., Chyzy, K. T., Stawarz, L., Koziel, D., A&A, 2007, 462, 43
- (47)
- (48) Mocz, P., Fabian, A. C., Blundell, K. M., Goodall, P. T., Chapman, S. C., Saikia, D. J., 2011, MNRAS 417, 1576
- (49)
- (50) O’Dea, C. P., Daly, R. A., Kharb, P., Freeman, K. A., Baum, S. A., 2009, A&A, 494, 471
- (51)
- (52) Pacholczyk, A. G. 1970, Radio Astrophysics, (San Francisco:Freeman)
- (53)
- (54) Schekochihin, A. A., Cowley, S. C., Fincon, F., Rosin, M. S., 2010, MNRAS, 405, 291
- (55)
- (56) Stawarz, L., Cheung, C. C., Harris, D. E., Ostrowski, M., 2007, ApJ, 662, 213
- (57) Wilson, A. S., Smith, D. A., Young, A. J., 2006, ApJ 664, L9
- (58)
- (59) Yaji, Y., Tashiro, M. S., Isobe, N., Kino, M., Asada, K., Nagai, H., Koyama, S., Kusunose, M., 2010, ApJ, 714, 37
- (60)
| (kpc) | (kpc) | (G) | (erg/cm3Hz) | |||
|---|---|---|---|---|---|---|
| 0 | 60 | 0.5 | 62 | 58 | -0.23 | 0.25 |
| 1 | 50 | 3.7 | 77 | 13 | -0.18 | 0.041 |
| 2 | 40 | 6.2 | 126 | 31 | -0.056 | 0.018 |
| 3 | 30 | 8.7 | 167 | 44 | -0.025 | 0.0087 |
| 4 | 20 | 8.7 | 151 | 22 | -0.0082 | 0.0013 |
| (kpc) | (kpc) | (G) | (erg/cm3Hz) | |||
|---|---|---|---|---|---|---|
| 0 | 60 | 0.5 | 62 | 181 | 0.14 | 0.27 |
| 1 | 50 | 3.7 | 23 | 0.96 | -0.18 | 0.041 |
| 2 | 40 | 6.2 | 23 | 0.82 | -0.051 | 0.015 |
| 3 | 30 | 8.7 | 22 | 0.61 | -0.020 | 0.0068 |
| 4 | 20 | 8.7 | 22 | 0.45 | -0.0082 | 0.0013 |


: