The rise of SN 2014J in the nearby galaxy M 82
Abstract
We report on the discovery of SN 2014J in the nearby galaxy M 82. Given its proximity, it offers the best opportunity to date to study a thermonuclear supernova over a wide range of the electromagnetic spectrum. Optical, near-IR and mid-IR observations on the rising lightcurve, orchestrated by the intermediate Palomar Transient Factory (iPTF), show that SN 2014J is a spectroscopically normal Type Ia supernova, albeit exhibiting high-velocity features in its spectrum and heavily reddened by dust in the host galaxy. Our earliest detections start just hours after the fitted time of explosion. We use high-resolution optical spectroscopy to analyze the dense intervening material and do not detect any evolution in the resolved absorption features during the lightcurve rise. Similarly to other highly reddened Type Ia supernovae, a low value of total-to-selective extinction, , provides the best match to our observations. We also study pre-explosion optical and near-IR images from HST with special emphasis on the sources nearest to the SN location.
1 Introduction
Type Ia supernovae (SNe Ia) are among the most luminous transient events at optical wavelengths and extremely valuable tools to measure cosmological distances, see Goobar & Leibundgut (2011) for a recent review. Yet, SNe Ia close enough to allow for detailed scrutiny of their physical properties are very rare, especially in a galaxy like M 82, the host of several recent core-collapse supernovae (Mattila et al., 2013; Gendre et al., 2013). At an estimated distance to M 82 of 3.5 Mpc (Dalcanton et al., 2009), SN 2014J is the closest identified Type Ia SN in several decades, possibly rivaled by SN 1972E in NGC 5253 (Ardeberg & de Groot, 1973) and SN 1986G in NGC 5128 (Phillips et al., 1987). Thus, SN 2014J is exceptionally well-suited for follow-up observations in a wide range of wavelengths, from radio to gamma-rays. These have the potential to yield transformational new clues into the progenitor systems of SNe Ia, as well as the detailed properties of dust along the line of sight, key astrophysical unknowns for the study of the accelerated expansion of the universe.
There is strong evidence that SNe Ia arise from thermonuclear explosions of carbon-oxygen white dwarfs (WD) in binary systems (Nugent et al., 2011; Bloom et al., 2012). However, the nature of the second star remains unclear. For a long time, the preferred scenario was the single degenerate (SD) model (Whelan & Iben, 1973), where a WD accrets mass from a hydrogen or helium rich donor star, thus becoming unstable while approaching the Chandrasekhar mass. The double-degenerate (DD) model involving the merger of two WDs (Tutukov & Yungelson, 1981; Iben & Tutukov, 1984; Webbink, 1984) has gained considerable observational support in recent years, see e.g., Wang & Han (2012).
In this work, we search for potential signatures of a SD progenitor system, such as variable Na D lines, precursor nova eruptions, features in the early lightcurve, radio emission, or a coincident source in pre-explosion in HST images.
2 Discovery and classification
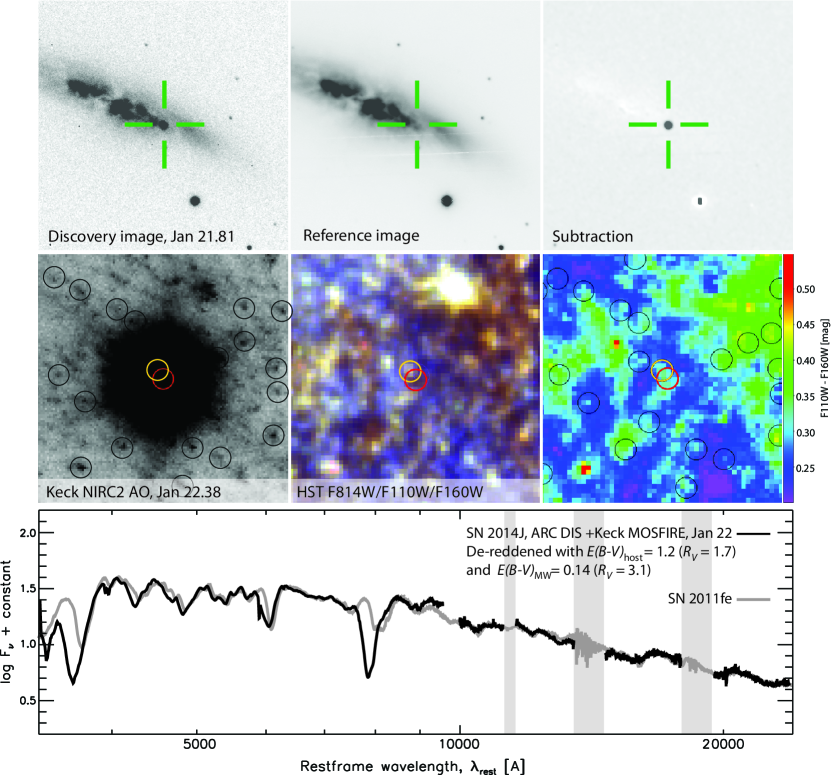
SN 2014J was discovered by Fossey et al. (2014) in -band images of M 82 obtained on 2014 January 21.81 UT at UCL’s University of London Observatory. We have performed image subtractions using pre-explosion data from the Palomar P60 telescope as reference, calibrated with nearby stars listed in the APASS catalog111http://www.aavso.org/apass yielding a discovery magnitude of mag. The discovery image (S. Fossey, private communication) and the P60 reference image, as well as the difference between the two are shown in Fig. 1, along with the pre-explosion HST images (GO:11360, PI: R. O’Conell; GO:10776, PI: M. Mountain). The relative position of SN 2014J with respect to neighboring stars (middle panel) was established using multiple short exposures in -band with adaptive optics and the NIRC2 wide camera at Keck (Tendulkar et al., 2014). In Section 5 we present a detailed analysis of the pre-explosion data.
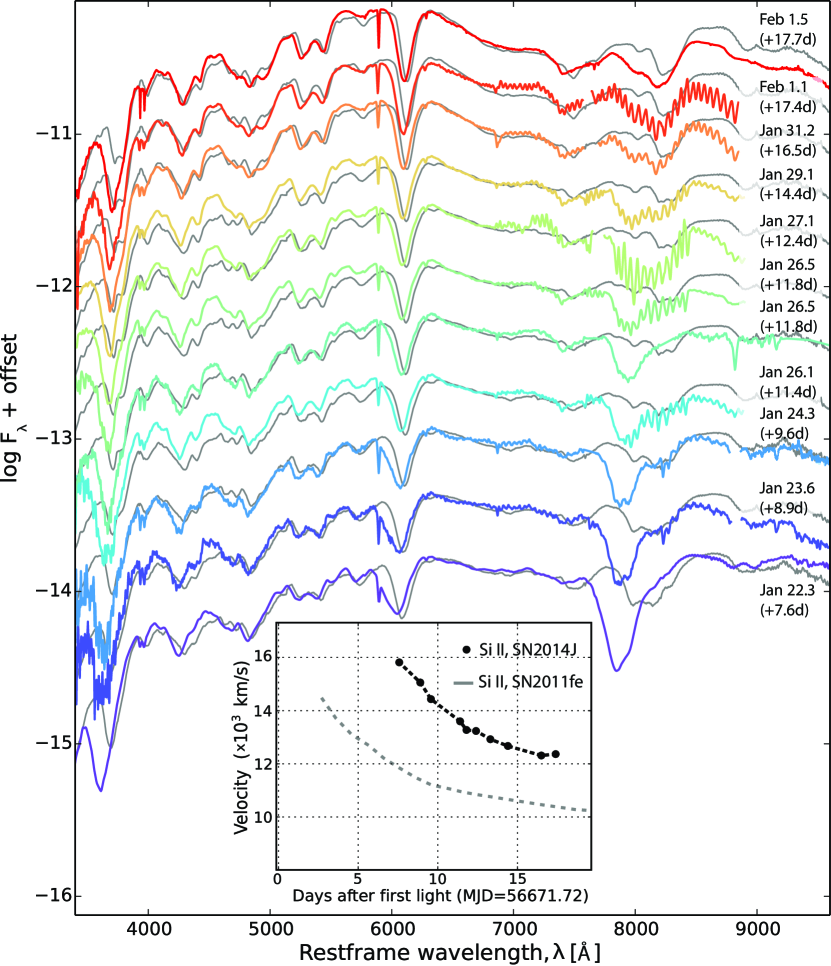
A classification spectrum was obtained by the iPTF team on January 22.30 with the Dual Imaging Spectrograph on the ARC 3.5m telescope (Cao et al., 2014), and in the near-IR using the MOSFIRE instrument at Keck. The combined spectra are shown in the bottom panel of Fig. 1, while the photometry collected so far is displayed in Fig. 2. The object shows characteristic spectral features associated with SNe Ia, e.g., similar to SN 2011fe (Pereira et al., 2013; Hsiao et al., 2013). However, the steep attenuation of the spectrum at short wavelengths is indicative of unusually large extinction by dust in the line of sight. A good match to the overall SED is found invoking a pronounced color excess, mag, in addition to Galactic reddening, mag (Schlafly & Finkbeiner, 2011), as shown in Fig. 3. For the comparison, the spectra of SN 2011fe were artificially reddened assuming a Milky-Way type extinction law (Cardelli et al., 1989), where both the color excess and were allowed to vary freely. The spectrum favors a low value of the total-to-selective extinction, , as also suggested by spectropolarimetry observations by Patat et al. (2014). Low values of RV are not unusual in SNe Ia, especially in the cases of high extinction, see e.g. Nobili & Goobar (2008).
3 The iPTF-led multi-wavelength monitoring of SN 2014J in M 82
As a part of its continuous survey of the sky in the search for transients, iPTF has monitored M 82 since October 2009, with nearly daily cadence over the several months each year when M 82 is visible from Palomar. The most recent campaign started on 2013, November 28. For the periods around full moon (e.g., around the time SN 2014J exploded), not well suited for transient searches, narrow-band imaging was conducted.
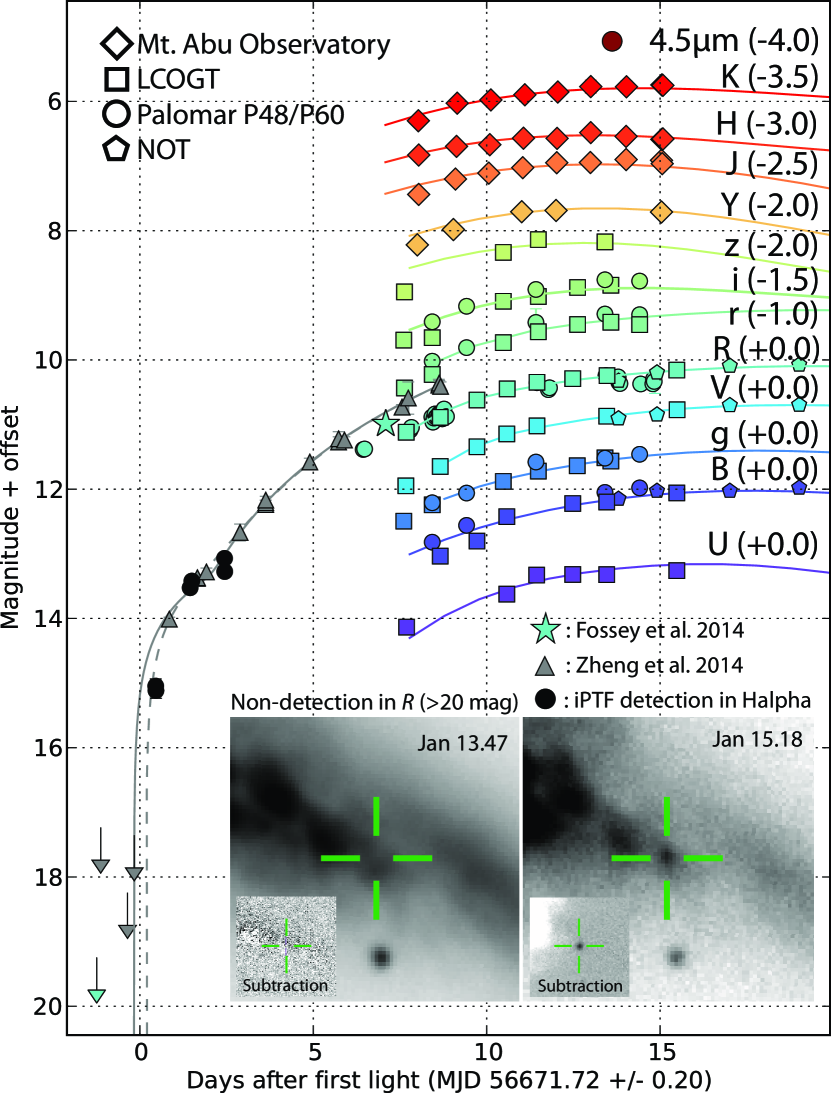
The current best fit of the time of explosion, , was reported by KAIT (Zheng et al., 2014) to be January 14.72 UT ( 0.2 days). Upon later scrutiny of the pre-discovery P48 data, the supernova was found in several observations from the iPTF narrow-band survey, starting just hours after the fitted . We find a relative flux increase from January 15.18 to January 16.18 of 1.6 mag, consistent with the “method 2 fit” in Zheng et al. (2014). The SN is also prominent on -band photometry from the P48 prior to January 21 shown in Fig. 2, but remained undetected by our automated software due to pixel saturation.
Through an iPTF-led effort, involving also the Las Cumbres Observatory Global Telescope (LCOGT) network (Brown et al., 2013), the Nordic Optical Telescope and the Mount Abu Observatory (Venkataraman et al., 2014), we have secured optical, near-IR and mid-IR lightcurves carefully monitoring the rise of the supernova, as shown in Fig. 2. The m observations were taken under the Spitzer InfraRed Intensive Transients Survey (SPIRITS; PI: Kasliwal).
The spectra shown in Fig. 3 are consistent with those from a normal Type Ia explosion, similar to e.g., SN 2011fe, but reddened following a CCM-law (Cardelli et al., 1989) with mag and , in addition to Galactic reddening. Fig. 2 also shows lightcurve fits using the SNooPy fitter (Burns et al., 2011) of the photometric data prior to maximum brightness. Best fits are found for mag and . We expect the accuracy of the fitted parameters to improve, as the lightcurve shape estimate will profit from the decreasing part of the SN lightcurve. However, the available data clearly puts well below the Galactic average value, .
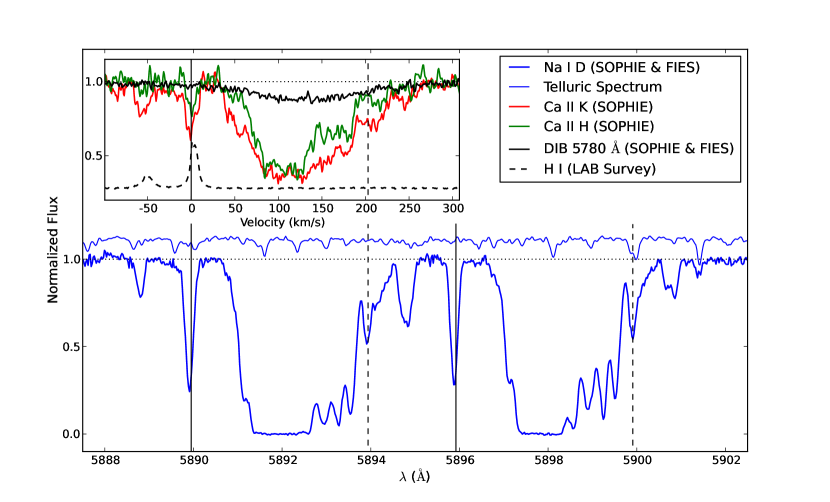
We also obtained two 1800 s high-resolution (R = 40000) spectra with SOPHIE at Observatorie Haute-Provence on January 26.0 and January 28.0. Further, two 1800 s spectra (R = 67000) were obtained with the FIbre-fed Echelle Spectrograph (FIES) on January 27.3 and another on February 1.0 with the Nordic Optical Telescope.
All spectra reveal deep multiple component Na I D absorption and diffuse interstellar bands (DIBs), including 5780,5797,6284, and 6614, also reported by Cox et al. (2014) and Kotak (2014). The SOPHIE spectra further contain well resolved Ca II H & K with features matching those of the Na I D lines, shown in the co-added spectrum in Fig 4. We have not detected any significant time evolution for any of the resolved components of the Na I D doublet over the four epochs (at the 10% level for ), thus motivating the combination of the spectra.
Following the procedure outlined by Phillips et al. (2013), we measure the equivalent width (EW) of the 5780 DIB to derive an independent estimate of host galaxy extinction for SN 2014J. We find EW(5780) = 0.48 Å corresponding to mag.
Given the low recession velocity of M 82, it is difficult to separate the contribution from the Milky-Way and the SN host galaxy absorption. However, the availability of H I data from the LAB survey222http://www.astro.uni-bonn.de/en/download/data/lab-survey/ in the direction of M 82 (see inset panel in Fig. 4; Kalberla et al. (2005)) clearly indicates which features are Galactic. Hence, all the absorption features redshifted with respect to the Milky Way are due to intervening material in M 82.
4 Spectral modeling
In Fig. 3 we present a time-series spectral comparison between SN 2011fe and SN 2014J starting roughly 12 days before peak brightness. The SNe are remarkably similar in their spectral evolution. The main differences seen are that the overall velocities are higher in SN 2014J (see the inset Si II velocity plot) and there is a strong signature of high-velocity Si II and Ca II in this supernova.
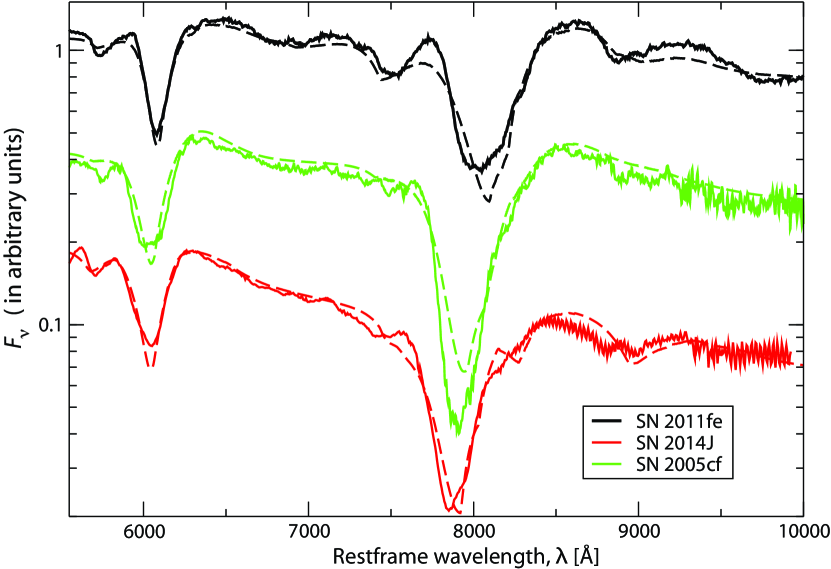
To further investigate these differences we carried out a set of SYNAPPS (Thomas et al., 2011) fits to these two supernovae as well as to SN 2005cf, which was distinct in its pervasive high-velocity features (Wang et al., 2009). We present the results in Fig. 5. In our fits to the red-side of the optical spectra we have employed the ions: C II, O I, Mg II, Si II and Ca II with the latter two having both photospheric and high-velocity components. We see that SN 2014J more closely resembles SN 2005cf with respect to the high-velocity Si II and Ca II features which extend easily over the range of 20,000-30,000 km s-1. Unlike either SN 2005cf or SN 2011fe, C II and O I are absent at this phase in SN 2014J. We searched for the presence of C I 1.0693 line in our NIR spectrum, but the signal-to-noise is too low to do a meaningful fit comparable to that done for SN 2011fe (Hsiao et al., 2013). We do note that due to the stronger than average Mg II features seen in the optical for SN 2014J, this analysis may be more challenging, even with higher quality spectra, as the presence of Mg II 1.0927 should be quite strong as well.
Several explanations for the origin of the high-velocity features have been presented, from density enhancements via swept up CSM (Gerardy et al., 2004; Tanaka et al., 2006) to mixing or more complete burning in the outer layers of the supernova (Mazzali et al., 2005a, b) to ionization effects in the outer layers (Blondin et al., 2013). What is clear is that the features do offer a unique diagnostic for understanding properties of the progenitor system and/or the explosion mechanism and correlations between the strength of these features and the underlying colors and lightcurves of the SNe Ia (Childress et al., 2014; Maguire et al., 2013).
SN 2014J is among a class of SNe Ia where high-velocity features are present yet little to no evidence for C II exists even in very early spectra (see the broad line or high-velocity gradient examples in Parrent et al. (2011)). Since extensive UV data from HST exists for both SNe 2005cf and 2011fe, it will be interesting to see which of these supernovae SN 2014J most closely matches with respect to both the color and luminosity evolution.
5 The quest for the progenitor system
M 82 has been extensively imaged by HST, thus it is possible to study the environment of the SN prior to the explosion. Because of the large attenuation due to dust in the line of sight, we concentrate on the NIR bands. We perform aperture photometry on the nearest sources to SN 2014J, shown in Fig. 1. The closest object (yellow circle in Fig. 1) falls 0.2 from the current best estimate of the SN location (RA = , Dec = in J2000 coordinates with respect to the HST image, Tendulkar et al., 2014), corresponding to a spatial offset. For this source, we measure AB magnitudes of , , , . The error is dominated by the uncertain background subtraction as a result of source confusion. The color is typical of other sources near this position. At a distance of 3.5 Mpc, the corresponding absolute magnitude of the nearest resolved object is mag ( mag). This source could represent a stellar cluster, a grouping of unrelated objects or a region of relatively low dust attenuation.
Next, we consider the possibility that the source is a donor star in the SD scenario. The derived luminosity would then suggest a very luminous red supergiant. However, in the case where a SN originates from a system with CSM created by a mass-loss from a donor star, the interaction between the SN ejecta and the CSM is expected to give rise to radio emission (Chevalier, 1982, 1988). The radio null-detections on January 23 and 24 (Chomiuk et al., 2014; Chandler & Marvil, 2014) can therefore be used to derive an upper limit on the mass-loss rate. Adopting a SN shock-wave velocity of (about twice the Si II velocity, see Fig. 3), and similar parameters as assumed by Horesh et al. (2012) for SN 2011fe, the upper limit on the mass-loss rate is , where is the mass-loss wind velocity. The upper limit is comparable to the ones obtained for SN 2011fe (Horesh et al., 2012; Chomiuk et al., 2012). Given these tight limits and the spatial displacement, we conclude that the closest resolved source in the pre-explosion HST images is unlikely to be a donor star.
Finally, we note that the color map shown in the middle right panel of Fig 1 suggests that SN 2014J is at the edge of a dust patch, about 4 pc in projected size. Light echoes may thus be expected for this supernova.
We have searched for possible nova outbursts in the historic P48 -band data covering a period of about 1500 days prior to the detection of SN 2014J. By binning the data in bins of 15 days, we do not find any excess larger than (calculated using the bootstrap technique, see Efron (1982)). Our limiting magnitude is mag for a total time span of 1000 days, and mag for more than 765 days in this 1500 days time window. Assuming mag, compatible with the extinction we estimate based on the supernova colors, this corresponds to absolute magnitudes and respectively at the distance of M 82. However, given the uncertainties on the properties of recurrent novae, see e.g. Tang et al. (2014), we refrain from drawing firm conclusions against the possibility of recurrent novae preceding SN 2014J based on these non-detections.
6 Summary and conclusions
The discovery of SN 2014J presents us with a unique opportunity to explore the physics of Type Ia SNe and the line-of-sight effects due to intervening matter. Further understanding in these areas is of utmost importance for the use of SNe Ia in cosmology. The early data from P48, starting as early as only hours from the explosion, and the multi-wavelength follow-up by the iPTF team covers an important range of the available windows in the electromagnetic spectrum. Just as the lightcurve reaches its maximum, we have learned that the SN has suffered non-standard extinction. We have searched for, but not detected, any time variation in our high-resolution spectra of the Na I D doublet. Similarly, we do not detect any pre-explosion activity in the 1500 days of P48 monitoring. In a study of pre-explosion HST images in the near-IR, the nearest resolved source is found away from the SN location. The source brightness and offset from the SN makes it unlikely as a donor star in a single-degenerate scenario.
Further, we make a first study of the spectral features of SN 2014J and find that it exhibits high-velocity features from intermediate mass material but lacks C and O often seen in very early spectra. Otherwise, it is a very similar to several well-studied normal SNe Ia.
References
- Ardeberg & de Groot (1973) Ardeberg, A., & de Groot, M. 1973, A&A, 28, 295
- Benetti et al. (2005) Benetti, S., Cappellaro, E., Mazzali, P. A., et al. 2005, ApJ, 623, 1011
- Blondin et al. (2013) Blondin, S., Dessart, L., Hillier, D. J., & Khokhlov, A. M. 2013, MNRAS, 429, 2127
- Bloom et al. (2012) Bloom, J. S., Kasen, D., Shen, K. J., et al. 2012, ApJ, 744, L17
- Brown et al. (2013) Brown, T. M., Baliber, N., Bianco, F. B., et al. 2013, PASP, 125, 1031
- Burns et al. (2011) Burns, C. R., Stritzinger, M., Phillips, M. M., et al. 2011, AJ, 141, 19
- Cao et al. (2014) Cao, Y., Kasliwal, M. M., & McKay, A. 2014, The Astronomer’s Telegram, 5786, 1
- Cardelli et al. (1989) Cardelli, J. A., Clayton, G. C., & Mathis, J. S. 1989, ApJ, 345, 245
- Chandler & Marvil (2014) Chandler, C. J., & Marvil, J. 2014, The Astronomer’s Telegram, 5812, 1
- Chevalier (1982) Chevalier, R. A. 1982, ApJ, 259, L85
- Chevalier (1988) —. 1988, Nature, 332, 514
- Childress et al. (2014) Childress, M. J., Filippenko, A. V., Ganeshalingam, M., & Schmidt, B. P. 2014, MNRAS, 437, 338
- Chomiuk et al. (2014) Chomiuk, L., Zauderer, B. A., Margutti, R., & Soderberg, A. 2014, The Astronomer’s Telegram, 5800, 1
- Chomiuk et al. (2012) Chomiuk, L., Soderberg, A. M., Moe, M., et al. 2012, ApJ, 750, 164
- Cox et al. (2014) Cox, N. L. J., Davis, B. A., Patat, F., & Van Winckel, H. 2014, The Astronomer’s Telegram, 5797, 1
- Dalcanton et al. (2009) Dalcanton, J. J., Williams, B. F., Seth, A. C., et al. 2009, ApJS, 183, 67
- Efron (1982) Efron, B. 1982, The Jackknife, the Bootstrap and other resampling plans
- Fossey et al. (2014) Fossey, S., Cooke, B., Pollack, G., et al. 2014, IAU Central Bureau for Astronomical Telegrams, 3792, 1
- Gendre et al. (2013) Gendre, M. A., Fenech, D. M., Beswick, R. J., Muxlow, T. W. B., & Argo, M. K. 2013, MNRAS, 431, 1107
- Gerardy et al. (2004) Gerardy, C. L., Höflich, P., Fesen, R. A., et al. 2004, ApJ, 607, 391
- Goobar & Leibundgut (2011) Goobar, A., & Leibundgut, B. 2011, Annual Review of Nuclear and Particle Science, 61, 251
- Horesh et al. (2012) Horesh, A., Kulkarni, S. R., Fox, D. B., et al. 2012, ApJ, 746, 21
- Hsiao et al. (2013) Hsiao, E. Y., Marion, G. H., Phillips, M. M., et al. 2013, ApJ, 766, 72
- Iben & Tutukov (1984) Iben, Jr., I., & Tutukov, A. V. 1984, ApJS, 54, 335
- Kalberla et al. (2005) Kalberla, P. M. W., Burton, W. B., Hartmann, D., et al. 2005, A&A, 440, 775
- Kotak (2014) Kotak, R. 2014, The Astronomer’s Telegram, 5816, 1
- Maguire et al. (2013) Maguire, K., Sullivan, M., Patat, F., et al. 2013, MNRAS, 436, 222
- Mattila et al. (2013) Mattila, S., Fraser, M., Smartt, S. J., et al. 2013, MNRAS, 431, 2050
- Mazzali et al. (2005a) Mazzali, P. A., Benetti, S., Stehle, M., et al. 2005a, MNRAS, 357, 200
- Mazzali et al. (2005b) Mazzali, P. A., Benetti, S., Altavilla, G., et al. 2005b, ApJ, 623, L37
- Nobili & Goobar (2008) Nobili, S., & Goobar, A. 2008, A&A, 487, 19
- Nugent et al. (2011) Nugent, P. E., Sullivan, M., Cenko, S. B., et al. 2011, Nature, 480, 344
- Parrent et al. (2011) Parrent, J. T., Thomas, R. C., Fesen, R. A., et al. 2011, ApJ, 732, 30
- Patat et al. (2014) Patat, F., Taubenberger, S., Baade, D., et al. 2014, The Astronomer’s Telegram, 5830, 1
- Pereira et al. (2013) Pereira, R., Thomas, R. C., Aldering, G., et al. 2013, A&A, 554, A27
- Phillips et al. (1987) Phillips, M. M., Phillips, A. C., Heathcote, S. R., et al. 1987, PASP, 99, 592
- Phillips et al. (2013) Phillips, M. M., Simon, J. D., Morrell, N., et al. 2013, ApJ, 779, 38
- Schlafly & Finkbeiner (2011) Schlafly, E. F., & Finkbeiner, D. P. 2011, ApJ, 737, 103
- Stritzinger et al. (2002) Stritzinger, M., Hamuy, M., Suntzeff, N. B., et al. 2002, AJ, 124, 2100
- Tanaka et al. (2006) Tanaka, M., Mazzali, P. A., Maeda, K., & Nomoto, K. 2006, ApJ, 645, 470
- Tang et al. (2014) Tang, S., Bildsten, L., Wolf, W. M., et al. 2014, ArXiv e-prints, arXiv:1401.2426
- Tendulkar et al. (2014) Tendulkar, S. P., Liu, M. C., Dupuy, T. F., & Cao, Y. 2014, The Astronomer’s Telegram, 5789, 1
- Thomas et al. (2011) Thomas, R. C., Nugent, P. E., & Meza, J. C. 2011, PASP, 123, 237
- Tutukov & Yungelson (1981) Tutukov, A. V., & Yungelson, L. R. 1981, Nauchnye Informatsii, 49, 3
- Venkataraman et al. (2014) Venkataraman, V., Banerjee, D. P. K., Joshi, V., Ashok, N., & Bhalerao, V. 2014, The Astronomer’s Telegram, 5793, 1
- Wang & Han (2012) Wang, B., & Han, Z. 2012, New A Rev., 56, 122
- Wang et al. (2009) Wang, X., Li, W., Filippenko, A. V., et al. 2009, ApJ, 697, 380
- Webbink (1984) Webbink, R. F. 1984, ApJ, 277, 355
- Whelan & Iben (1973) Whelan, J., & Iben, Jr., I. 1973, ApJ, 186, 1007
- Zheng et al. (2014) Zheng, W., Shivvers, I., Filippenko, A. V., et al. 2014, ArXiv e-prints, arXiv:1401.7968