Author(s) in page-headRunning Head \Received2000/12/31\Accepted2001/01/01
acceleration of particles — ISM: individual (W28) — ISM: supernova remnants — X-rays: ISM
X-ray Spectroscopy of the Mixed Morphology Supernova Remnant W28 with XMM-Newton
Abstract
We report on spatially resolved X-ray spectroscopy of the north-eastern part of the mixed morphology supernova remnant (SNR) W28 with XMM-Newton. The observed field of view includes a prominent and twisted shell emission forming the edge of this SNR as well as part of the center-filled X-ray emission brightening toward the south-west edge of the field of view. The shell region spectra are in general represented by an optically thin thermal plasma emission in collisional ionization equilibrium with a temperature of 0.3 keV and a density of 10 cm-3, which is much higher than the density obtained for inner parts. In contrast, we detected no significant X-ray flux from one of the TeV -ray peaks with an upper-limit flux of 2.110-14 erg cm-2 s-1 in the 2–10 keV band. The large flux ratio of TeV to X-ray, larger than 16, and the spatial coincidence of the molecular cloud and the TeV -ray emission site indicate that the TeV -ray of W28 is -decay emission originating from collisions between accelerated protons and molecular cloud protons. Comparing the spectrum in the TeV band and the X-ray upper limit, we obtained a weak upper limit on the magnetic field strength 1500 G.
1 Introduction
Supernova remnants (SNRs) are one of the most promising acceleration sites of cosmic rays up to eV (the knee energy). Koyama et al. (1995) discovered synchrotron X–rays from the shell of SN 1006, indicating the existence of extremely high-energy electrons up to TeV produced by the first-order Fermi acceleration. Following this discovery, the synchrotron X-ray emission has been discovered from a few more young shell-type SNRs, such as RX J1713.7–3946 (Koyama et al., 1997), RCW 86 (Bamba et al., 2000a; Borkowski et al., 2001a), and RX J0852.04622 (Tsunemi et al., 2000). On the other hand, TeV –rays have also been detected from some SNRs (Aharonian et al., 2004; Aharonian et al., 2006). The radiation of TeV -ray is explained by (1) Inverse-Compton scattering (IC) of cosmic microwave background photons by the same high energy electron giving rise to the X-ray synchrotron emission, (2) non-thermal bremsstrahlung by high energy elections or (3) the decay of neutral pions that are generated by collisions between high energy protons and dense interstellar matter.
Most of the SNRs with such a X-ray and TeV -ray evidence have been young with an age of less than several thousands of years. Recently, Fermi discovered GeV -rays from several SNRs, such as W44 (Abdo et al., 2010a), IC443 (Abdo et al., 2010b), W51C (Abdo et al., 2009a), and so on. Interesting fact is that they are not only young but rather old SNRs compared with the TeV -ray emitting SNRs. It can be due to the escape of high energy particles from the shocks (Ohira et al., 2011; Ellison & Bykov, 2011; Li & Chen, 2012; Telezhinsky et al., 2012; Nava & Gabici, 2013). Most SNRs with GeV -rays are interacting with molecular clouds, so it may be related with the escape. However, it is still unknown the detailed picture how particles escapes from the shocks.
The SNR W28, locating at (, ) = (, ), is an interesting target as a cosmic-ray accelerator from which both GeV and TeV -rays were detected from the eastern edge of the radio shell (Abdo et al. (2009b); Aharonian et al. (2008)). The diameter and the distance to W28 are 48 arcmin and 1.9 kpc, respectively (Velázquez et al., 2002). The age seems to be several times 104 year, which means the remnant is middle-aged (Rho & Borkowski, 2002). W28 is classified as “mixed–morphology” SNR, showing center-filled X-rays and a shell-like radio emission. The shell-like radio emission peaks at the northern and northeastern boundaries where interaction of the SNR matter with the molecular cloud is established (Wootten, 1981). This interaction was revealed by a lot of OH maser spots (Frail et al., 1994; Claussen et al., 1997; Hoffman et al., 2005), which are signposts of molecular interactions and the location of high density shocked gas (104 cm-3; Arikawa et al. (1999)). TeV -ray emission was detected by H.E.S.S. (Aharonian et al., 2008) from the eastern edge of the radio shell. Recently, Fermi and AGILE also detected -rays at 100 MeV 100 GeV (Abdo et al., 2010c; Giuliani et al., 2010) from the same region of the TeV emission. In contrast, the emission in the X-ray band had been believed to comprise of thermal radiation. Rho & Borkowski (2002) evaluated temperatures of 1.5 keV in the southwest, 0.56 keV in the northeast, and the central region requires two-temperature plasma with 0.6 keV and 1.8 keV. The long ionization timescales in the northeast and central region imply that the gas is close to the ionization equilibrium. Recently, Suzaku discovered that the thermal X-ray emission from the inner region is over-ionized, implying that the plasma may underwent the sudden rarefaction (Sawada & Koyama, 2012). These facts imply that W28 is an ideal target to study the particle escape from the shock.
We analyzed XMM-Newton archival data of the north–eastern part of W28, where the molecular clouds, OH maser spots, bright X-ray shells, GeV and TeV emission were detected. XMM-Newton has large effective area and high angular resolution. These characteristics enable us to carry out high quality spatially resolved spectroscopy. In § 2, we present the observation log and data reduction method. Imaging and spectral analyses are shown in § 3 and § 4, respectively. From one of the TeV -ray emission region, we obtained only the upper limit on the X-ray flux. Discussions are made on the basis of these results in § 5 on the nature of the thermal and non-thermal components in multi-wavelength. Finally we summarize our results in § 6.
2 Observation and Data Reduction
The north-eastern part of W28 was observed with the European Photon Imaging Camera (EPIC) on board XMM-Newton Observatory on 2002 September 23 (ObsID = 0145970101) and 2003 October 7 (ObsID = 0145970401). The nominal pointing position was , (J2000). All of the EPIC instruments were operated in the full-frame mode with a thick filter. We used version 7.0.0 of the Standard Analysis System (SAS) software, and selected X-ray event with PATTERN keywords of 12 for the MOS1/2 and 4 for the pn, respectively.
The net exposure times were 54.1 ks and 49.9 ks for the MOS1/2 and the pn, respectively, after combining the 2002 and 2003 data. To remove the high particle background time intervals, we accumulated a lightcurve in the 10–12 keV band from the whole field of view, and filtered the time intervals when the count rate was larger than 0.35 counts s-1 for the MOS and 0.4 counts s-1 for the pn. After this screening, the effective exposure time of MOS1, MOS2, and pn were 51.9 ks, 52.1 ks and 39.6 ks, respectively.
3 Image Analysis
Figure 1 shows the exposure-corrected MOS images in 0.3–2.0 keV and 2.0–10.0 keV with a binning size of \timeform25”.6.
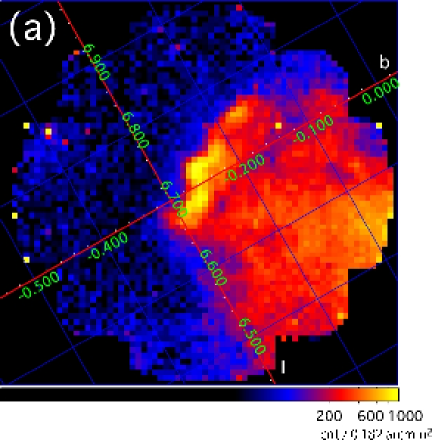
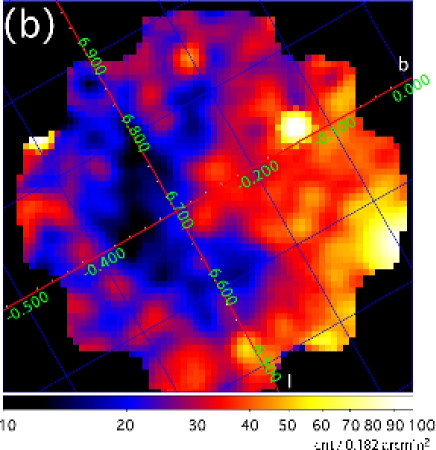
They were created by combining all the MOS1/2 data from the 2002 and 2003 observations. In the low-energy band (figure 1a), the shell region located at (, ) (, ) is the brightest. Its shape is twisted in a complex manner. The inner region of W28, toward the southwest of the image, is also enhanced in surface brightness. In the high energy band (figure 1b), on the other hand, the shell region is much fainter than the inner region.
In figure 2 shown are intensity contours of CO (J = 3–2) and CO (J = 1–0) in red and blue (Arikawa et al., 1999) and those of TeV -ray measured with H.E.S.S. in yellow (Aharonian et al., 2008), overlaid on the 0.3–2.0 keV gray scale MOS image (figure 1a).
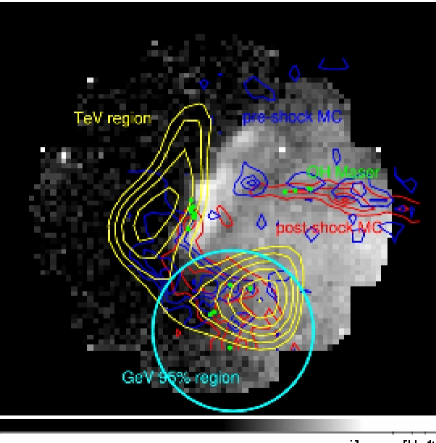
The CO J =3–2 and 1–0 contours trace distributions of post-shock and pre-shock molecular clouds, respectively (Arikawa et al., 1999). The green dots represent OH maser spots, which also indicate presence of shock waves (Claussen et al., 1997). GeV emission is from the same region of TeV emission (Abdo et al., 2010c; Giuliani et al., 2010). The eastern bunch of the OH maser sources spatially coincides with the edge of the X-ray bright shell, as well as the edge of the eastern molecular cloud. This indicates that the shock is formed there. Edge of one of the TeV -ray peaks seems to appear at the same position. OH maser spots are also detected with spatial coincidence with a molecular cloud region which extends linearly from the X-ray shell toward western edge of the image. In the southern part of the image, the molecular clouds coincide with the other TeV -ray emission peak, where the surface brightness of the X-ray emission is somewhat reduced. From this region, several OH maser spots are also detected. They are all within the error circle of the GeV -ray source.
4 Spectral Analysis
In this section, we present the results of spatially-resolved spectral analysis. We concentrate our analysis on the shell regions and the eastern peak of the TeV -ray emission, since the inner region has been studied with good statistics of Suzaku (Sawada & Koyama, 2012). In evaluating the spectra, we have utilized xspec (version 11.3.2) in the band 0.3–10.0 keV. We have created ancillary response files (ARF) by assuming flat brightness distribution within each source integration region. As emission spectral models, we basically adopt the nei model to represent optically thin thermal spectra in ionization non-equilibrium. In some cases where the nei model indicates the ionization equilibrium, we utilize the apec model also. In applying these models to the data, we adopt the metal composition of Anders & Grevesse (1989) as the solar abundance. To represent interstellar absorption, we multiply the model phabs on these emission models. In the course of the spectral fitting, we have found that there remain wiggles in the fit residual. This is caused by difference of gain among the CCD chips of MOS-1/2 and the inaccuracy of calibration of the line spread function. Accordingly, we always multiply a Gaussian smoothing model (gsmooth in xspec) on the emission models. The errors quoted are always at the 90% confidence level.
4.1 North-eastern shell region
In figure 3 (a) shown with ellipses are regions 1 through 3 for collecting photons from the north-eastern shell, overlaid on the 0.3–10 keV MOS image.
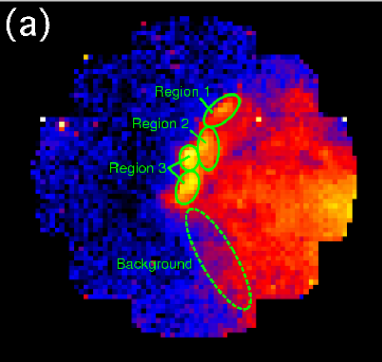

The dashed ellipse is the background region. This region is taken symmetrical to regions 1 through 3 with respect to the peak of the center-filled brightness distribution of W28 as well as to the optical axis position of the current field of view, in order to elucidate the nature of an excess emission from the shell.
The background-subtracted MOS spectra are shown in figure 3 (b) which are combined ones of MOS1 and MOS2 from the 2002 and 2003 observations. The black, red and blue crosses represent the data points from region 1, 2 and 3, respectively. We have detected obviously He-like K emission lines from O (0.57 keV), Ne (0.91 keV), Mg (1.34 keV), Si (1.86 keV), and L lines of Fe around 1 keV. This means that the spectra include an optically thin thermal component. We therefore tried to fit the spectra with a single temperature non-equilibrium collisional ionization plasma emission model (vnei model in xspec; Borkowski et al. (2001b); Hamilton et al. (1983); Borkowski et al. (1994); Liedahl et al. (1995)) undergoing photoelectric absorption represented with a single hydrogen column density . In the fitting, we set abundances of O, Ne, Mg, Si, and Fe free to vary but constrained to be common among the regions, because no statistically significant difference in the abundances are found among the regions in a trial fit. The abundances of the other elements are fixed at the solar values. The fitting is acceptable with the reduced of 0.91. As a result, however, we found an ionization parameter of cm-3s, which indicates the shell plasma is in collisional ionization equilibrium. Accordingly, we replaced the vnei model with a vapec model which represents a spectrum from a plasma in collisional ionization equilibrium111http://hea-www.harvard.edu/APEC. The best-fit parameters are summarized in table 1, and the best-fit models as well as the residuals are displayed in figure 3 (b).
| Parameters | Region 1 | Region 2 | Region 3 |
|---|---|---|---|
| vapec | |||
| Temperature [keV] | 0.37 | 0.30 | 0.28 |
| Abundance aafootnotemark: a O | 0.29 | ||
| Ne | 0.33 | ||
| Mg | 0.39 | ||
| Si | 0.62 | ||
| Fe | 0.42 | ||
| E.M. bbfootnotemark: b | 1.8 | 10 | 22 |
| ccfootnotemark: c | 6.2 | 8.2 | 7.5 |
| gsmooth | |||
| (MOS) ddfootnotemark: d | 0.11 | 0.088 | 0.094 |
| (pn) ddfootnotemark: d | 0.11 | 0.23 | 0.17 |
| index eefootnotemark: e | 1.0 (fix) | 1.0 (fix) | 1.0 (fix) |
| /d.o.f (reduced ) | 461.6 / 546 (0.85) | ||
|
aafootnotemark: a
Abundance ratio relative to the
solar value (Anders & Grevesse, 1989). The abundances are common over the regions.
bbfootnotemark: b Emission measure E.M. = in units of 1056 cm-3, where and are the electron density and the plasma volume. The distance to W28 is assumed to be 1.9 kpc (Velázquez et al., 2002). ccfootnotemark: c Absorption hydrogen column density in units of 1021 cm-2. ddfootnotemark: d Gaussian sigma at 6 keV in a unit of keV. eefootnotemark: e Energy index of , namely, . |
|||
Note that we used both MOS and pn data for spectral fitting, although only MOS spectra are shown in figure 3 (b) for clarity. The reduced of 0.85 implies that the fit is acceptable at the 90% confidence level. The temperatures are obtained to be keV, keV, and keV for regions 1, 2, and 3, respectively. The temperature decreases from north to south in the shell. We note that the temperature we obtained are lower than that of 0.6 keV in Rho & Borkowski (2002). The temperature difference should be due to the different background regions. The spectral analysis of background region we used is shown in §4.2. The hydrogen column density are (6.2 cm-2, (8.2 cm-2 and (7.5 cm-2 for regions 1, 2, and 3, respectively. The hydrogen column densities of region 2 and region 3 near the molecular cloud are higher than that of region 1. The abundances of O, Ne, Mg, Si, and Fe are lower than the solar values.
4.2 TeV -ray region
We investigated X-ray spectrum of a region where intense TeV –ray emission is detected in spite of no apparent X-ray emission. In figure 4(a) shown are the TeV -ray intensity contours (the same as in figure 2, Aharonian et al. (2008)) overlaid on the X-ray gray-scale image.
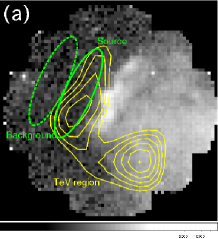
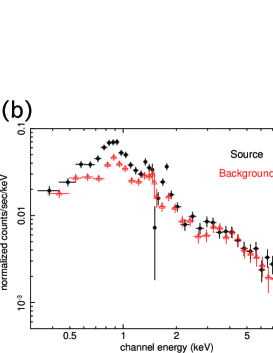
Although the TeV -ray surface brightness has a dual peak structure, we concentrated on the north-eastern peak, and extracted the source spectrum from the ellipse region located at (, ) (, ), as shown in figure 4(a) in green, because the southern peak centered at (, ) (, ) is partly included in the south-eastern rim and difficult to estimate nonthermal emission. The choice of the source integration region adopted here also intends to exclude the thermal emission from the north-eastern shell region. The dashed ellipse in Figure 4 is, on the other hand, a background region. Figure 4(b) shows the source and the background spectra thus extracted, from which the Non X-ray Background (NXB) spectrum evaluated out of the telescope field of view are already subtracted. We have excess below 2 keV, which may be be stray light from W28 shell, which is very difficult to estimate correctly. Since we are interested in non-thermal emission associated with the TeV -ray emission, we hereafter use the data only in the band 2–10 keV.
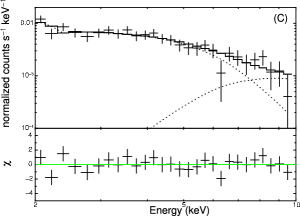
The effective area of the background region is smaller than the source region due to telescope vignetting. We checked the vignetting effect by using the Lockman Hole archival data observed on 2002 December 27 to 29 (Obs ID = 0147511601) with the total effective exposure time of 110 ks. A count ratio of the background to source regions at the same detector positions was found to be 0.88 in the 2–10 keV band. In evaluating flux of the possible non-thermal X-ray emission, we first made an arbitral model of the background spectrum to reconstruct the background emission in the source region. Note that it is a mixture of Galactic ridge emission, cosmic X-ray background, and position-dependent NXB, so the resultant parameters have no physical meaning. The two power-law model showed accepted fit with the photon indices of 0.85 and 5.8, as shown in Fig. 4(c). The source spectrum was fitted with a model comprising of the two power-law models with the normalizations being multiplied by the vignetting-correction factor, and an additional power-law model representing the putative non-thermal X-ray emission, with the frozen photon index of 2.66 which is the same as that in the TeV -ray band (Aharonian et al., 2008). Consequently, we only obtained an upper limit for the non-thermal X-ray emission. The 90% upper limit flux in the 2–10 keV band is obtained to be ergs cm-2 s-1.
5 Discussion
5.1 The nature of the low temperature thermal component
We found the 0.3 keV thermal emission from the north-eastern shell of W28 and deteremined the plasma parameters. Table 2 summarizes the electron density (), the number of electrons (), the mass, and the thermal energy (), on the basis of the best-fit parameters summarized in table 1.
| Regions | [cm3] aafootnotemark: a | [cm-3] bbfootnotemark: b | [1011cm-3s] ccfootnotemark: c | [1056] | Mass [] | [1048erg] |
|---|---|---|---|---|---|---|
| 1 | 4.2 | 98 (4) | 0.54 | 0.044 | 0.090 | |
| 2 | 9.4 | 11 (6) | 1.3 | 0.11 | 0.18 | |
| 3 | 13 | 50 (9) | 2.1 | 0.17 | 0.27 | |
| Total | — | — | 3.9 | 0.32 | 0.54 | |
|
aafootnotemark: a
Volumes were calculated on the assumption
of an oval shape. See the text for
more detail.
bbfootnotemark: b Electron density were obtained by using E.M. and the volume. ccfootnotemark: c Ionization parameters () were found from the spectral fitting with a vnei model as explained in § 4. |
||||||
We assume that the distance to W28 is 1.9 kpc (Velázquez et al., 2002), and the plasma distributes uniformly along the line of sight. The shape of the emitting regions are assumed an oval with the line-of-sight extent being the same as the semi-minor axis appearing on the image (). The volumes are calculated to be equal to , where is the length of the semi-major axis on the image. With the aid of the emission measure () obtained from the spectral fitting and , we calculated , taking into account for fully ionized solar abundance plasma. The number of electrons (), the total mass and the thermal energy () were obtained under the assumption of energy equipartition between electrons and ions. The total thermal energy should be larger if other portions of the remnant are included, and if the proton temperature is significantly larger than the electron temperature as is expected for supernova remnants with large shock velocities (Ghavamian et al., 2007).
The temperature and the electron density of the north-eastern shell regions are plotted in figure 5. The value of is much higher in the north-eastern shell regions (10 cm-3) than in the inner region (1 cmRho & Borkowski (2002)). In particular, shell region 3, which apparently interacts with a molecular cloud (see figure 1 and 2), has the largest .
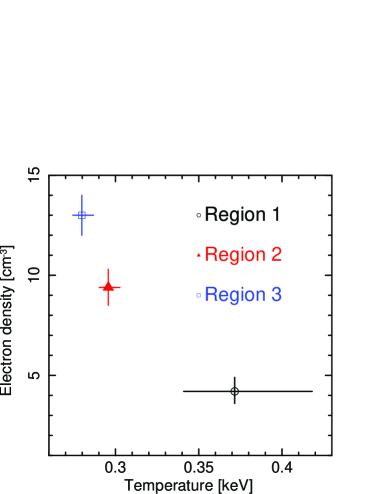
The higher temperature region has lower density. This is probably because the original ejecta energy is distributed among larger amount of interstellar matter for higher density regions, as indicated by the total mass in the table.
5.2 Origin of the TeV -ray emission
We obtained the upper limit of the X-ray flux from one of the TeV -ray emission peak, as described in § 4.4. Figure 6 shows the spectral energy distribution of the TeV -ray and the X-ray flux upper limit in the region.
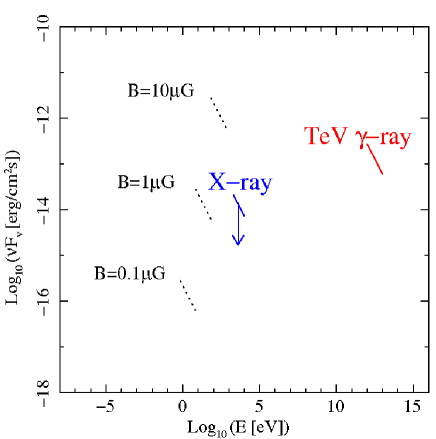
The red line is the TeV -ray power-law spectrum (Aharonian et al., 2008) with a photon index of 2.66, while the blue line is the upper limit of the X-ray power-law spectrum with a photon index assumed to be the same as that in the TeV band. The TeV flux is normalized to that of the X-ray flux by taking the difference in the integration region into account (the X-ray region is the ellipse while the TeV -ray one in Aharonian et al. (2008) is a circle with a radius of ). The corrected TeV -ray flux is 3.3 ergs cm-2 s-1 in the 1–10 TeV band.
The flux ratio between 1–10 TeV and 2–10 keV () is often used to examine the emission origin (Yamazaki et al., 2006). In young SNR and pulsar wind nebula (PWN) cases, the value is in the range of – (Matsumoto et al., 2007; Bamba et al., 2007), whereas the value is larger than 16 in our case. This result implies that the -ray emission mechanism is different between young SNRs/PWNe and our case of an old supernova remnant. Another sample is HESS J1745303, which has the of larger than 4 (Bamba et al., 2009). The nature of this source is still unknown, but there is a molecular cloud and an old SNR G359.10.5 (Bamba et al., 2000b; Ohnishi et al., 2011).
Such a high value of is similar to that of sources called ”dark particle accelerators” which are -ray sources without any X-ray counterparts (Matsumoto et al., 2007; Bamba et al., 2007). Although their nature is still unknown, one possibility can be old SNRs interacting with molecular clouds like W28 and HESS J1745303.
Here, we consider the emission origin more precisely using wide band spectrum. We first assume that the TeV -ray emission is powered through 1-zone Inverse Compton scattering (IC) of the cosmic microwave background off the accelerated primary electrons, and the same electrons emit synchrotron radiation in the X-ray band. The characteristic energies of a synchrotron photon and of an IC photon produced by the same electron are related as
| (1) | |||||
| (2) |
where is the magnetic field and is the flux (Aharonian et al., 1997). We draw synchrotron X-ray spectra with various magnetic field ( = 0.1, 1.0, and 10.0 G) in figure 6 with dashed lines. We only obtained the upper limit of the magnetic field of 5 G. This might be a little too weak for efficient particle acceleration region (Vink & Laming, 2003; Bamba et al., 2005, for example), although it is possible that electrons accelerated in the past escape from the acceleration region and emit IC photons in the observed position where the magnetic field is weak. However, the TeV -ray emission region well coincides with the distribution of the molecular cloud, as demonstrated in § 3 (figure 2). These facts suggest that the TeV -ray emission originates from the pion decay triggered by impacts of the high energy protons to the molecular clouds.
We then calculate a spectral energy distribution from X-ray to TeV -ray bands based on the pion decay. In this calculation, the TeV -ray originates from the process , where is produced through collisions between an accelerated proton and a proton in a molecular cloud. Accordingly, the resultant -ray spectrum depends on an energy distribution function of the accelerated protons
| (3) |
and the density of the molecular cloud, where the energy in this context means the total energy. Here we set the minimum energy as the proton rest mass (= ). It is well known that the resultant -ray energy is proportional to that of the bombarding proton (Drury et al., 1994), and hence we can simply adopt the number index be equal to the photon index of the observed TeV -ray spectrum (= 2.66). We assume the distance to W28 to be 1.9 kpc (Velázquez et al., 2002) to constrain the normalization . The density of the molecular cloud is measured from the CO observation (Arikawa et al., 1999), which is cm-3. With these parameters, we fitted the observed TeV -ray spectrum, and found that eV. The total energy of the accelerated protons is obtained to be erg, which is much smaller than the supernova explosion energy ( erg). We have assumed a continuous and a homogeneous distribution of cosmic rays in time and space, respectively, in the molecular cloud. The result is displayed in figure 7(a).


Note that non-thermal bremsstrahlung originating from secondary electrons produced through collisions between the accelerated protons and the molecular cloud neutrons contribute significantly to the resultant spectrum, although it dominates somewhat lower energy. Actually, Abdo et al. (2010c) discussed that the bremmsstrahlung-dominated emission model requires unrealistic low magnetic field. Given and the energy distribution of the secondary electrons, which can be calculated from that of the protons, and the absence of the synchrotron X-ray emission, we can set the upper limit on the magnetic field strength. By referring to the upper limit of the X-ray flux, we have obtained 800 G. We remark that this upper limit of the magnetic field was obtained by setting 1015 eV. In the case of 1015 eV, the model synchrotron spectrum is enhanced and extends to higher energy without being cutoff in the X-ray band. Consequently, a weaker magnetic field is required for the model synchrotron X-ray spectrum to be accommodated with the X-ray flux upper limit. The upper limit of 800 G is therefore the most conservative one in the case of =2.66. The 800 G case is shown in figure 7(a). The obtained parameters are summarized in table 3.
| Proton number index () | (a) 2.66 | (b) 2.0 |
|---|---|---|
| Maximum proton energy () [TeV] | 1000 | 40 |
| Total energy () [erg] | 3.0 1047 | 8.1 1045 |
| Magnetic field () [G] | 800 | 1500 |
| Photon flux in the 0.1–1 GeV [ph/cm2s] | 2.3 | 6.3 |
| in the 1–100 GeV [ph/cm2s] | 4.1 | 1.6 |
We note that, at the old SNR shocks with low shock velocity, the maximum energy of accelerated particles is smaller due to the escape of high-energy protons (e.g. Ohira et al. (2010)). We thus have tried to calculate the spectrum in the case that the number index of the proton is equal to the canonical value of the Fermi acceleration () in the lower-energy side. In this case, we adjust so that the resultant model spectrum can be fitted to the observed TeV -ray spectrum. The result of the maximum- case is shown in figure 7(b). The maximum proton energy is found to be TeV, and the total proton energy is erg, which is again much smaller than the supernova explosion energy. The upper limit of the magnetic field strength is 1500G.
6 Conclusion
We analyzed the XMM-Newton data of the north-eastern part of the supernova remnant W28. The observed X-ray image showed the bright and twisted north-eastern shell and the inner emission region which is part of the center-filled emission brightening toward the south-west end of the field of view.
The X-ray emission from north-eastern shell is found to reach collisional ionization equilibrium state and can be fitted well with a single temperature optically thin thermal emission model with of 0.3 keV. From the emission measure and the apparent volume, the electron density is found to be as high as 10 cm-3. Since a bunch of molecular cloud spatially coincides with the outer edge of a part of the shell, this high density is due to the collision of the plasma with the molecular cloud.
In contrast, there is no significant X-ray emission from one of the TeV -ray peaks. We only obtained the 90% upper limit flux of 2.1 10-14 erg cm-2 s-1 in the 2–10 keV band, assuming a power-law spectrum with the same photon index as in the TeV -ray (= 2.66). The spatial coincidence of the molecular cloud and the TeV -ray emission site suggests that TeV -ray is hadronic origin. We calculate the spectra of hadrons including pions, kaons, nucleons and so on produced through proton-proton scatterings and their daughter particles (gamma-rays, electrons, neutrinos and so on), and found that -decay emission is dominant in the TeV -ray band. A weak upper limit on the magnetic field strength is obtained 1500G from the X-ray flux upper limit.
Acknowledgements
We thank the anonymous referee for fruitful comments. This work was supported in part by Grant-in-Aid for Scientific Research of the Japanese Ministry of Education, Culture, Sports, Science and Technology, No. 22684012 (A. B.), No. 24840036 (M. S.), No. 21111006, 22244030, and 23540327 (K.K.). Two of authors (A. B. and R. Y) would like to express their deep appreciation for the Research Institute, Aoyama-Gakuin University, for supporting our research.
References
- Abdo et al. (2009a) Abdo, A. A., Ackermann, M., Ajello, M., et al. 2009a, ApJ, 706, L1
- Abdo et al. (2009b) Abdo, A. A., et al. 2009b, ApJS, 183, 46
- Abdo et al. (2010a) Abdo, A. A., Ackermann, M., Ajello, M., et al. 2010a, Science, 327, 1103
- Abdo et al. (2010b) Abdo, A. A., Ackermann, M., Ajello, M., et al. 2010b, ApJ, 712, 459
- Abdo et al. (2010c) Abdo, A. A., Ackermann, M., Ajello, M., et al. 2010c, ApJ, 718, 348
- Aharonian et al. (1997) Aharonian, F. A., Atoyan, A. M., & Kifune, T. 1997, MNRAS, 291, 162
- Aharonian et al. (2004) Aharonian, F. A., Akhperjanian, A. G., Aye, K.-M., et al. 2004, Nature, 432, 75
- Aharonian et al. (2006) Aharonian, F., Akhperjanian, A. G., Bazer-Bachi, A. R., et al. 2006, A&A, 448, L43
- Aharonian et al. (2008) Aharonian, F., et al. 2008, A&A, 481, 401
- Anders & Grevesse (1989) Anders, E., & Grevesse, N. 1989, Geochim. Cosmochim. Acta, 53, 197
- Arikawa et al. (1999) Arikawa, Y., Tatematsu, K., Sekimoto, Y., & Takahashi, T. 1999, PASJ, 51, L7
- Bamba et al. (2000a) Bamba, A., Koyama, K., & Tomida, H. 2000a, PASJ, 52, 1157
- Bamba et al. (2000b) Bamba, A., Yokogawa, J., Sakano, M., & Koyama, K. 2000b, PASJ, 52, 259
- Bamba et al. (2005) Bamba, A., Yamazaki, R., Yoshida, T., Terasawa, T., & Koyama, K. 2005, ApJ, 621, 793
- Bamba et al. (2007) Bamba, A., Koyama, K., Hiraga, J. S., et al. 2007, PASJ, 59, 209
- Bamba et al. (2009) Bamba, A., Yamazaki, R., Kohri, K., et al. 2009, ApJ, 691, 1854
- Borkowski et al. (1994) Borkowski, K. J., Sarazin, C. L., & Blondin, J. M. 1994, ApJ, 429, 710
- Borkowski et al. (2001a) Borkowski, K. J., Rho, J., Reynolds, S. P., & Dyer, K. K. 2001a, ApJ, 550, 334
- Borkowski et al. (2001b) Borkowski, K. J., Lyerly, W. J., & Reynolds, S. P. 2001b, ApJ, 548, 820
- Claussen et al. (1997) Claussen, M. J., Frail, D. A., Goss, W. M., & Gaume, R. A. 1997, ApJ, 489, 143
- Drury et al. (1994) Drury, L. O., Aharonian, F. A., & Voelk, H. J. 1994, A&A, 287, 959
- Ellison & Bykov (2011) Ellison, D. C., & Bykov, A. M. 2011, ApJ, 731, 87 Hunter, S. D., Kanbach, G., & Sreekumar, P. 1996, ApJ, 461, 820
- Frail et al. (1994) Frail, D. A., Goss, W. M., & Slysh, V. I. 1994, ApJ, 424, L111
- Ghavamian et al. (2007) Ghavamian, P., Laming, J. M., & Rakowski, C. E. 2007, ApJ, 654, L69
- Giuliani et al. (2010) Giuliani, A., Tavani, M., Bulgarelli, A., et al. 2010, A&A, 516, L11
- Hamilton et al. (1983) Hamilton, A. J. S., Chevalier, R. A., & Sarazin, C. L. 1983, ApJS, 51, 115
- Hoffman et al. (2005) Hoffman, I. M., Goss, W. M., Brogan, C. L., & Claussen, M. J. 2005, ApJ, 620, 257
- Koyama et al. (1995) Koyama, K., Petre, R., Gotthelf, E. V., Hwang, U., Matsuura, M., Ozaki, M., & Holt, S. S. 1995, Nature, 378, 255
- Koyama et al. (1997) Koyama, K., Kinugasa, K., Matsuzaki, K., Nishiuchi, M., Sugizaki, M., Torii, K., Yamauchi, S., & Aschenbach, B. 1997, PASJ, 49, L7
- Li & Chen (2012) Li, H., & Chen, Y. 2012, MNRAS, 421, 935
- Liedahl et al. (1995) Liedahl, D. A., Osterheld, A. L., & Goldstein, W. H. 1995, ApJ, 438, L115
- Matsumoto et al. (2007) Matsumoto, H., et al. 2007, PASJ, 59, 199
- Nava & Gabici (2013) Nava, L., & Gabici, S. 2013, MNRAS, 429, 1643
- Ohira et al. (2010) Ohira, Y., Murase, K., & Yamazaki, R. 2010, A&A, 513, A17
- Ohira et al. (2011) Ohira, Y., Murase, K., & Yamazaki, R. 2011, MNRAS, 410, 1577
- Ohnishi et al. (2011) Ohnishi, T., Koyama, K., Tsuru, T. G., et al. 2011, PASJ, 63, 527
- Rho & Borkowski (2002) Rho, J., & Borkowski, K. J. 2002, ApJ, 575, 201
- Sawada & Koyama (2012) Sawada, M., & Koyama, K. 2012, PASJ, 64, 81
- Telezhinsky et al. (2012) Telezhinsky, I., Dwarkadas, V. V., & Pohl, M. 2012, A&A, 541, A153
- Tsunemi et al. (2000) Tsunemi, H., Miyata, E., Aschenbach, B., Hiraga, J., & Akutsu, D. 2000, PASJ, 52, 887
- Velázquez et al. (2002) Velázquez, P. F., Dubner, G. M., Goss, W. M., & Green, A. J. 2002, AJ, 124, 2145
- Vink & Laming (2003) Vink, J., & Laming, J. M. 2003, ApJ, 584, 758
- Wootten (1981) Wootten, A. 1981, ApJ, 245, 105
- Yamazaki et al. (2006) Yamazaki, R., Kohri, K., Bamba, A., Yoshida, T., Tsuribe, T., & Takahara, F. 2006, MNRAS, 371, 1975