Nucleation and stabilization of carbon-rich structures in interstellar media
Abstract
We study conditions under which carbon clusters of different sizes form and stabilize. We describe an approach to equilibrium by simulating tenuous carbon gas dynamics to long times. First, we use reactive molecular dynamics simulations to describe the nucleation of long chains, large clusters, and complex cage structures in carbon and hydrogen rich interstellar gas phases. We study how temperature, particle density, presence of hydrogen, and carbon inflow affect the nucleation of molecular moieties with different characteristics, in accordance with astrophysical conditions. We extend the simulations to densities which are orders of magnitude lower than current laboratory densities, to temperatures relevant to circumstellar environments of planetary nebulae, and to longtime (microsecond) formation timescales. We correlate cluster size distributions from dynamical simulations with thermodynamic equilibrium intuitions, where at low temperatures and gas densities, entropy plays a significant role.
1 Introduction
Carbon-based chemistry of the interstellar medium (ISM) is now an established discipline. Presence of large variety of organic molecules such as aldehydes Marcelino et al. (2007), alcohols Friberg et al. (1988); Marcelino et al. (2007), ethers Garrod & Herbst (2006), amides Hollis et al. (2006), sugar Hollis et al. (2000), acids Garrod & Herbst (2006); Gibb et al. (2004), amino acids Botta & Bada (2002); Cronin & Chang (1993), and nitriles Belloche et al. (2008), as well as many long-chain hydrocarbon compounds in the dense interstellar medium have been confirmed by infrared, radio, millimeter, and submillimeter spectroscopic measurement Irvine et al. (1987); Ohishi & kaifu (1998); Winnewisser & Kramer (1999); Schutte (1996); Herbst & van Dishoeck (2009); Hollis et al. (2000). Detection of ring species, including aromatic rings, raises the possibility that biologically significant molecules may exist in the ISM. Between 10%-30% of the interstellar carbon budget is thought to reside in polycyclic aromatic hydrocarbons (PAHs) Tielens (2008).
The presence of complex molecules, with typical spectral properties, can be used to precisely probe the environments in which they reside and provide a fairly faithful history of ISM molecular clouds. IR emission lines (in the range of 3-14 m) have been assigned to C-C and C-H vibration bands of a broad class of polycyclic aromatic hydrocarbons (PAHs) Salama (2008); Ehrenfreund & Sephton (2006); Duley (2006); Salama et al. (1999); Ricks et al. (2009); Herbst & van Dishoeck (2009); Tielens (2008). The simplest PAH, naphthalene (C10H8) has been found in carbonaceous chondrites Spencer et al. (2008), suggesting extraterrestrial origin. Although no specific PAH molecule has yet been unambiguously identified in space, the infrared emission bands have been observed in nearly all astronomical objects, from highly ionized HII regions to ultraluminous infrared galaxies. Moreover, the simplest PAH, naphthalene (C10H8) has been already found in carbonaceous chondrites Spencer et al. (2008), suggesting its extraterrestrial origin.
The emission features at , , and m, present in the spectra of Tc1, NGC 7023 and NGC 2023 planetary and reflection nebulae, have been conclusively associated with the vibrational lines of regular carbon cages (C60 and C70) Cami et al. (2010); Sellgren et al. (2010). Moreover, a large class of unsolved mysteries in astronomy, such as diffuse interstellar bands (DIB) Allamandolla et al. (1985), extended red emission (ERE) Witt & Schild (1984), and the Å “bump” Bradley et al. (2005) trace their origins to large carbon and/or carbonaceous molecules. Single and multi-layer graphene have strong plasmon excitation bumps in the vicinity of the Å feature Eberlein et al. (2008). However, more work in needed to establish potential connection between these spectral features in astrophysical conditions. These challenges can not be solved without a strong theoretical input. Development of a comprehensive and detailed theoretical models for the origin and evolution of complex organic molecules such as PAHs, fullerenes, and other ordered carbon structures may be crucially important for understanding of the role that prebiotic molecules played on early Earth.
Most theoretical studies of formation of larger aromatic carbon chains, rings, and cages in ISM have been done close to equilibrium and at relatively high particle densities. Naphthalene (C10H8) was shown to be potentially formed in ISM via a barrierless reaction of phenyl radical (C6H5) and vinylacetylene (C4H4) Parker et al. (2012). It was proposed that C60 in ISM can form in a top-down manner in successive de-hydrogenation of PAHs into graphene Berné & Tielens (2012), and formation of defects (pentagons) necessary for the synthesis of C60. There are a number of issues associated with this hypothesis of C60 formation: 1) the circumstellar environment of Tc1 planetary nebula is distinctly hydrogen poor, 2) graphene is only synthesized in the laboratory and is not believed to exist in ISM, and 3) the proposed formation of carbon cages in ISM (via the 6 to 5 member rings) was observed in the laboratory only at far from equilibrium conditions.
To our knowledge, there are no available dynamical simulations of formation of molecules with aromatic rings at astrophysically-relevant conditions, which are not even properly known. Orderly growth of planar carbon structures (hexagon rings) from precursor C2 molecules necessitates low-temperature conditions, where vibrational distortions of the structures during their growth are minimized Irle et al. (2003). Under such conditions no significantly curved (cage-like) structures are supposed to form Irle et al. (2003). Fast inflow of carbon material is needed to form curved carbon clusters and fullerenes (pentagon rings, ring-stacks, ring fusion). In the laboratory, fullerenes are created with remarkable efficiency ( % in a condensing carbon arc) under less understood far from equilibrium conditions.
In this work, we describe an approach to equilibrium by simulating tenuous carbon (and hydrogen) gas dynamics to exceeding long times. Different carbon molecular clusters and moieties which form represent steady state local equilibria and are important yardsticks for understanding future time dynamics and equilibration in astrophysical time.
2 Simulations of cluster growth
We would like to understand the nucleation and stabilization of carbon chains, rings, and cages of different sizes and moieties in regimes relevant to astrophysics (cold temperatures and low densities), which are orders of magnitude more dilute than those considered under laboratory conditions Irle et al. (2003, 2006). However, performing such simulations in gaseous conditions, resembling an ISM, is a highly challenging task. Since the cluster formation times are long and the systems are large, we cannot reasonably investigate them by first principle molecular dynamics methods, unless we focus only on equilibrium structures; for example, fullerene forms by laser irradiation or arc-discharge methods within one ms to several seconds. By increasing the density of carbon atoms, we can effectively compress the nucleation time. However, this time compression enhances the growth and dissociation of the formed clusters due to collisions. Moreover, it dramatically alters the entropic contribution to the cluster Gibbs energy and thus influences the cluster form and stability.
Here, we use semiclassical reactive molecular dynamics (MD) simulations to model the formation of clusters starting from an elementary carbon (and hydrogen) gas. To proceed with the simulations, we need to know the reactive force fields, characterized by appropriate potential functions describing the change of atom hybridization over time. We use an approximate description of the chemical bonds, and propose analytical fit formulae for the structure formation times.
We apply the adaptive intermolecular reactive empirical bond-order (AIREBO) potential function proposed by Stuart Stuart et al. (2000), based on the Brenner bond-order potential Brenner (1990). This potential can be used for chemical reactions and intermolecular interactions in condensed-phase hydrocarbon systems such as liquids, graphite, and polymers. The potential function is given by
| (1) |
where and are repulsive and attractive pairwise potentials between atoms and , separated by , and is the bond-order term in a Tersoff-type potential Stuart et al. (2000). The dispersion and intermolecular interaction () are modeled with a Lennard-Jones (LJ) 12-6 potential having a switching function and a connectivity switch Stuart et al. (2000). The torsional potential () is proportional to bond weights that contribute to the dihedral angle Stuart et al. (2000).
We model the self-assembly of clusters from C and/or H atom gases using atomistic reactive MD simulations with the AIREBO potential Stuart et al. (2000) as implemented in the LAMMPS package Plimpton (1995). The systems are modeled in the NVT ensemble with periodic boundary conditions applied. The Langevin damping method Servantie & Gaspard (2003) with a damping coefficient of ps-1 is used to thermalize the systems; the time step is fs. Visualization and analysis of the trajectories are done by VMD Humphrey et al. (1996).
The simulations are progressively more computational expensive with increasing temperatures, as finer time steps are required (scaling is linear with temperature). For instance, it takes hours to simulate C atoms at K for a ns simulation time on a -core machine with 2.6 GHz AMD Opteron processors. For the same reason higher temperature ( K) systems are simulated for upto ns.
3 Results and discussion
Evidence from theoretical studies suggests that high temperatures are required to transform a flat structure to a curved moiety Lozovik & Popov (1997). We examine in our simulations the type of structures that are formed at different temperatures and gas densities.
3.1 Nucleation of carbon clusters at different temperatures and densities
First, we simulate the nucleation of carbon clusters at different temperatures ( K). We place atoms in a box of nm3, giving a carbon particle density of Å-3. In the MD simulations, the system energy is first minimized for a short time ( ps). In most implementations of MD algorithm, applicable to high density gases and biological complexes, the system is initially relaxed to a minimum energy, to avoid unnecessary coordinate overlaps or collisions. While in our simulations, due to low densities, this initial minimization is not necessary, we maintain it for a very short period. Then, the systems are heated to the target temperature and simulated for up to s.
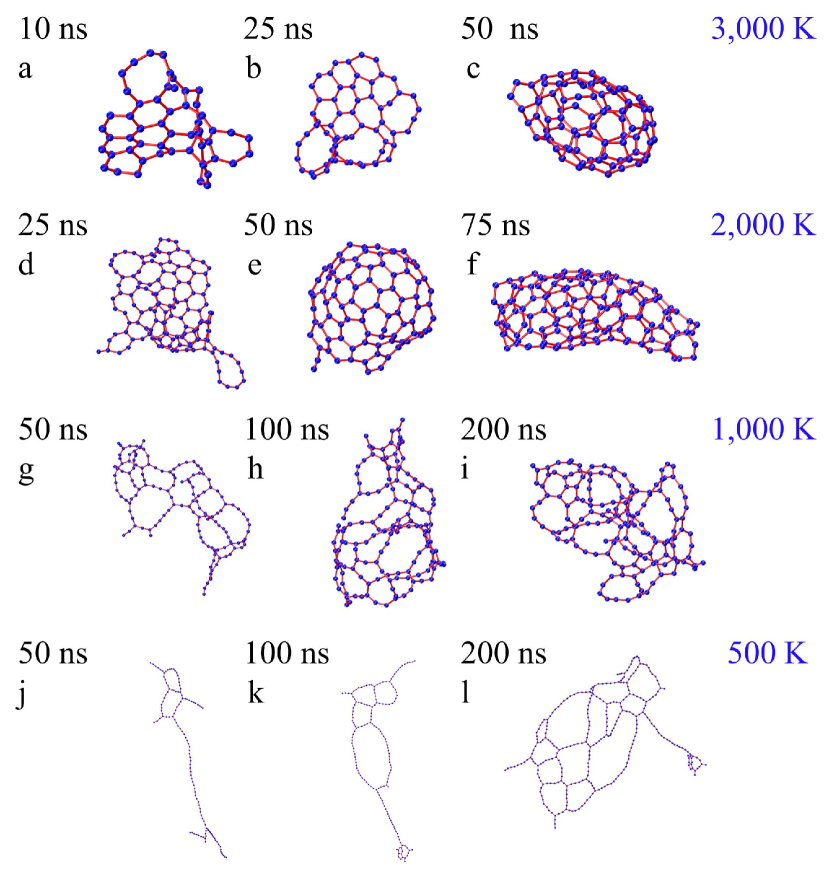
In Fig. 1, we present snapshots of the carbon moieties formed at different temperatures and times. At K, clusters appear at much earlier times as the diffusion and collision rates are faster. The high thermal energy also helps to induce curvature in the flat structures at much earlier times. As shown in Fig. 1(top panel), planar clusters (a) form within ns, and large planar clusters with five and six member rings emerge after ns (b), while fully formed fullerene structures () appear after ns (c). Even at early times, defects (pentagons) are present in the moieties heralding the process of curvature formation. After ns, nearly all structures are cages. Although in our simulations (small systems), all carbon atoms form curved structures, for a much bigger system at the same density and at high temperature, predominantly smaller carbon clusters along with few planar and curved moieties form when the system is in or close to equilibrium (see distribution of cluster sizes section).
At K, the temperature is still high enough to overcome the transition barriers (from flat structures to curved structures). Snapshots are given at , and ns (d-f) of Fig. 1. The existence of five-member rings at ns (d) is a prelude to cage-like structure formation. At ns (e), curvature is dramatic and a fullerene-like structure begins to form. At ns, cylindrical nano-structures emerge due to merger of fullerene-type clusters. Again, at K, the high thermal energy hinders the formation of large clusters and small clusters are more likely to be present in equilibrium (see distribution of cluster sizes section).
As we decrease the temperature, large clusters can be stabilized, as shown in Fig. 1(g-i). At K, even though defects are forming at short times, ns (g), the tendency is to form chain-like structures, while cage-like structure begin to appear after ns (h). At ns (i), curvature is clearly evident, while regularity of the type present at higher temperatures, is lacking.
Long chains can be stabilized at lower temperatures. Snapshots at , and ns (j-l) in the lower panel of Fig. 1, illustrate that chain formation is readily accomplished at K with instances of several irregularly formed rings. At K, cage like formation takes very long times, if at all. At ns (l), there’s evidence for curvature formation, but rings with odd-number of atoms are quite irregular in shape. For a much bigger system, carbon atoms can form several large clusters and then they can form a “liquid” phase at a lower temperatures (see distribution of cluster sizes section).
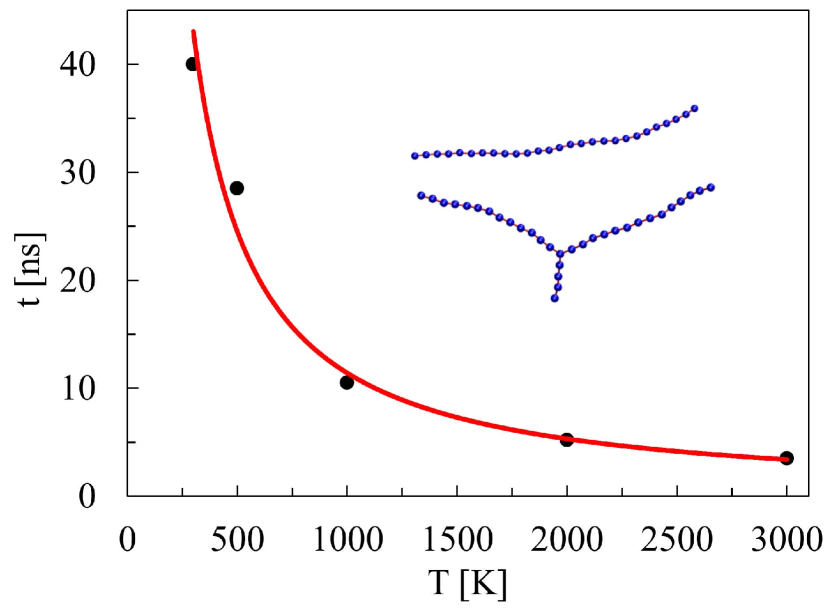
While formation of structure at much lower temperatures and densities is hampered by slow diffusion and collision rates, it is still possible to glean valuable information under these conditions by investigating the pattern at higher temperatures and densities. We calculated the time taken to form small linear or branched chain, with a carbon atom number, (), at different temperatures. As shown in Fig. 2, at K, small chains form after ns, whereas at K, it took ns to form. The formation time at , , K, are , , ns, respectively. The analytic dependence between the time (t) and the temperature (T) is (ns)= T-1.10(K).
Next, we measured the time of formation of small graphene flakes at different temperatures. We observed graphene flakes after ns at K, whereas at K, we noticed formation of graphene flakes after ns. We did not observed graphene flakes forming at K. This is likely due to the existence of a barrier below K. It is then possible to obtain a fit to the formation time vs. temperature. The analytical form is = T-1.31(K). This fit predicts that a graphene flake, assuming that the classical over the barrier can be penetrated, would form after at K.
Next, we study the effect of particle (carbon atom) density on the structure of carbon cages/clusters. In order to test the effect of particle density on the structure of carbon clusters, carbons atoms were placed in the gas phase in a cubic box with periodic boundary conditions, where the density of carbon atoms was changed ( – Å-3) by varying the box size at K. When the concentration is Å-3, we find only very short carbon chain molecules () after ns; no planar and fullerene type clusters are observed. However, when we increase the concentration of carbon atoms ( Å-3), short chain molecules emerge after ns. After ns, long chain molecules with few cage like clusters are observed. Fullerene type clusters are observed after . Interestingly, no graphene flakes formed at K. Graphene flakes formation are observed after ns and ns at K and K, respectively. No graphene flakes are observed at K and K after . It should be mentioned that while our lowest density only extends down to cm-3, still many orders of magnitude more dense than typical interstellar cloud densities of cm-3, our simulations and scaling dependencies point the way to arbitrarily low temperature and density conditions.
3.2 Conditions at chemical equilibrium
The Gibbs free energy of any system can be written as:
| (2) |
where and are its enthalpy and entropy, and are its internal energy and a canonical partition function, and is the Boltzmann constant, respectively. Using a molecular partition function, , can be written as
Here, is the number of particles, , , , and are the translational, rotational, vibrational and electronic partition function. Using the partition functions, one can calculate the free energy of a gas at a a particular temperature and volume. The competition between the entropy and enthalpy of the system determines the formation probability of a particular cluster as the system approaches chemical equilibrium.
Under equilibrium conditions, the free energy of one mole of molecules () is equal to the free energy of two moles of isolated carbon atoms (), . The symmetry number () for a diatomic molecule and the bond distance are 2 and Å, respectively. The bond energy () and the vibrational frequency () of are kJ/mol (29090 ) and cm-1, respectively.
The equilibrium constant for each mol of the reaction is defined as the ratio of partition functions, , where the partition functions , and is the Avogadro’s number Laidler et al. (2003). For the C-C bond energy of , and ideal gas conditions, one obtains a constant at one atm of pressure and K, and a volume of dissociation of m3 per molecule. The immediate implication is that at equilibrium, only high entropy structures, such as filaments and small clusters survive at low densities.
3.3 Size distributions of carbon clusters
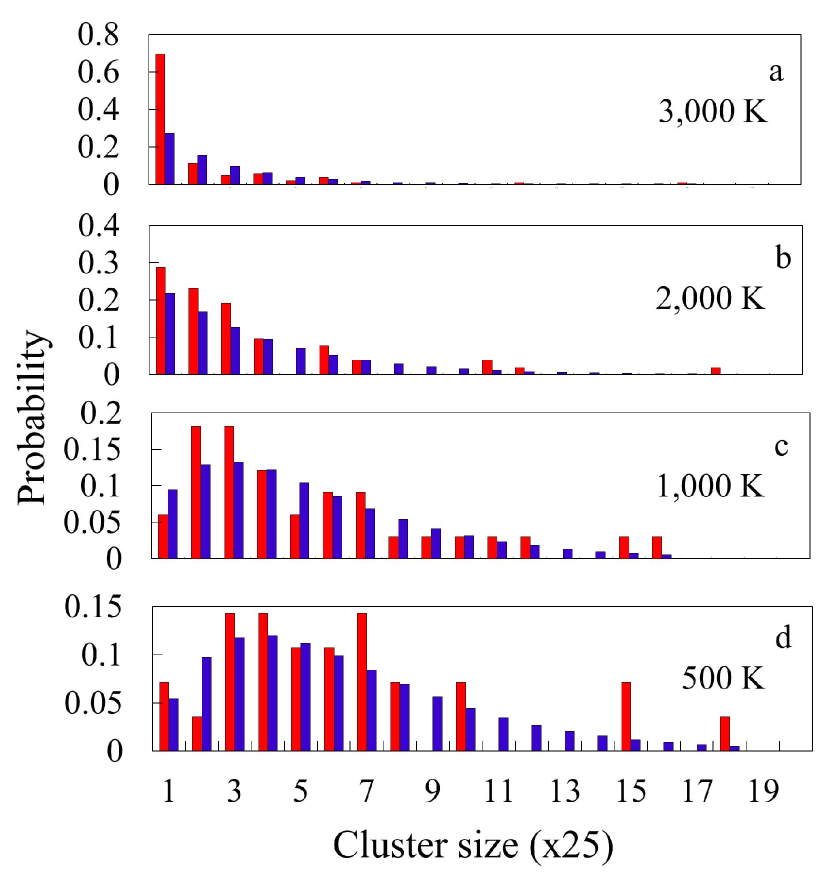
The carbon structures which form in simulations can have varying distributions according to atom size, moiety, ring size (pentagon, hexagon) and bond length, depending on the density and temperature of the gas. There can be large variations in different clusters which form. We have determined the probability distributions on structure size (C atom number) at different temperatures and densities. To this end, we simulated two systems with and carbon atoms (carbon density, Å-3 same for both systems) in gas phase at , , , and K. At K, the size distribution is obtained after ns. Similarly, for , , and K, the size distributions are obtained after , , and ns, respectively. For a particular system, the total number of formed clusters are divided into bins with each bin containing carbon atoms. Clusters, having less than five carbons atoms are ignored. The different statistical distributions are modeled with Gamma distribution functions GammaDistrbution (2013) and the parameters for each distribution are given in the figure caption. A Gamma distribution in a two-parameter family of continuous statistical distribution, related to Poisson distributed events which are correlated. The probability distribution function can be written as , with and as the shape and scale parameters, and the usual Gamma function.
Fig. 3(a), shows the probability distribution of carbon clusters at K ( C atoms and simulation time of ns). We find that carbon atoms formed mainly small clusters along with few curved and fullerene type clusters. At high temperatures, large clusters are destabilized by the high thermal energy. Here, the entropy dominates over enthalpy in the Gibbs free energy of the system. The high formation probability of the very small clusters () is confirmed by the probability distribution analysis in Fig. 3(a). At K, although carbon atoms form mainly small clusters (), small graphene flakes and few large curved clusters, with five- and six-member rings (bowl shape) are observed along with chains molecules (as shown in Fig. 3(b) with C atoms, sampled at ns of simulations). At K and K, the carbon atoms are still in gaseous phase (in which small clusters were mainly present) after and ns, respectively. It is also important to note that high temperatures are required to overcome the barrier to form curved structures to flat structures.
Next, we determine the probability distribution for C atoms, (Fig. 3(c) and C atoms (data not shown/see supporting information) at K, sampled at ns. In this case, we observe that the most probable carbon clusters consist of carbon atoms. As shown in Fig. 3(d) with atoms (for C atoms data not shown/see supporting information) at K sampled at ns, carbon clusters containing carbon atoms more likely form. For atoms at K, sampled at ns, the same probability distribution of carbon clusters is found. The maxima of the probability distribution also indicates the emergence of a “liquid phase” (in which relatively large clusters are present) at K after ns. For longer equilibration times, several small clusters can merge to big clusters at low temperatures.
At low temperatures, carbon atoms initially form short chains and then several chains coalesce to form long chain molecules. Large cluster type molecules with large member carbon rings emerge from several long chains. Eventually, these large clusters reorganize and form graphene type sheets or bent clusters. At high temperatures, initially, short chain molecules/fragments are formed from carbon atoms which then condense to form small clusters with relatively small member carbon rings. Eventually, these small clusters merge and form graphene or fullerene type molecules.
3.4 Hydrogenation process
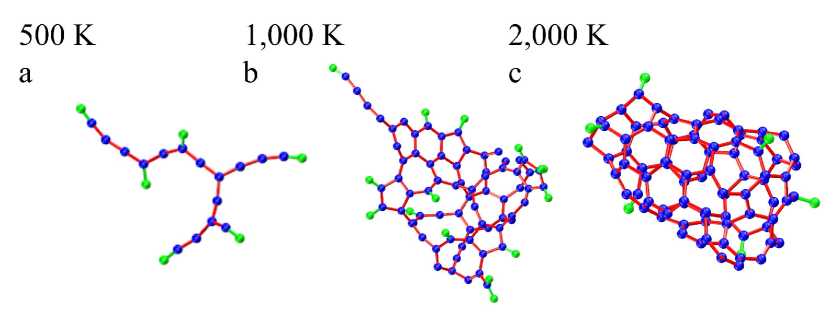
In order to investigate the influence of hydrogen atom addition on the structure of carbon cages/clusters, we simulate two systems where the ratio between carbon atoms and hydrogen atoms are and , respectively. We also investigate the effect of concentration on the self-assembled structures by varying the atomic concentration. This aspect of the study is not directly relevant to ISM conditions, as the C:H ratio in the ISM is about 10-4. The following simulations illustrate how the cluster growth terminates when hydrogen atoms are introduced. For each study, after a short minimization, we simulate the cluster formation at different temperatures. Here, we notice the formation of alkene and other unsaturated carbon-hydrogen chain molecules along with small carbon clusters and hydrogen molecules. We observe that hydrogen atoms terminate the growth of big carbon clusters. At low temperature K, small chains (terminated with hydrogen atoms) are predominantly found (Fig. 4(a)). Planar clusters (Fig. 4(b)), terminated by hydrogen atoms, are observed at K. Fullerene type clusters are observed at K (few hydrogen atoms are bonded on the surface), as shown in Fig. 4(c). We also observed vinyl type polymers (not shown), in addition to linear alkyne chains. At low temperatures, both the C-H and C-C bonds formation are favorable, but at high temperatures C-H bonds formation is less favorable compared to C-C bonds due to high thermal fluctuation. Therefore, small hydrogen terminated carbon chains are observed at low temperatures and graphene to fullerene type clusters were formed at high temperatures.
3.5 Carbon inflow: non-equilibrium nucleation
While in a chemical steady-state condition, significant curvature of graphitic sheets leading to spontaneous folding, may not occur at certain low temperatures, inflow of carbon material could facilitate approach to additional equilibria to curved carbon clusters and finally to fullerene formation. This situation is more resembling of astrophysical environments. The process of carbon in-flow in the ISM may not necessarily follow a Boltzmann distribution. We intend to understand how the carbon in-flow influences the formation process. To this end, we simulate with gaseous carbon atoms in a Å3 box (atom density, -5 Å-3) at K (all other conditions are the same as describe above). After equilibrating for ns, we save the coordinates of all atoms at the last frame and add another carbon atoms, keeping the box size fixed (total carbon atoms = ; atom density, -5 Å-3). After minimization, we simulate for another ns equilibrating at K and save the coordinates of all atoms of the last frame and repeat the process one more time (total carbon atoms = ; atom density, -5 Å-3).
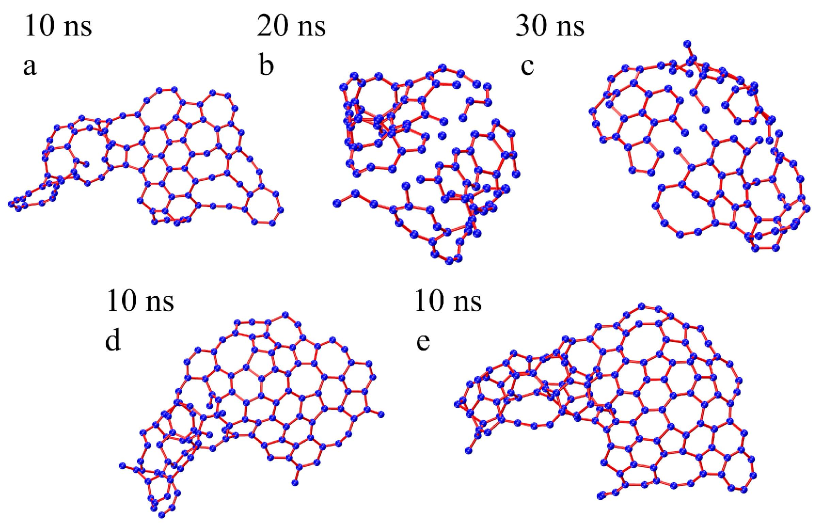
As shown in Fig. 5(a), we observe that planar cluster forms, with few six and five member rings, after ns. Within ns, formation of bend structure is observed with more six and five member rings (Fig. 5(b)) and after ns, curved structures are observed where almost all carbon atoms form six or five member rings (Fig. 5(c)). When we add carbon atoms to structure in Fig. 5(a) and simulate for another ns, we observe more planar structure compared to Fig. 5(b), as shown in Fig. 5(d). The added carbon atoms form bonds with edge carbon atoms of Fig. 5(a) and tend to create six member rings. When we add another carbon atoms to Fig. 5(d), we observe more planar structure (Fig. 5(e)) compared to Fig. 5(c), as the added carbon atoms again form bonds with edge carbon atoms of Fig. 5(d) and create more six member rings.
4 Conclusion
We study conditions under which large carbon structures form and stabilize in the gas phase in interstellar space by using reactive MD simulations. The formation mechanism of the large clusters and graphene type structures are investigated by a series of MD simulations. The influence of the temperature and particle density on the shape of structures are studied. It is found that at high temperature ( K), fullerene type clusters are obtained, whereas at relatively low temperatures, graphene type sheets along with long chain molecules/structures are synthesized. Analytical expressions for the small chain molecules formation can be used to predict the time scale to formation of nanostructures in interstellar medium. We determine the probability distributions of cluster sizes at different temperatures and initial C atom number and compare them with the gamma-distribution. The effect of hydrogen atom addition on the structure of carbon clusters is also studied. At high temperature, fullerene type clusters are found whereas short and branched chains molecules, terminated with hydrogen atoms, are observed at low temperature. At higher density of hydrogen atoms, we find that small unsaturated carbon chains are formed. When the concentration of hydrogen are relative low graphene type sheet (terminated by hydrogen atoms) and small cluster are observed. Finally, we simulate the self-assembly of carbon structures, in non-equilibrium conditions of periodic carbon inflow, resembling the astrophysical conditions.
These studies help in better understanding the tenuous gaseous conditions in the ISM for synthesis of large carbon structures. We find that the system entropy plays a significant role at extreme conditions of low temperature and low density in hindering synthesis and stabilization of large carbon structures. In future studies, we intend to investigate how dynamical quantum tunneling and stellar irradiation can lead to new pathways of formation of carbon clusters. UV irradiation and shock waves can ionize the gas and play significantly in molecular synthesis in the ISM. Quantum chemical calculations are necessary to address and understand the ionization process. When the quantum chemical calculations are limited by the system size, classical (semi-empirical) methods with improved force field can be used to understand the nucleation process.
References
- Allamandolla et al. (1985) Allamandolla, L. J., Tilenes, A. G. G. M.,& Barker, J. R. 1985, ApJ, 290, L25
- Belloche et al. (2008) Belloche, A., Menten, K. M., Comito, C., Muller, H. S. P., Schilke, P., et al. 2008. Astron. Astrophys. 482, 179
- Berné & Tielens (2012) Berné, O.,& Tielens, A. G. G. M. 2012, Proc. Nat. Acad. Sci., 109, 401
- Botta & Bada (2002) Botta, O., & Bada, J. L. 2002. Surv. Geophys. 23, 411
- Bradley et al. (2005) Bradley, J., Dai, Z. R. et al. 2005, Science, 307, 244
- Brenner (1990) Brenner, D. W. 1990, Phys. Rev. B, 42, 9458
- Cami et al. (2010) Cami, J., Bernard-Salas, J., Peeters, E.,& Malek, S. E. 2010, Science, 329, 1180
- Cronin & Chang (1993) Cronin, J. R., & Chang, S. 1993. In The Chemistry of Life’s Origins. NATO ASI Ser., ed. Greenberg, J. M., Mendoza-Gomez, C. X., Pirronello, V. 416, 209
- Duley (2006) Duley, W. W. 2006, Faraday Discuss., 133, 415
- Eberlein et al. (2008) Eberlein T. et al. 2008, Phys. Rev. B, 77, 233406
- Ehrenfreund & Sephton (2006) Ehrenfreund, P., & Sephton, M. A. 2006, Faraday Discuss., 133, 277
- Friberg et al. (1988) Friberg, P., Hjalmarson, A., Madden, S. C., & Irvine, W. M. 1988. Astron. Astrophys. 195, 281
- Garrod & Herbst (2006) Garrod, R. T., & Herbst, E. 2006. Astron. Astrophys. 457, 927
- Gibb et al. (2004) Gibb, E. L., Whittet, D. C. B., Boogert, A. C. A., & Tielens, A. G. G. M. 2004. Ap. J. Suppl. 151, 35
- Herbst & van Dishoeck (2009) Herbst, E., & van Dishoeck, E. F. 2009, Ann. Rev. Astro. Astrophys., 47, 427
- Hollis et al. (2000) Hollis, J. M., Lovas, F. J., & Jewell, P. R. 2000, Astrophys. J., 540, L107
- Hollis et al. (2006) Hollis, J. M., Lovas, F. J., Remijan, A. J., Jewell, P. R., Ilyushin, V. V., & Kleiner, I. 2006. Ap. J. Lett. 643, L25
- Humphrey et al. (1996) Humphrey, W., Dalke, A. & Schulten, K. 1996, J. Mol. Graph., 14, 33
- Irle et al. (2003) Irle, S., Zheng, G., Elstner, M., & Morokuma, K. 2003, Nano Lett., 3, 1657
- Irle et al. (2006) Irle, S., Zheng, G., Wang, Z., & Morokuma, K. 2006, J. Phys. Chem. B, 110, 14531
- Irvine et al. (1987) Irvine, W. M., Goldsmith, P. F., & Hjalmarson, A. A. 1987. In Interstellar Processes, ed. Hollenbach, D. J., Thronson, H. A. 561
- Laidler et al. (2003) Liader K. J., Meiser J. H., & Sanctuary B. C., 2003, ”Physical Chemistry, 4th Ed. Houghton Mifflin.
- Lozovik & Popov (1997) Lozovik, Y. E., & Popov, A. M. 1997, Phys.-Usp., 40, 717
- Marcelino et al. (2007) Marcelino, N., Cernicharo, J., Agundez, M., Roueff, E., Gerin, M., et al. 2007. Ap. J. Lett. 665, L127
- Ohishi & kaifu (1998) Ohishi, M., & Kaifu, N. 1998. Faraday Discuss., 109, 205
- Parker et al. (2012) Parker, D. S. N. et al 2012, Proc. Nat. Acad. Sci., 109, 53
- Plimpton (1995) Plimpton, S. J. 1995, J. Comp. Phys., 117, 1
- Ricks et al. (2009) Ricks, A. M., Douberly, G. E., & Duncan, M. A. 2009, ApJ, 702, 301
- Salama (2008) Salama F. 2008, Org. Mat. in Sp., Proc. IAU Symp., Ed. Kwok S. and Sanford S., 251, 357
- Salama et al. (1999) Salama, F., Galazutdinov, G. A., Krelowski, J., Allamandola, L. J., & Musaev, F. A. 1999, Astrophys. J., 526, 265
- Schutte (1996) Schutte, W .A. 1996. In The Cosmic Dust Connection, ed. Greenberg, J. M., 1.
- Sellgren et al. (2010) Sellgren, K. et al. 2010, Ap. J. Lett., 722, L54.
- Servantie & Gaspard (2003) Servantie, J.,& Gaspard, P. 2003, Phys. Rev. Lett., 91, 185503
- Spencer et al. (2008) Spencer, M. K., Hammond, M. R.,& Zare, R. N. 2008, Proc. Natl. Acad. Sci., 105, 18096
- Stuart et al. (2000) Stuart, S. J., Tutein, A. B., & Harrison, J. A. 2000, J. Chem. Phys., 112, 6472
- Tielens (2008) Tielens, A. G. G. M. 2008, Annu. Rev. Astron. Astrophy., 46, 289
- Winnewisser & Kramer (1999) Winnewisser, G., & Kramer, C. 1999. Space Science Reviews, 90, 181
- Witt & Schild (1984) Witt, A. N., Schild, R. E., & Kraiman, J. B. 1984, ApJ, 281, 708
- GammaDistrbution (2013) www.mathworld.wolfram.com/GammaDistribution.html