Hyperfine Interactions in MnAs studied by Perturbed Angular Correlations of -Rays using the probe 77BrSe and first principles calculations for MnAs and other Mn pnictides
Abstract
The MnAs compound shows a first-order transition at T C, and a second-order transition at T C. The first-order transition, with structural (hexagonal-orthorhombic), magnetic (FM-PM) and electrical conductivity changes, is associated to magnetocaloric, magnetoelastic, and magnetoresistance effects. We report a study in a large temperature range from up to C, using the perturbed angular correlations method with the radioactive probe 77BrSe, produced at the ISOLDE-CERN facility. The electric field gradients and magnetic hyperfine fields are determined across the first- and second-order phase transitions encompassing the pure and mixed phase regimes in cooling and heating cycles. The temperature irreversibility of the 1st order phase transition is seen locally, at the nanoscopic scale sensitivity of the hyperfine field, by its hysteresis, detailing and complementing information obtained with macroscopic measurements (magnetization and X-ray powder diffraction). To interpret the results, hyperfine parameters were obtained with first-principles spin-polarized density functional calculations using the generalized gradient approximation with the full potential (L)APW+lo method (Wien2k code) by considering the Se probe at both Mn and As sites. A clear assignment of the probe location at the As site is made and complemented with the calculated densities of states and local magnetic moments. We model electronic and magnetic properties of the chemically similar MnSb and MnBi compounds, complementing previous calculations.
pacs:
31.30.Gs,71.15.Mb,75.50.Cc, 76.80.+yI Introduction
The magnetic compound MnAs has been intensively studied, since it exhibits a magnetocaloric effect Wada and Tanabe (2001), under hydrostatic pressure Gama et al. (2004), as well as when doped with metals Wada and Tanabe (2001); de Campos et al. (2006), making it an interesting material for magnetic refrigeration applications. Moreover, it can be grown as epitaxial films on Si and GaAs substrates Daweritz (2006), where applications such as a source for spin injection make it of promising use for spintronics Ramsteiner et al. (2002).
In parallel, it is a material with theoretical challenges. In this front some first-principles studies are directed to this compound, e. g. see refs. Sandratskii and Sasioglu (2006); Rungger and Sanvito (2006); Niranjan et al. (2004); Ravindran et al. (1999); Łażewski et al. (2010). The orthorhombic phase is usually considered paramagnetic, however it does not follow a Curie-Weiss law and it has also been considered to be antiferromagnetic Niranjan et al. (2004). Also of interest is the existing magnetoresistance effect which is attempted to be related to the CMR found in the perovskite manganites Mira et al. (2003), and a remarkable spin-phonon coupling found crucial to the magnetostructural transition Łażewski et al. (2010). Its particular coupling of magnetism and structure has been the origin of macroscopic models Bean and Rodbell (1962) for magneto-volume effects.
At low temperatures, MnAs is ferromagnetic and it has a NiAs-type structure. This structure, with space group (194), has Mn and As atoms at coordinates (,,) and (, , ), respectively, with two formula units per unit cell. On heating, at about C, it undergoes a first-order phase transition, with a discontinuous distortion to the orthorhombic MnP-type structure, with a parallel discontinuous change of volume, loss of ferromagnetism, and a metal-insulator transition. The orthorhombic distortion continuously disappears when heating until about C where it undergoes a second-order phase transition to the NiAs-type structure with a paramagnetic state, now following a Curie-Weiss law.
Thermal hysteresis is measured in this transition: on heating, the hexagonalorthorhombic phase transformation occurs at temperatures T C, while on cooling this transformation occurs at T C Goodenough and Kafalas (1967); Nascimento et al. (2006); Wilson and Kasper (1964); Ishikawa et al. (2003, 2004) (variations in different studies are probably resulting from small differences in the stoichiometry of samples). Phase coexistence in a temperature interval of approximately C is reported by neutron and X-ray diffraction measurements Mira et al. (2003); Gama et al. (2009). The orthorhombic structure, with the space group (62), has coordinates for Mn and As atoms of (, , ) and (, , ), respectively Wilson and Kasper (1964).
The lattice constants of the hexagonal phase at room temperature are , Å, and changes to , and Å in the orthorhombic phase (with four f. u. per unit cell) at the first-order transition correspond to a volume loss of 2%.
We report a study in this compound using time differential Perturbed Angular Correlation (PAC) spectroscopy (see e. g. Schatz and Weidinger (1996) for details), to our knowledge the first use of this nuclear technique in the compound. Since PAC measures the combined hyperfine interactions - magnetic hyperfine field (MHF), and electric field gradient (EFG), the sensitivity of its atomic-scale measurements allows the study of the atomic environments as a function of temperature.
Other hyperfine interactions techniques have been used for the study of MnAs and related compounds in previous studies. Using Mössbauer spectroscopy with the 57Fe probe at 0.25 at% concentration, Kirchschlager et al. Kirchschlager et al. (1981) detect a quadrupole splitting, which they interpret on the basis of motion of the probe atoms, but they do not measure magnetic hyperfine field. Also using 57Fe impurities as probes, in the related MnAs1-xFex compound Abdelgadir et al. (1988), with , , and , Abdelgadir et al. reported measurements involving the first-order transition at C (for ), where they also detect an unusual dependence of the magnetic hyperfine field. NMR spectroscopy has also been performed at 4K Amako , and in the range from up to C, with double signals from both Mn and As atoms, where a resonance anomaly was observed at 0 C as due from atoms at the domain walls Pinjare and Rama Rao (1982).
Our work studies a temperature range from to C and liquid nitrogen temperature ( C). Measurements are made in the first-order phase-transition region and above, passing the second-order phase transition (section II.3). The temperature range near the first-order transition is studied in more detail (section II.4). X-Raw powder diffraction and magnetization measurements are also performed and its results are compared with PAC results.
The experimental results are complemented with density functional theory calculations of the hyperfine parameters, using the full potential mixed (linear) augmented plane wave plus local orbitals (L)APW+lo method. In order to improve and complement other first-principles studies, we also show calculations of other properties, and for the chemically similar manganese pnictides MnSb and MnBi.
II Experiments
II.1 Hyperfine Parameters
The two quantities of interest to the physics of MnAs that can be obtained from the PAC measurements are the electric field gradient (EFG) and the magnetic hyperfine field (Bhf). The EFG is measured from the hyperfine interaction between a charge distribution with non-spherical symmetry and the nuclear quadrupole moment Q. The measurement of the quadrupole interaction gives the EFG, depending on the accurate knowledge of the probe’s quadrupolar moment. The EFG is defined as the symmetric traceless tensor with components taken from the second spatial derivatives of the Coulomb potential at the nuclear position. In the principal axis frame of reference, the components of interest are Vzz and the axial symmetry parameter , with and . The observable frequency with PAC depends on the quadrupole nuclear moment and electric field gradient in the following way:
| (1) |
where is the nuclear spin and for half-integer spin. is called the “reduced frequency” of the interaction and is independent of and .
The magnetic hyperfine field, arising from the dipole-dipole interaction between the nuclear magnetic moment and the magnetic moment of the extranuclear electrons, can be expressed by
| (2) |
where is the nuclear magneton, the g-factor and the observable Larmor frequency. For interpretation of the physical origin behind , it is usual to decompose it in four terms:
| (3) |
where is the Fermi contact interaction, of the electronic spin density at the nucleus with the nuclear magnetic moment, and are the contributions of the magnetic interaction due to the electronic orbital momentum and electronic spin momentum, respectively, and is a contribution from the other atomic orbitals in the lattice, usually negligible.
The intrinsic inhomogeneities and remaining distributions of point defects lead to the damping of the experimental PAC spectrum, which is simulated by a Lorentzian function characterized by the (width) parameter.
II.2 Experimental details and sample preparation
A mixture of radioactive isobars of mass , 77Kr, 77Br and 77Se were produced at the ISOLDE isotope separator online facility at CERN, and implanted at 30 keV to a dose of approximately atoms/m2 in MnAs samples at room temperature. After waiting for the decay of 77Kr ( min.) for h, the PAC experiments have started on the decay of 77Br to 77Se, after annealing, as described.
One test sample was measured as implanted, but the resulting spectrum was highly attenuated due to implantation defects. Subsequently, a first annealing step at C for s was done in vacuum ( mbar), followed by a fast quench to room temperature for both samples, after which the spectra substantially improved.
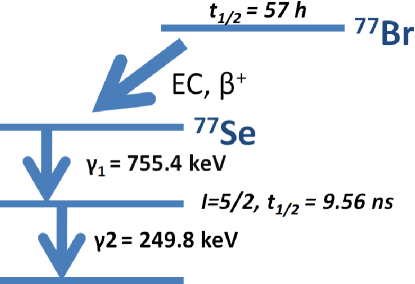
The cascade of 77BrSe is shown in figure 1. The hyperfine interaction is measured in the ns, keV, intermediate state of the cascade, with quadrupole moment , and magnetic moment Stone (2005).
The directional correlation of the decays is perturbed by the hyperfine interactions and the experimental anisotropy ratio function , which contains all of the relevant information, is expressed as a function of time, . , where are the anisotropy coefficients, depending on the spin and multipolarity of the decays, and contains the information of the hyperfine parameters. Due to the solid angle attenuation of the detection system the anisotropy is reduced, and the effective experimental anisotropy was found to be A. The long half-life of the parent isotope 77Br, h, and the relatively short half-life of the intermediate state, allowed us to perform several measurements with a very good true to chance coincidence ratio from a single implantation shot.
The PAC-spectrometer, a high efficiency setup of six BaF2 detectors, provides coincidence spectra ( from and from between detectors Butz et al. (1989)).
II.3 1st set of PAC experiments
The obtained PAC experimental functions and the respective Fourier analysis are shown in figures 2 and 3.
The spectra were fitted using a numerical algorithm that calculates the hamiltonian of the interaction to obtain the magnetic and quadrupole EFG parameters Barradas et al. (1993). Figs. 2 and 3 also show the Fourier analysis of the functions for all temperatures measured.
Table 1 shows all fit parameters obtained at the different temperatures, in the chronological order of measurements. Between the last two measurements, the sample was heated to 100 C, so the 35 C measurement is made on cooling.
The fit procedure can consider several fractions of 77Se nuclei interacting with different hyperfine fields due to different local environments. For the ferromagnetic case the fits mainly reveal nuclei interacting with a magnetic field. Additionally for all phases, a fraction must be considered of 77Se nuclei interacting with a strong (EFG3) distribution, that we attribute to nuclei on defect regions of MnAs which could not be annealed. This fraction was firstly allowed to vary, but the quality of the fit is not very sensitive to its value. In the final fits we constrained this value to the average of all previously found values, .
Upon the transition the magnetic interaction vanishes and a slow frequency, due to the orthorhombic phase EFG is revealed. The limited time window and low quadrupole moment makes it difficult to measure the EFG2 parameters of the orthorhombic phase with high precision. Even in the most accurate measurements it can be fitted reasonably in a large range. On the other hand, the stronger EFG3 of f has a large damping which also makes its accurate determination difficult. Therefore, in the present experiments, the asymmetry parameters , were set to zero, since large variations produce small changes in the results. On the other hand, this procedure agrees with the fact that the hexagonal and weakly distorted orthorhombic symmetries produce very small axial asymmetry parameters. The frequency was also fixed in an average value.
The magnetic phase, characterized by a well defined magnetic hyperfine field, could be characterized also by a very small EFG. The fit program properly handles this problem by resolving the Hamiltonian for the combined interaction. In the results we present only a pure magnetic interaction, since with a combined interaction the EFG (Vzz) would have to be very small in this phase and cannot be properly disentangled within the short analysis time of ns. We estimate a majorant for m2, above which the quality of the fit would significantly degrade.
The obtained Vzz attributed to the orthorhombic phase is less than m2 at all temperatures measured.
The frequencies and Lorentzian widths are similar for the whole temperature range in this phase. However, we point that before the experiment performed at 141 C during six hours, EFG2 shows a relevant attenuation of Mrads-1. After this measurement the attenuation was considerably reduced and the characteristic EFG3 parameters attributed to Se interacting with defects of MnAs have considerably changed. Both modifications compare well with what is observed in the second set of PAC experiments immediately after the 600 C annealing step. We think this is evidence for an incomplete annealing that was compensated during the lenghty six hours measurement at 141 C.
The EFG parameters measured at 141 C, above the second-order phase transition, shows a very low Vzz as expected from the NiAs-type structure, and there is no hyperfine field since the sample should be paramagnetic, following a Curie-Weiss law at this temperature.
The measurement at 35 C shows a lower amplitude of the R(t) function due to the coexistence of hexagonal and orthorhombic phases. Still, there is a stronger attenuation of the magnetic field that can correlate with the dynamics of the phase coexistence.
The first-order transition reported in the literature when heating is clearly seen in the PAC spectra at approximately C with the disappearing magnetic hyperfine field when measuring at C.
II.4 2nd set of PAC experiments - First-Order Transition
A detailed study of the first-order transition has been done according the following order, on a second sample: 21.1, 40.8, 41.3, 42.3, 43.5, 124.5 (raising temperature); 41.4, 39.5, 37.5, 36.6, 33.3, 32.5, 29.9, 13.3, -196 C (lowering temperature).
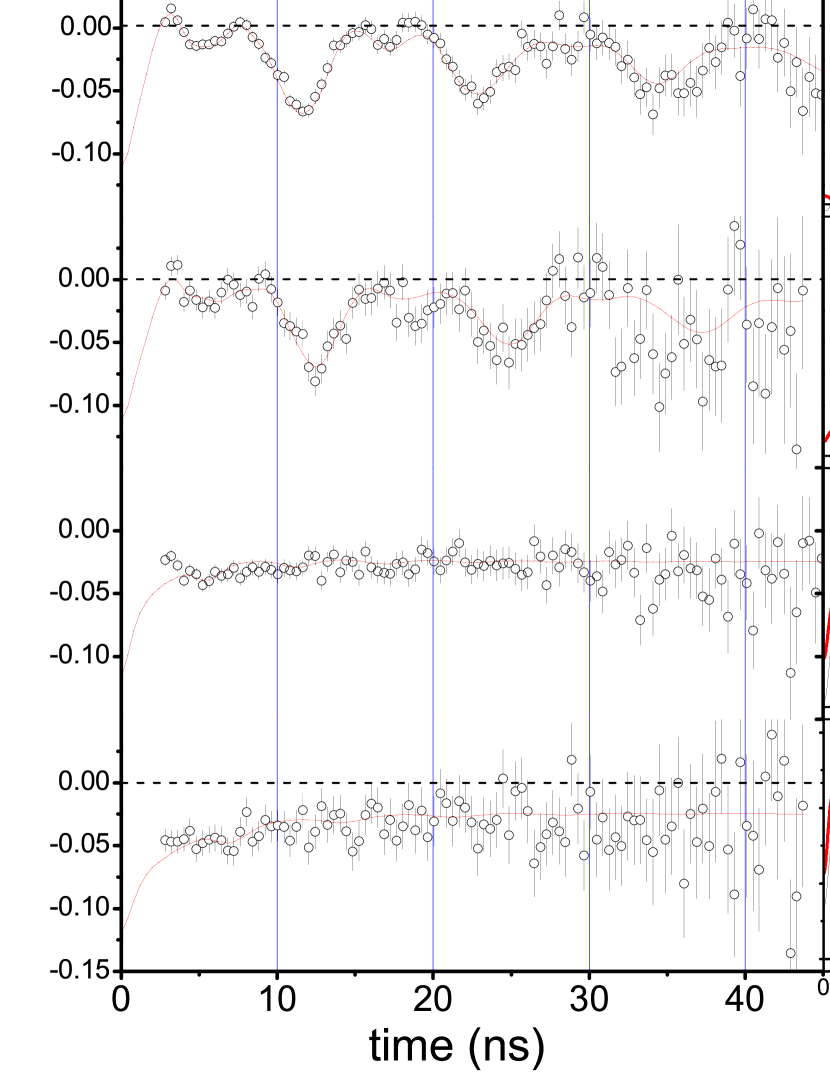
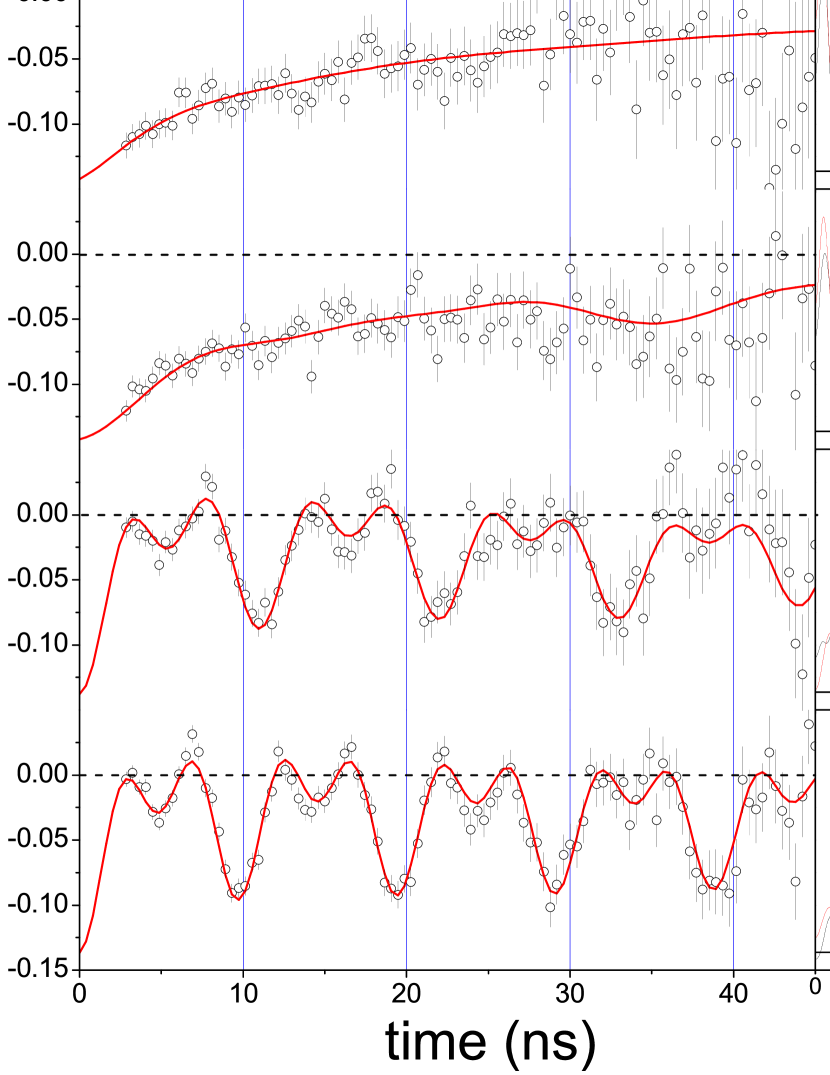
The first five PAC measurements, done when heating the sample, from room temperature, to above the first-order transition, are shown in figure 4.
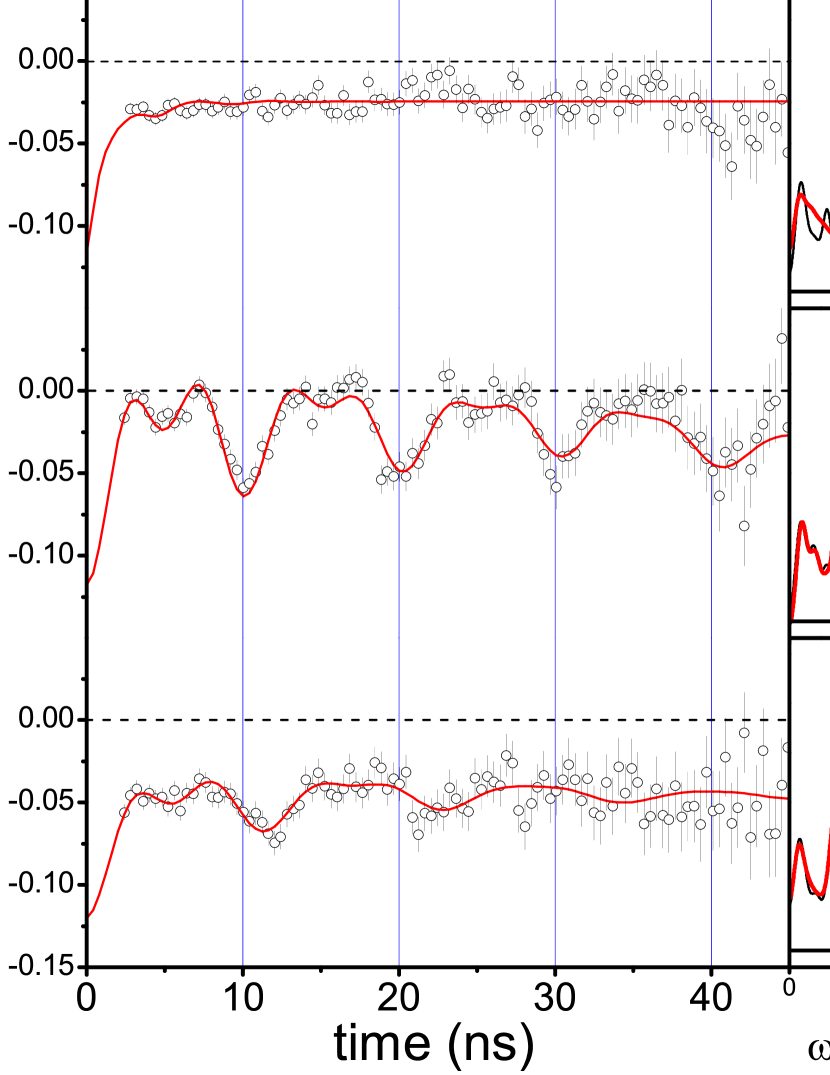
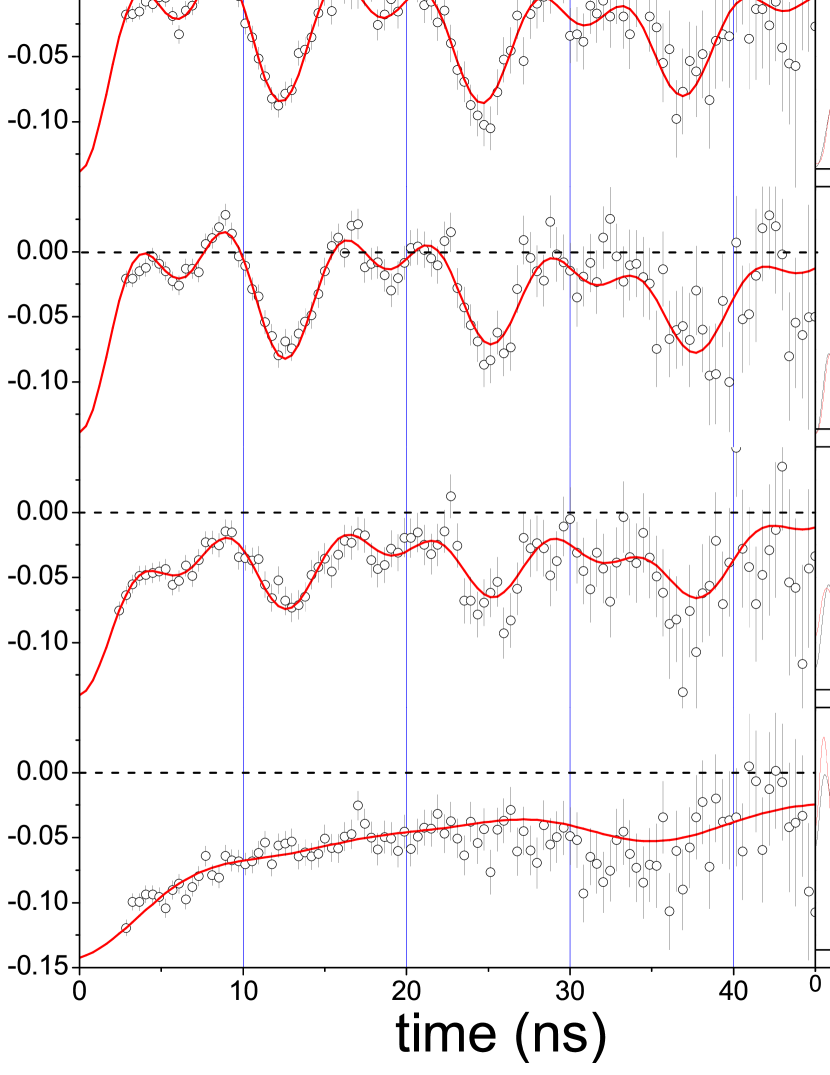
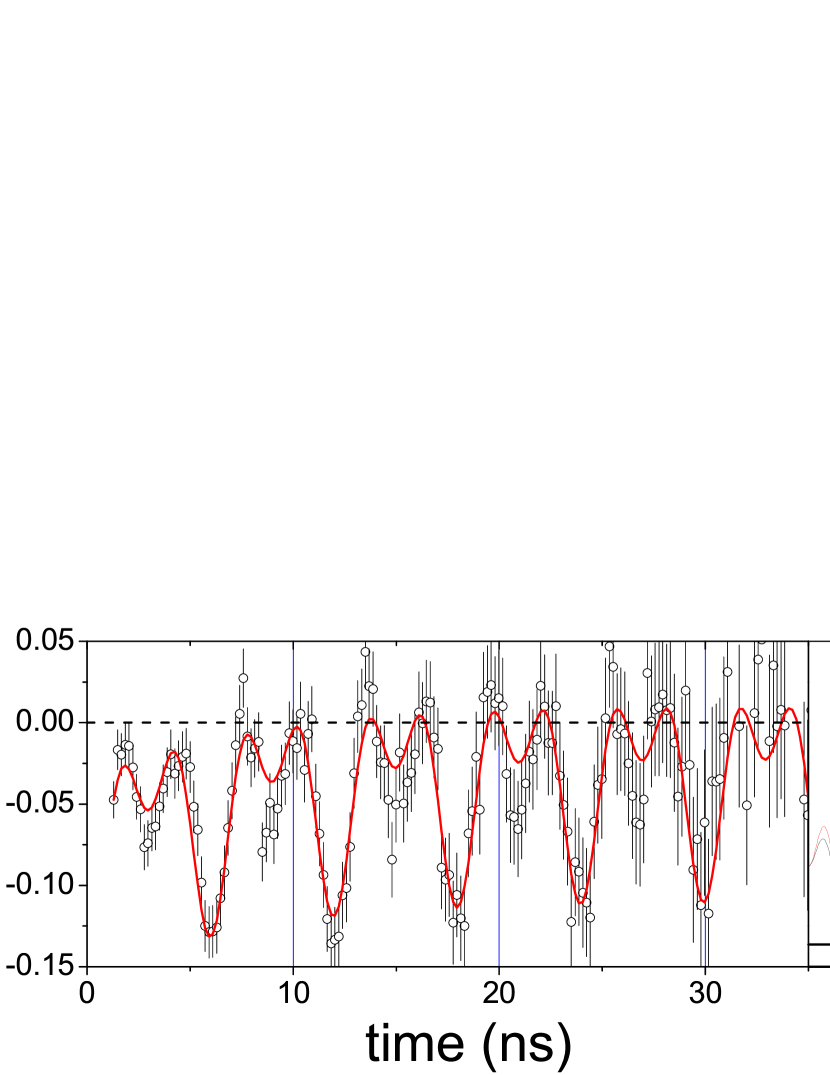
The five measurements, done when cooling the sample, from 36.6 to 13.3 C, also passing the transition, are shown in figure 5.
The measurements done when cooling the sample above the phase transition (41.1, 39.5, 37.5, 36.5 C), coming from a high temperature (124.5 C), are not included, since those spectra are similar to the first spectrum in figure 5, at 36.6 C.
A last measurement performed with the sample at liquid nitrogen temperature is shown in figure 6.
In a similar way to the preceding section, the fits were done considering a magnetic hyperfine field and low EFG, which are characteristic of each phase. For the reasons already detailed the asymmetry parameter is set to zero for all EFGs, and the fraction attributed to defect and orthorhombic frequencies are fixed in average values. Also, an additional EFG characterized by a quadrupole interaction of Mrad.s-1, V V/m2, is found that accounts for 30% of the probe nuclei in perturbed environments of the sample, still remaining after annealing.
The values of all fitted parameters can be found in table 2.
As can be seen by the changes in the spectra, the transformations occur near and C. Therefore we estimate the thermal irreversibility to be between 10-13.5 C. This hysteresis is somewhat larger than that reported in other works by X-ray and magnetization measurements (10 C) Goodenough and Kafalas (1967); Nascimento et al. (2006); Wilson and Kasper (1964); Ishikawa et al. (2003, 2004).
Figure 7 shows magnetization measurements on the same samples with a vibrating sample magnetometer with T, showing T C and T C. The abrupt change over 2 C, at C, when heating (see fig. 7), is in agreement with the hyperfine field changes measured above C.
As in the first set of PAC measurements, there is a hyperfine field of 24 T just before the transition. Then the magnetic phase disappears in a small temperature interval, as shown in the spectra of figure 4 at and C. This shows no continuous decrease of the hyperfine field to zero before the transition. Note that this conclusion cannot be learned from macroscopic magnetization measurements only (see figure 7), where the magnetization can be seen to decrease to zero, since just before the ferromagnetic to paramagnetic phase transition and within the temperature difference of 1 C, only a very small variation of the hyperfine field is observed. This clearly shows that the magnetization changes are mainly the result of changes in phase fractions, instead of thermal disorder.
Figure 8 shows the hyperfine fields obtained, where the agreement for both experiments can clearly be seen.
Notice that the attenuation of the hyperfine fields in the ferromagnetic phase increases towards the phase transition temperature. When cooling from high temperature the same behavior is observed and at liquid nitrogen temperature (- 196 C), no attenuation is observed. These observations hint at dynamic processes due to spin fluctuations.
At C the amplitude of the magnetic part of the R(t) functions is smaller than at lower temperatures, showing a reduced fraction of the ferromagnetic phase still present. A fraction of 60% for the 77Se atoms at the ferromagnetic phase while other 10% show a small quadrupole frequency. This third fraction has V ( was fixed to zero), corresponding to the value found for the other fits in the orthorhombic phase. We can say that the phase coexistence only occurs in a width of 2.2 C or less, since the measurement below and at ( C) and above and at ( C) show only the ferromagnetic and paramagnetic phases, respectively. This width is in agreement with previous measurements of approximately C Mira et al. (2003); Gama et al. (2009).
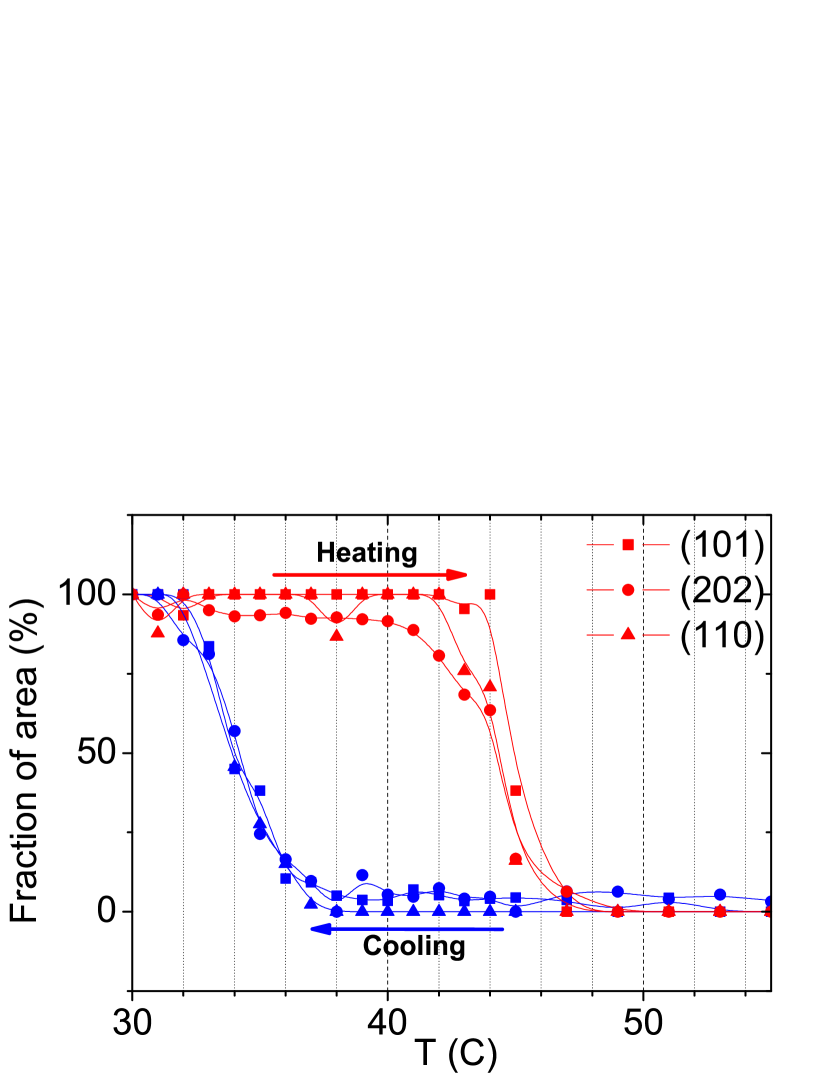
The 1st order structure transformation was also probed with temperature dependent X-ray powder diffraction studies in a Philips diffractometer. We performed detailed measurements as a function of temperature, in three selected diffraction angle regions, were changes in the transition are easily seen. Three intervals were selected, 31.4-32.6, 41.8-43.1, and 48.6-50 degrees, where one peak characteristic of the hexagonal phase disappears in the transition with the appearence of peaks characteristic of the orthorhombic phase. In the 31.4-32.6 interval the (101) peak disappears with the appeareance of (102) and (111) peaks almost at the same angle. The same situations occur when the (102) peak disappears and (202), (211) peaks appears in the orthorhombic phase for 41.8-43.1 degrees. For 48.6-50 degrees, the (110) hexagonal peak transforms into (013), (020), (212) and (301) peaks in the orthorhombic phase. The fit of the peaks was done simply with gaussian functions, one gaussian for the hexagonal peak and another gaussian for the two or more highly overlapped orthorhombic peaks. The areas of each peak should correspond approximately to the fraction of each phase.
Figure 9 shows the fraction of the hexagonal phase obtained this way for the 3 angular intervals. The hysteresis produces here a difference of approximately 12 C. Magnetization measurements show a somewhat higher thermal hysteresis difference at half height, 14 C, which might indicate that the magnetic coupling is disturbed before the hysteresis is completed. The thermal hysteresis interval obtained from PAC has a large uncertainty (10-13.5 C) but is in agreement with both measurements.
III First-principles calculations
Knowing the lattice location of the PAC probe is of fundamental importance to understand the values obtained. After the decay of 77Br, it is expected that the 77Se PAC probe may be substitutional at the As site, since As has a similar atomic radius and a neighbor atomic number. In order to check this assumption and to see the differences in the hyperfine parameters actually measured at the probe site, we have used ab-initio density functional calculations.
Despite the existence of some published works reporting ab-initio simulations in this system, the hyperfine parameters are usually not reported. The work of Ravindran et al. Ravindran et al. (1999), presents the calculation of the hyperfine parameters and magneto-optical properties, using density functional calculations, of three manganese pnictides MnX (with X=As, Sb and Bi). Their calculations used the FLAPW method and the electric field gradient and magnetic hyperfine field were presented. However, as suggested by A. Svane Svane (2003), the calculated structures of Ravindran et al. (1999) are incorrect, since the positions of Mn and the pnictide were exchanged with respect to the the stable NiAs-type structure. Recently, calculations of the hyperfine parameters in bulk and surfaces of MnAs were also reported, and the correct values were obtained jamal .
Here we also calculate the hyperfine parameters with the similar full potential (L)APW+lo method, as implemented in the Wien2k code Blaha et al. . In this method the space is divided in spheres, centered at the atoms, where the valence states are described by atomic-like functions, and the interstitial space, where plane waves are used.
The Mn and As atomic spheres used have both a radius of a.u. . We checked convergency of the hyperfine parameters and total energy as a function of the number of k-points used for integration in the Brillouin zone and the number of plane waves in the basis. The calculations are spin-polarized and consider a ferromagnetic arrangement of Mn moments. For the calculations of hyperfine parameters, spin-orbit coupling is included, for the other properties no spin-orbit coupling is included, with a scalar-relativistic basis for the valence electrons, while for the core electrons the treatment is always fully-relativistic. For Mn core states are 1s, 2s, 2p, and 3s, and valence states are 3p, 3d, and 4s, while for As 1s, 2s, 2p, 3s, and 3p are core states and 3d, 4s, and 4p are valence states. The PBE Generalized Gradient Approximation Perdew et al. (1996) exchange-correlation functional is used, since the LSDA is known to give poor results in this compound Zhao et al. (2002).
The calculated EFG of the MnAs sites in the hexagonal phase is shown in the table 3. Due to the hexagonal symmetry is zero, and the direction of the principal axis of the EFG tensor is parallel to the c-axis. The EFG inside the spheres, which is almost equal to the total EFG, can be separated in different contributions, since the the states are described in combinations of spherical harmonics, with different angular momentum components. In this case the p-p and d-d contributions of the density are the dominant terms, with V and V. For Mn, V and V V/m2, states with both p and d character contribute to the total EFG. For the As atoms, the states of p character are the dominant contribution with V and V V/m2. Cutting the 3d10 states out of the density calculation the Vzz at As remains almost the same, confirming that the contribution from the As filled d electrons is negligible.
In order to improve the results of the previously mentioned work, we also calculated the EFG at MnSb and MnBi. We discuss them in section IV, along with other quantities.
The Fermi contact hyperfine field at the nucleus is calculated, with the electron density averaged at a sphere with the Thomson radius, , according to the formulation of Blügel et al. Blügel et al. (1987) in which , i. e. the contact hyperfine field is parallel to the average spin density. The contributions of the contact hyperfine field due to core and valence electron density contributions are discriminated in the tables. We remark the fact that while in As the hyperfine field is determined almost exclusively by its valence contribution, caused by the polarization by Mn atoms, the core and valence contributions of Mn cancel in a large amount. This is due to the core polarization mechanism Blugel1987 , where the core hyperfine field in Mn has a negative sign due to the polarization of core electrons by the shell: the majority electrons are attracted to the polarizing electrons while the minority electrons are repelled, resulting in an excess minority charge at the nucleus. The on-site orbital and spin dipolar contributions are also calculated. These contributions are small when compared with the contact hyperfine field. In order to see the change due to different lattice parameters in the hyperfine fields, we calculated also with the low temperature lattice constants Suzuki and Ido (1982), and the obtained values are almost equal (tables 4 and 5). This simply shows that the collinear spin density functional theory calculations cannot reproduce temperature related changes based only on the lattice constants.
The previously obtained hyperfine parameters are in reasonable agreement with the GGA calculations of Jamal et al. jamal . Some differences are expected, since while their calculations consider the full theoretical lattice optimization, we only minimized the atomic forces keeping the lattice parameters fixed at the experimental values. Relative to their results, for the Vzz at Mn and As, small differences of 5% (1.53 against 1.46) and 4% (-3.63 against -3.78) are obtained, respectively. For the hyperfine fields the differences are -9 (present work) compared with 1 T at the As site (small absolute difference) , and 24.7 (present work) compared with 31.8 T at the Mn and As sites.
To compare with the PAC results using the implanted probe, the presence of a highly diluted (ppm) Se probe must be accounted for in supercell calculations. The EFG and hyperfine field were calculated for hypothetical situations where the Se is substituted at As and at Mn sites using Mn15/16Se1/16As and MnSe1/16As15/16) supercells.
The results for supercells with Se concentration of are shown in the table 6. The atomic forces were not high, and were minimized by moving the free atomic coordinates. The small changes in this type of system due to the lattice constants (tables 4 and 5) motivated us to keep using the MnAs room temperature lattice constants. The hyperfine field calculated with the Se atom substitutional at the As or Mn sites would be exact only at 0K (disregarding zero-point effects, which should be small Torumba2006 ). Our closest measured value is at liquid nitrogen.
There is a good agreement of the measured 49 T at 77K when compared with the calculated 54.3 T at the As site. In contrast, for the case in which Se is substitutional at the Mn site, B is too low when compared to the experiment, even near the transition, and the very high V V/m2 immediately discards the possibility that the probe is located there, whereas the EFG is very small for As-site substitutional Se, in agreement with experiment. The calculation of the formation energies for the two substitutions also indicates this assignment,
| (4) |
where is the total energy of the supercell with a Se impurity, is the energy calculated for the pure compound, and is taken as the total energy of nonmagnetic Se. The chemical potential of As or Mn (according to the substituted site) is set as the energies of fcc antiferromagnetic Mn and nonmagnetic rhombohedral As. The formation energy obtained for substitution at the As site is 0.03 eV, while for the Mn substitution it has a higher value of 2.84 eV, confirming the hyperfine calculation. However, since Br is the implanted atom , if there is no time for relocation between the BrSe decay and the PAC measurement, the formation energy of Br should be a better indication. Therefore, we also calculate these formation energies, using the energies of supercells of the same size for the same substitutions, with Br, and the energy of nonmagnetic solid Br2 as , instead of , in the previous formula. The obtained results are 0.94 eV for the Br at As substitution, and 3.95 eV at the Mn site, again confirming the As substitution.
IV Manganese Pnictides
Full potential calculations of the hyperfine parameters and other properties of manganese pnictides were performed by Ravindran et al. Ravindran et al. (1999), but with the anti-NiAs structure. Here we report the same properties as calculated with the FLAPW method, i. e. the spin magnetic moments, the density of states and the hyperfine parameters, with the NiAs-type structure.
The hyperfine parameters are especially sensitive to the type of structure. For the atoms of Mn and As, in the true structure V and V/m2, respectively, while in the anti-MnAs structure V and V/m2.
Table 7 shows the EFG of the three manganese pnictides. The asymmetry parameter and Vzz direction are omitted, since they are always 0 and (0,0,1). The EFG of the pnictide site increases with increasing atomic number (As, Sb, Bi), which coincidentally also happens in the work of Ravindran et al. Ravindran et al. (1999). For the EFG of Mn the situation is reversed, in our calculations its absolute value increases, while their results with the inverted structure have a slight decrease ascribed to volume effects, which cannot be true now.
The spin moments for each atom, calculated inside the LAPW spheres, are presented in table 8. Experimental values and values obtained from other band-structure calculations are also presented. With our calculation, the values obtained, in per formula unit, are now in a better agreement with experiment. Similar calculations (references in table 8), which have used the NiAs-structure, get values which are in accordance to our results. consistently lower than experiment.
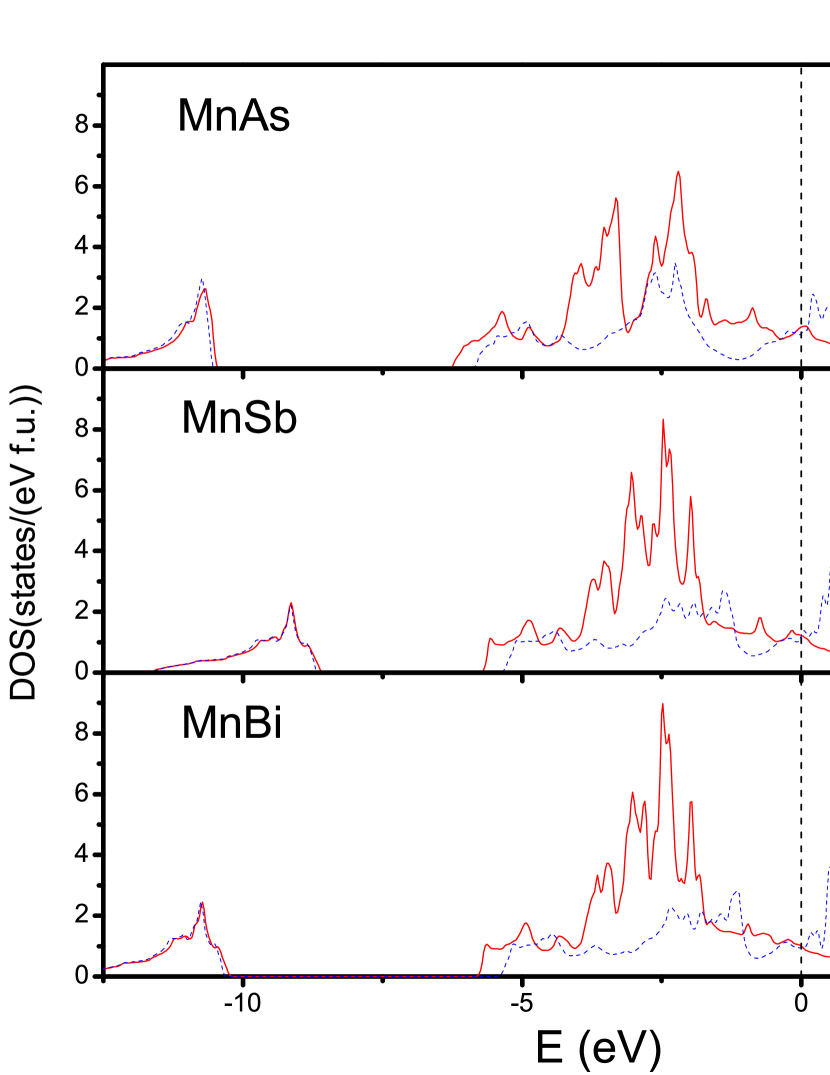
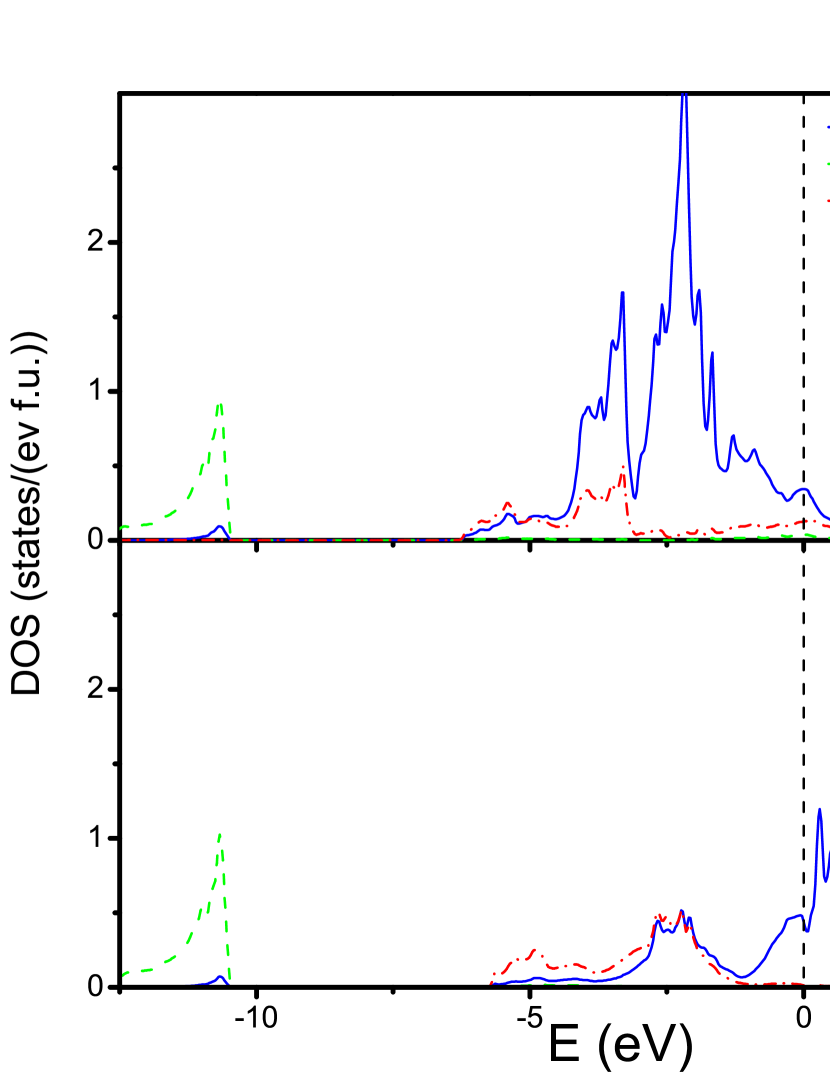
The spin projected density of states (DOS) for the three manganese pnictides is shown in figure 10, with energy reference equal to the Fermi energy. The band structure has been obtained before for these compounds by several authors. Although the DOS obtained by Ravindran et al. (1999) is different, coincidentally most of the qualitative features apply also. Mainly Mn d and pnictide p states hybridize decreasing the free value . In both our study and theirs there are large peaks at the up states, below the Fermi energy, largely due to Mn d states, at approximately -2.5 eV. The Mn d-states for the down spin are shifted to the conduction band. This can be seen in figure 11, where the important states of each atom are discriminated in their s, p and d character. The As s states are nearly isolated between 13 and 10.5 eV below the Fermi energy. The total number of states at the Fermi level is 2.51 for MnAs, 2.22 for MnSb, and 1.95 for MnBi. In comparison, with the anti structure the values are higher, respectively 3.46, 2.78, 2.05 Ravindran et al. (1999), which suggests that the structure is not so stable, as expected . The experimental value of states for MnSb estimated from specific heat measurements Liang and Chen (1977) is also in agreement.
The magnetic hyperfine field increases greatly from MnSb to MnBi, due to the larger polarization from the electrons at the nuclear position, which largely increases due to the additional s-orbitals of higher principal atomic number, and the fact that Mn in MnBi has the larger magnetic moment, so that it polarizes the Bi valence electrons. The magnetic moment of the pnictogen site is very small, so that the core contribution of the hyperfine field is also small. For MnSb, previous NMR measurements have determined a frequency of MHz at low temperatures, attributed to domain wall edge resonances Narasimha Rao (1985), correspondig to a hyperfine field T, equal to our calculated value for the bulk. The hyperfine field has been measured in MnBi, at the Bi atoms by nuclear orientation Koyama et al. (1977), B T, comparing reasonably with our value of 81.8 T.
V Conclusion
We have measured the hyperfine parameters with the perturbed angular correlation method in MnAs. The hysteresis at the hexagonal-orthorhombic 1st order phase transition is clearly seen from a microscopic point of view, complementing the X-ray and magnetization measurements. The hyperfine magnetic field is the same at a given temperature, irrespective of cooling or heating the sample even in the phase coexistence region. This local probe study shows that the magnetization changes observed are mostly due to a change of phase fractions, which can be related to XRD studies. We provide a clear demonstration of the nature of the first-order phase transition, by microscopic observation of phase separation at the hyperfine interactions range (sentitive to approximately less than Å), much shorter than the range of diffraction techniques. We measured phase coexistence in a small interval of temperature ( C), comparable with previous measurements. In contrast, in other cases, PAC measurements were able to find very small coexistent regions of two competing phases, in a much broader temperature range than that given by x-ray diffraction Lopes2006 .
Ab-initio calculations are used to complement the experiment. Realistic simulations of the diluted probe with supercell calculations show that the 77Se probe, if substitutional, is located at the As site. This information is taken from the comparison of calculated and measured hyperfine parameters, and it is verified by the calculated formation energies. Our results reproduce the hyperfine field at low temperature with good quantitative agreement.
It may be interesting to try an experiment with a probe of high quadrupole moment, since in this case the EFG is very small and has an overlying high amplitude magnetic hyperfine field, which makes its accurate determination difficult. Improved results for the compounds MnSb and MnBi, of hyperfine parameters, magnetic moments and density of states were also presented and discussed.
Acknowledgements.
This work was supported by the Portuguese Foundation for Science and Technology FCT, with projects CERN-FP-109357-2009, CERN-FP-109272-2009, the German BMBF funding resources and by the ISOLDE collaboration with approved project IS487. J. N. Gonçalves acknowledges FCT PhD grant SFRH/BD/42194/2007. The authors gratefully acknowledge S. Gama for supplying the MnAs samples, R. Soares for XRD measurements and H. Haas for useful discussions.References
- Wada and Tanabe (2001) H. Wada and Y. Tanabe, Applied Physics Letters, 79, 3302 (2001).
- Gama et al. (2004) S. Gama, A. A. Coelho, A. de Campos, A. M. G. Carvalho, F. C. G. Gandra, P. J. von Ranke, and N. A. de Oliveira, Phys. Rev. Lett., 93, 237202 (2004).
- de Campos et al. (2006) A. de Campos, D. L. Rocco, A. M. G. Carvalho, L. Caron, A. A. Coelho, S. Gama, L. M. da Silva, F. C. G. Gandra, A. O. dos Santos, L. P. Cardoso, P. J. von Ranke, and N. A. de Oliveira, Nat Mater, 5, 802 (2006).
- Daweritz (2006) L. Daweritz, Reports on Progress in Physics, 69, 2581 (2006).
- Ramsteiner et al. (2002) M. Ramsteiner, H. Y. Hao, A. Kawaharazuka, H. J. Zhu, M. Kästner, R. Hey, L. Däweritz, H. T. Grahn, and K. H. Ploog, Phys. Rev. B, 66, 081304 (2002).
- Sandratskii and Sasioglu (2006) L. M. Sandratskii and E. Sasioglu, Physical Review B, 74, 214422 (2006).
- Rungger and Sanvito (2006) I. Rungger and S. Sanvito, Physical Review B, 74, 024429 (2006).
- Niranjan et al. (2004) M. K. Niranjan, B. R. Sahu, and L. Kleinman, Physical Review B, 70, 180406 (2004).
- Ravindran et al. (1999) P. Ravindran, A. Delin, P. James, B. Johansson, J. M. Wills, R. Ahuja, and O. Eriksson, Physical Review B, 59, 15680 (1999).
- Łażewski et al. (2010) J. Łażewski, P. Piekarz, J. Toboła, B. Wiendlocha, P. T. Jochym, M. Sternik, and K. Parlinski, Phys. Rev. Lett., 104, 147205 (2010).
- Mira et al. (2003) J. Mira, F. Rivadulla, J. Rivas, A. Fondado, T. Guidi, R. Caciuffo, F. Carsughi, P. G. Radaelli, and J. B. Goodenough, Physical Review Letters, 90, 097203 (2003).
- Bean and Rodbell (1962) C. P. Bean and D. S. Rodbell, Phys. Rev., 126, 104 (1962).
- Goodenough and Kafalas (1967) J. B. Goodenough and J. A. Kafalas, Physical Review, 157, 389 (1967).
- Nascimento et al. (2006) F. C. Nascimento, A. O. D. Santos, A. D. Campos, S. Gama, and L. P. Cardoso, Materials Research, 9, 111 (2006).
- Wilson and Kasper (1964) R. H. Wilson and J. S. Kasper, Acta Crystallographica, 17, 95 (1964).
- Ishikawa et al. (2003) F. Ishikawa, K. Koyama, K. Watanabe, and H. Wada, Japanese Journal of Applied Physics, 42, L918 (2003).
- Ishikawa et al. (2004) F. Ishikawa, K. Koyama, K. Watanabe, and H. Wada, Physica B: Condensed Matter, 346-347, 408 (2004), proceedings of the 7th International Symposium on Research in High Magnetic Fields.
- Gama et al. (2009) S. Gama, A. de Campos, A. a. Coelho, C. S. Alves, Y. Ren, F. Garcia, D. E. Brown, L. M. da Silva, a. M. G. Carvalho, F. C. G. Gandra, A. O. dos Santos, L. P. Cardoso, and P. J. von Ranke, Advanced Functional Materials, 19, 942 (2009).
- Schatz and Weidinger (1996) G. Schatz and A. Weidinger, Nuclear Condensed Matter Physics: Nuclear Methods and Applications (Wiley & Sons, Ltd., Sussex, 1996).
- Kirchschlager et al. (1981) B. Kirchschlager, H. Berg, and K. Bärner, Physics Letters, 82, 46 (1981).
- Abdelgadir et al. (1988) M. A. Abdelgadir, L. Häggström, T. Sundqvist, and F. G. H., Physica Scripta, 37, 373 (1988).
- Pinjare and Rama Rao (1982) S. Pinjare and K. Rama Rao, Journal of Magnetism and Magnetic Materials, 30, 27 (1982).
- (23) Y. Amako, H. Nagai, and H. Ido, Journal of Magnetism and Magnetic Materials 272-276, E1617 (2004)
- Stone (2005) N. Stone, Atomic Data and Nuclear Data Tables, 90, 75 (2005).
- Butz et al. (1989) T. Butz, S. Saibene, T. Fraenzke, and M. Weber, Nuclear Instruments and Methods in Physics Research Section A: Accelerators, Spectrometers, Detectors and Associated Equipment, 284, 417 (1989).
- Barradas et al. (1993) N. P. Barradas, M. Rots, A. A. Melo, and J. C. Soares, Physical Review B, 47, 8763 (1993).
- (27) A.K. Das, C. Pampuch, A. Ney, T. Hesjedal, L. Däweritz, R. Koch, and K.H. Ploog, Physical Review Letters 91, 087203 (2003)
- Svane (2003) A. Svane, Physical Review B, 68, 064422 (2003).
- (29) M. Jamal, S. Javad Hashemifar, and H. Akbarzadeh, Journal of Magnetism and Magnetic Materials 322, 3841 (2010)
- (30) P. Blaha, K. Schwarz, G. K. H. Madsen, D. Kvasnicka, and J. Luitz, WIEN2k - An Augmented Plane Wave + Local Orbitals Program for Calculating Crystal Properties; www.wien2k.at.
- Perdew et al. (1996) J. P. Perdew, K. Burke, and M. Ernzerhof, Phys. Rev. Lett., 77, 3865 (1996).
- Zhao et al. (2002) Y.-J. Zhao, W. T. Geng, A. J. Freeman, and B. Delley, Phys. Rev. B, 65, 113202 (2002).
- Blügel et al. (1987) S. Blügel, H. Akai, R. Zeller, and P. H. Dederichs, Phys. Rev. B, 35, 3271 (1987).
- (34) S. Blügel, H. Akai, R. Zeller, and P.H. Dederichs, Physical Review B 35, 3271 (Mar. 1987)
- Suzuki and Ido (1982) T. Suzuki and H. Ido, Journal of the Physical Society of Japan, 51, 3149 (1982).
- (36) D. Torumba, K. Parlinski, M. Rots, and S. Cottenier, Physical Review B 74, 144304 (2006)
- Liang and Chen (1977) K. Liang and T. Chen, Solid State Communications, 23, 975–978 (1977).
- Narasimha Rao (1985) C. Narasimha Rao, Journal of Magnetism and Magnetic Materials, 50, 107 (1985).
- Koyama et al. (1977) H. Koyama, K. Nagamine, N. Nishida, K. Tanaka, and T. Yamazaki, Hyperfine Interactions, 5, 27–44 (1977).
- Yamaguchi and Watanabe (1983) Y. Yamaguchi and H. Watanabe, Journal of Magnetism and Magnetic Materials, 31-34, 619 (1983).
- Katoh et al. (1986) K. Katoh, A. Yanase, and K. Motizuki, Journal of Magnetism and Magnetic Materials, 54-57, 959 (1986).
- Oppeneer et al. (1996) P. M. Oppeneer, V. N. Antonov, T. Kraft, H. Eschrig, A. N. Yaresko, and A. Y. Perlov, Journal of Applied Physics, 80, 1099 (1996).
- Bouwma et al. (1971) J. Bouwma, C. van Bruggen, C. Haas, and B. Van Laar, Physica, 78 (1971).
- Chen et al. (1977) T. Chen, G. B. Charlan, and R. C. Keezer, Journal of Crystal Growth, 37, 29 (1977).
- Vast et al. (1992) N. Vast, B. Siberchicot, and P. G. Zerah, Journal of Physics: Condensed Matter, 4, 10469 (1992).
- Coehoorn et al. (1985) R. Coehoorn, C. Haas, and R. A. de Groot, Phys. Rev. B, 31, 1980 (1985).
- Podloucky (1984) R. Podloucky, Solid State Communications, 50, 763 (1984).
- Zhiqiang et al. (1991) L. Zhiqiang, L. Helie, L. Wuyan, Z. Zhi, and Z. Qingqi, Solid State Communications, 79, 791 (1991).
- Chen and Stutius (1974) T. Chen and W. Stutius, Magnetics, IEEE Transactions on, 10 (1974).
- Heikes (1955) R. R. Heikes, Phys. Rev., 99, 446 (1955).
- Köhler and Kübler (1997) J. Köhler and J. Kübler, Physica B: Condensed Matter, 237-238, 402 (1997).
- (52) A. M. L. Lopes, J. P. Araújo, J. J. Ramasco, V. S. Amaral, R. Suryanarayanan, and J. G. Correia, Physical Review B 73, 100408 (Mar. 2006)
| C | Phase | |||||||||
| 17 | 78 | 637 | 21 | - | - | - | 22 | 945 | 69 | |
| 35 | 78 | 547 | 28 | - | - | - | 22 | 1466 | 69 | H |
| 41.5 | 78 | 506 | 33 | - | - | - | 22 | 1484 | 55 | |
| 50 | - | - | - | 78 | 29 | 290 | 22 | 1108 | 10 | |
| 45 | - | - | - | 78 | 29 | 330 | 22 | 874 | 96 | O |
| 41 | - | - | - | 78 | 29 | 290 | 22 | 963 | 46 | |
| 141 | - | - | - | 78 | 29 | 435 | 22 | 1324 | 17 | H∗ |
| 21.2 | 78 | 618 | 33 | - | - | - | 22 | 176 | 40 | H |
| 35 | 60 | 546 | 65 | 18 | 28 | 31 | 22 | 176 | 43 | H+O |
| C | ||||||||||
| 21.1 | 70 | 619 | 3 | - | - | - | 30 | 176 | 23 | |
| 40.8 | 70 | 510 | 9 | - | - | - | 30 | 176 | 22 | H |
| 41.3 | 70 | 499 | 12 | - | - | - | 30 | 176 | 18 | |
| 42.3 | 40 | 495 | 10 | 30 | 28 | 20 | 30 | 176 | 10 | H+O |
| 43.5 | - | - | - | 70 | 28 | 24 | 30 | 176 | 9 | |
| 124.5 | - | - | - | 70 | 28 | 26 | 30 | 176 | 27 | |
| 41.4 | - | - | - | 70 | 28 | 36 | 30 | 176 | 17 | |
| 39.5 | - | - | - | 70 | 28 | 46 | 30 | 176 | 24 | O |
| 37.5 | - | - | - | 70 | 28 | 47 | 30 | 176 | 22 | |
| 34.5 | - | - | - | 70 | 28 | 29 | 30 | 176 | 14 | |
| 33.3 | - | - | - | 70 | 28 | 197 | 30 | 176 | 73 | |
| 32.5 | - | - | - | 70 | 28 | 20 | 30 | 176 | 11 | |
| 29.9 | 70 | 571 | 9 | - | - | - | 30 | 176 | 48 | |
| 13.6 | 70 | 648 | 4 | - | - | - | 30 | 176 | 98 | H |
| -196 | 70 | 1050 | 0 | - | - | - | 30 | 57 | 29 |
| Atom | Vzz(V/m2) | Vzz dir. | |
|---|---|---|---|
| Mn | -3.63 | 0 | (0,0,1) |
| As | 1.53 | 0 | (0,0,1) |
| Atom | core | valence | |||
|---|---|---|---|---|---|
| Mn | -6.5 | -39.3 | 32.8 | 0.5 | -3.0 |
| As | 25.0 | 0.4 | 24.5 | -0.1 | -0.2 |
| Atom | core | valence | |
|---|---|---|---|
| Mn | -6.1 | -38.7 | 32.5 |
| As | 25.5 | 0.4 | 35.1 |
| Se at As site | |||||
|---|---|---|---|---|---|
| Vzz(V/m2) | Vzz dir. | ||||
| -0.27 | 0 | (0,0,1) | |||
| core | valence | —— total (T) | |||
| 56.6 | 0.4 | 56.2 | -2.1 | -0.2 | 54.3 |
| Se at Mn site | |||||
| Vzz(V/m2) | Vzz dir. | ||||
| 17.80 | 0 | (0,0,1) | |||
| BC | core | valence | —— total (T) | ||
| -23.1 | -22.9 | -0.2 | 3.4 | -1.8 | -21.5 |
| Compound | Atom | Vzz(V/m2) | V | V |
|---|---|---|---|---|
| MnAs | Mn | -3.63 | -1.45 | -1.70 |
| As | 1.53 | 1.27 | 0.06 | |
| MnSb | Mn | -3.92 | -1.40 | -1.97 |
| Sb | 4.67 | 3.97 | 0.10 | |
| MnBi | Mn | -4.43 | -1.91 | -2.49 |
| Bi | 9.46 | 9.44 | 0.21 |
| V/m2 Compound | Mns | Xs | MnXt |
| MnAs(present work) | 3.29 | -0.14 | 3.17 |
| MnAs(exp.) | -0.23 Yamaguchi and Watanabe (1983) | 3.40 Yamaguchi and Watanabe (1983) | |
| MnAs(theory) | 3.10 Katoh et al. (1986) | ||
| 3.14 | -0.08 | 3.06 Oppeneer et al. (1996) | |
| 3.18 | -0.13 | 3.14 jamal | |
| MnSb(present work) | 3.44 | -0.14 | 3.34 |
| MnSb(exp.) | -0.30 Yamaguchi and Watanabe (1983) | 3.55 Bouwma et al. (1971); 3.50 Chen et al. (1977) | |
| MnSb(theory) | 3.34 | -0.07 | 3.27 Katoh et al. (1986) |
| 3.35 | -0.032 | 3.32 Vast et al. (1992) | |
| 3.30 | -0.06 | 3.24 Coehoorn et al. (1985) | |
| 3.5 | -0.17 | 3.31 Podloucky (1984) | |
| MnBi(present work) | 3.49 | -0.11 | 3.42 |
| MnBi(exp.) | 3.82 Zhiqiang et al. (1991); 3.84 Chen and Stutius (1974); 3.9 Heikes (1955) | ||
| MnBi(theory) | 3.71 | -0.10 | 3.61 Oppeneer et al. (1996) |
| 3.50 | -0.02 | 3.56 Köhler and Kübler (1997) |
| Atom | core | valence | |||
|---|---|---|---|---|---|
| Mn | -6.5 | -39.3 | 32.8 | 0.5 | -3.0 |
| As | 25.0 | 0.4 | 24.6 | -0.1 | -0.2 |
| Mn | -8.5 | -41.5 | 33.0 | 1.2 | -2.8 |
| Sb | 30.6 | -2.0 | 30.8 | 0.1 | -0.5 |
| Mn | -5.8 | -42.1 | 36.3 | 3.6 | -2.8 |
| Bi | 82.6 | -1.2 | 83.8 | 0.2 | -1.0 |